| Issue |
A&A
Volume 693, January 2025
|
|
|---|---|---|
| Article Number | A45 | |
| Number of page(s) | 11 | |
| Section | Stellar structure and evolution | |
| DOI | https://doi.org/10.1051/0004-6361/202451557 | |
| Published online | 03 January 2025 | |
New interpretation of the two hard X-ray sources IGR J17503-2636 and IGR J17507-2647
1
INAF, Istituto di Astrofisica Spaziale e Fisica Cosmica, Via A. Corti 12, I-20133 Milano, Italy
2
INAF, Osservatorio di Astrofisica e Scienza dello Spazio, Via P. Gobetti 101, I-40129 Bologna, Italy
3
Scuola Universitaria Superiore IUSS Pavia, Piazza della Vittoria 15, I-27100 Pavia, Italy
4
INAF, Osservatorio Astronomico di Brera, Via E. Bianchi 46, I-23807 Merate, (LC), Italy
5
Max-Planck-Institut für extraterrestrische Physik, Giessenbachstrasse, D-85748 Garching, Germany
6
School of Physics and Astronomy, University of Southampton, Southampton SO17 1BJ, UK
⋆ Corresponding author; lara.sidoli@inaf.it
Received:
18
July
2024
Accepted:
21
November
2024
We report on the results of X-ray observations (XMM–Newton, INTEGRAL and Swift) of two hard X-ray sources, IGR J17503-2636 and IGR J17507-2647, whose nature is not fully elucidated in the literature. Three XMM–Newton observations covered the field of IGR J17503-2636, in 2020 and twice in 2023. The analysis of the two XMM–Newton observations performed in September 2023, six days apart, did not detect IGR J17503-2636, allowing us to pose the most stringent 3σ upper limit on the source flux to date (∼9.5 × 10⁻¹⁴ erg cm−2 s−1, 2–10 keV, flux corrected for absorption). This value implies that the amplitude of the X-ray flux variability exceeds a factor of ∼2100, compared with the discovery outburst in 2018. A candidate X-ray periodicity at 0.335397(3) seconds has been barely detected (significance of ∼3.8σ) from IGR J17503-2636 with XMM–Newton (pulsed fraction of (10 ± 1)%). The new data, put into the context of previous literature, allow us to propose a new classification of IGR J17503-2636 as a symbiotic X-ray binary, rather than a candidate supergiant fast X-ray transient. IGR J17507-2647 was formerly reported below 10 keV only during Chandra observations performed in 2009. We report here on two XMM–Newton observations that serendipitously covered the source field in 2020 and in 2023, finding a stable X-ray emission, both in X-ray flux and spectral shape. The long-term, persistent X-ray emission has also been probed by several Swift/XRT short observations and by INTEGRAL data spanning several years. We have detected an iron line in the emission (with centroid energy in the range of 6.3–6.6 keV), never reported before in the IGR J17507-2647 spectrum. The source properties favor the identification with a cataclysmic variable.
Key words: accretion / accretion disks / binaries: general / stars: neutron / novae / cataclysmic variables / pulsars: general
© The Authors 2024
 Open Access article, published by EDP Sciences, under the terms of the Creative Commons Attribution License (https://creativecommons.org/licenses/by/4.0), which permits unrestricted use, distribution, and reproduction in any medium, provided the original work is properly cited.
This article is published in open access under the Subscribe to Open model. Subscribe to A&A to support open access publication.
1. Introduction
The catalogs of hard X-ray sources discovered by the INTEGRAL satellite (IGRs) include many unclassified objects, or sources for which only a tentative identification has been proposed, deserving confirmation. In particular, we have been searching the IBIS catalogs (Bird et al. 2006, 2007, 2010, 2016) for IGRs that have been suggested to be X-ray binaries (XRBs) and, in particular, candidate supergiant fast X-ray transients (SFXTs), thanks to follow-up observations at softer energies (below 10 keV). To obtain a more in-depth view, we have searched the public high-energy archives for unpublished observations covering the source sky regions. Here, we focus on two IGRs, IGR J17503-2636 and IGR J17507-2647, falling within three XMM–Newton observations. Their small angular distance (∼10 arcmin) implies that they can be observed within the same XMM–Newton pointing. Therefore, we have decided to discuss them together in this paper.
The X-ray transient IGR J17503-2636 was discovered on August 11, 2018, during observations with Jem-X on board the INTEGRAL satellite (Chenevez et al. 2018). It showed fluxes of 2 × 10⁻¹⁰ erg cm−2 s−1 (3–10 keV) and 1.9 × 10⁻¹⁰ erg cm−2 s−1 (10–25 keV). However, it was not detected by IBIS/ISGRI on board INTEGRAL above 20 keV, with an upper limit (3σ) of 10 mCrab (20–40 keV). A Swift/XRT observation performed two days later refined the sky position (Chenevez et al. 2018). The spectrum was highly absorbed (NH = (13 ± 5)×1022 cm−2) and showed an intrinsic flux of 1.4−0.2+0.3 × 10⁻¹⁰ erg cm−2 s−1 (2–10 keV) when fit with a power law model (with a photon index of Γ = 0.5 ± 0.6; Ferrigno et al. 2019). The source sky position was refined at the sub-arcsec level thanks to a Chandra observation performed on August 23, 2018 (Chakrabarty et al. 2018a,b). During this observation, the source was faint (0.010(3) counts s−1, HRC-S), with an absorbed flux of 2.9 × 10⁻¹² erg cm−2 s−1 (0.2–10 keV), assuming a power law model (photon index of Γ = 2 and NH = 1 × 1023 cm−2). NuSTAR, NICER, and Swift/XRT follow-up observations performed during the discovery outburst were reported by Ferrigno et al. (2019, 2022), showing a long-term X-ray flux variability by a factor of about 300. A flux variability on much shorter timescales of a few seconds to a few thousand seconds was observed (0.3–80 keV, Ferrigno et al. 2019). Some spectral variability is also present, as well as a changing absorbing column density, likely local to the source (Ferrigno et al. 2019). A fluorescent iron line was observed in NuSTAR data, together with a hint of a cyclotron feature at 20 keV. No X-ray pulsations were found (Ferrigno et al. 2019). Masetti et al. (2018) identified the near-infrared (NIR) counterpart of IGR J17503-2636 (Z > 19.9 mag, Y = 17.90 mag, J = 14.23 mag, H = 11.79 mag, Ks = 10.65 mag) and concluded that the NIR photometry is consistent with an heavily reddened OB (super)giant located at a distance of about 10 kpc. This led them to suggest that IGR J17503-2636 is a high-mass X-ray binary (HMXB), belonging to the subclass of the SFXTs (Sguera et al. 2005, 2006; Negueruela et al. 2006). McCollum et al. (2018) modeled the spectral energy distribution (SED) of this object, adding more data and extending measurements to the mid-infrared (MIR) region (Spitzer and WISE data). The best fit of the SED fitting implies a cool giant (M4-6 III star) with an IR excess (at λ > 12 μm). This result questions the conclusion drawn by Masetti et al. (2018) from the NIR photometry, but it has never been discussed further in the literature.
IGR J17507-2647 (also known as IGR J17505-2644) is a hard X-ray source whose behavior is largely unknown. It was discovered by INTEGRAL and reported for the first time in the IBIS catalogs by Bird et al. 2007 (with the name IGR J17507-2647) and by Krivonos et al. (2007) as IGR J17505-2644. In this paper, we adopt the source name IGR J17507-2647. It is also listed in the two subsequently published IBIS catalogs (Bird et al. 2010, 2016), and is consistently best detected in the energy band 18–60 keV as a persistent source. The typical average flux is 1.1±0.1 mCrab in both energy bands 20–40 keV and 40–100 keV (Bird et al. 2016). No further investigation was performed until a Chandra (ACIS-I) observation in February 2009, which pinpointed the soft X-ray counterpart CXOU J175039.4-264436 (Tomsick et al. 2009). The Chandra spectrum was fit with a power law model with a photon index, Γ = 0.44−0.72+0.84, and a high absorbing column density,  cm−2. The flux, corrected for absorption, was 4.5
 erg cm−2 s−1 (0.3–10 keV). The source does not have any 2MASS, DENIS, USNO-B1.0, or USNO-A2.0 counterpart, leading Tomsick et al. (2009) to suggest that the high absorption is probably interstellar, indicative of a large distance, near the Galactic center. In this case, the X-ray luminosity is ∼4 × 1034 erg s−1, favoring an XRB rather than a cataclysmic variable (CV) (Tomsick et al. 2009). A second Chandra observation (HRC-I) targeted on the source was performed a few months later, in August 2009 (Zolotukhin & Revnivtsev 2011), resulting in sky coordinates consistent with the one reported by Tomsick et al. 2009. Zolotukhin & Revnivtsev (2011) marginally detected a NIR counterpart in the UKIDSS-DR3 Galactic Plane Survey (Lucas et al. 2008) inside the Chandra/HRC-I error circle, with K = 18.5 ± 0.4 mag, while in J and H filter only upper limits were derived (J > 20.3 mag, H > 19.3 mag). Assuming that this NIR counterpart is mainly due to emission from an accretion disk in a low-mass X-ray binary (LMXB), these authors estimate an orbital period of ∼390 hours. However, we note that Zolotukhin et al. assume that the source is a LMXB simply based on the sky position in the direction of the Galactic bulge. No Gaia counterparts are available for either IGR source, so the sources’ distances are unknown. In this paper, we report on unpublished, archival X–ray data covering the sky position of both sources, allowing us to obtain a more sensitive spectral investigation of their X-ray emission and to reconsider the source nature proposed previously.
2. Observation and data reduction
The data analyzed here consist of XMM–Newton, Swift and INTEGRAL observations covering the sky position of IGR J17503-2636 and IGR J17507-2647. Given the small angular separation (∼10 arcmin) between them, on two occasions a single XMM–Newton pointing covered both sources, as well as some Swift/XRT observations. In the following sections, we discuss XMM–Newton (Sect. 2.1), Swift (Sect. 2.2), and INTEGRAL observations (Sect. 2.3).
2.1. XMM–Newton
Three unpublished XMM–Newton (Jansen et al. 2001) observations are relevant here: an observation performed in 2020 (ObsID 0844101101) targeted at IGR J17503-2636, and two shorter observations that were part of a survey of the Galactic plane (ObsID 0932190801 and 0932191001). In the following subsections, we discuss them separately, given the different instrument modes and issues depending on the off-axis position.
The log of the observations is reported in Table 1, while in Table 2 we briefly summarize when the two sources have been detected or not, for clarity. Given the faintness of the sources, only EPIC (Strüder et al. 2001; Turner et al. 2001) is relevant.
XMM–Newton observations (MOS2 exposure data are reported).
Sources in the XMM–Newton observations.
In Fig. 1, we show the three EPIC pn images, together with the sky position of the sources of interest. Some stray light contamination produced by a bright source outside the field of view (FoV), probably the bright source GX 3+1, is present. When this contamination lies close to the sky position of the two sources, we mention this issue explicitly.
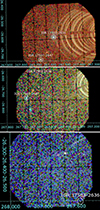 |
Fig. 1. EPIC pn images of the three XMM observations. From top to bottom: ObsID 0844101101, 0932190801, and 0932191001 (0.3–12 keV). The black circles (1′ radius) mark the position of IGR J17503-2636 and IGR J17507-2647. Arches on the right of each image are due to stray light contamination by a bright source located outside the FoV, probably GX 3+1. Equatorial coordinates (J2000) are reported. |
XMM–Newton data were reprocessed using the version 21 of the Science Analysis Software (SAS), with standard procedures. The response and ancillary matrices were generated with RMFGEN and ARFGEN available in the SAS. The background was extracted from source-free regions close to the source position, and was not contaminated by external stray light.
EPIC spectra were simultaneously fit using XSPEC (Arnaud 1996). We included multiplicative constants to take into account calibration uncertainties. We fixed at 1 the multiplicative constant for EPIC pn spectra, while we left the multiplicative constant of EPIC MOS1 and MOS2 free to vary during the fitting procedure. After fitting, we checked that these constant factors were always compatible with 1, for all spectra analyzed here. When fitting the spectra, the absorption model TBABS was used, with photoelectric absorption cross sections of Verner et al. (1996) and the interstellar abundances of Wilms et al. (2000). The spectra were rebinned to have at least 20 counts per bin, to apply the χ2 statistics. All spectral uncertainties are given at a 90% confidence level, for a single interesting parameter (Avni 1976), using the tool ERROR1 in XSPEC (Arnaud 1996).
The uncertainties on the unabsorbed X-ray fluxes (UFs) were derived using the CFLUX tool in XSPEC. When the sources were undetected, upper limits on the net count rates (2–12 keV) were estimated using the EUPPER tool, available in the SAS. Exposure maps were produced using the SAS tool EEXPMAP.
2.1.1. ObsID 0844101101
The archival XMM–Newton (Jansen et al. 2001) observation ID 0844101101, performed in April 2020, was targeted at IGR J17503-2636. The EPIC FoV also covered the position of IGR J17507-2647. EPIC pn operated in full frame mode, adopting the medium filter. MOS1 operated in a small window and MOS2 in timing mode. All three cameras were available for data reduction and product extraction of IGR J17503-2636, whereas for the off-axis source IGR J17507-2647 we could extract products only for the pn and MOS2 (falling on an external charge-coupled device, CCD, operated in imaging mode). In fact, the CCD of the MOS1 camera covering the position of the off-axis source was not operational.
Source light curves and spectra were extracted from circular regions centered on the source emission, with a 15″ radius for IGR J17507-2647 and 30″ for IGR J17503-2636, and selecting a pattern from 0 to 4 (EPIC pn), and from 0 to 12 (MOS). Background spectra were obtained from larger regions (with a radius of 60″) offset from the source position, but on the same CCD, and away from the stray light contamination. For the MOS2 data in timing mode, the source spectrum was extracted selecting counts with RAWX coordinates in the range of 295–315, with a background spectrum extracted from the strip 255–265 (RAWX pixels).
2.1.2. ObsID 0932190801
This EPIC observation is part of the Survey of the Galactic plane and it serendipitously covered the sky position of IGR J17503-2636 and IGR J17507-2647. However, only IGR J17507-2647 was detected and it was bright enough for spectroscopy (reported in Sect. 3.1.2), while for IGR J17503-2636 we have calculated the upper limits on its X-ray flux (Sect. 3.1.2).
2.1.3. ObsID 0932191001
This EPIC observation is part of the Survey of the Galactic plane and it serendipitously covered the sky position of IGR J17503-2636 only. Since in this observation IGR J17503-2636 was undetected, we have calculated upper limits on its X-ray flux, which are reported in Sect. 3.1.3.
2.2. Neil Gehrels Swift Observatory
The log of the Neil Gehrels Swift observations (Swift hereafter) analyzed here is reported in Table 3. The XRT observations were reduced using XRTPIPELINE, adopting standard procedures. Source detection and eventual estimation of the 3σ upper limits to the count rates (0.3–10 keV) was performed using XIMAGE software on images and exposure maps extracted in the energy range 0.3–10 keV. The tools DETECT (to detect the sources) and SOSTA for a proper evaluation of the source count rate (or upper limit) using a local background were used to obtain the source intensity corrected for the point spread function, sampling dead time, and vignetting.
Swift observations analyzed here.
2.3. INTEGRAL
The temporal behavior of both IGR J17507-2647 and IGR J17503-2636 has been investigated above 20 keV with the ISGRI detector, which is the lower energy layer of the IBIS coded mask telescope on board INTEGRAL. INTEGRAL observations are divided into short pointings (science windows, ScWs) whose typical duration is ∼2000 seconds. We considered only ScWs during which the sources were within 12° of the center of the IBIS/ISGRI FoV. A 12° limit is generally applied because the off-axis response of IBIS/ISGRI is not well modeled at large off-axis angles and in combination with the telescope dithering (or the movement of the source within the FoV) it may introduce a significant systematic error in the measurement of the source fluxes. IBIS/ISGRI images for each ScW were generated in the energy band 18–60 keV using the INTEGRAL Science Data Centre (ISDC) offline scientific analysis software (OSA) version 11.2. ISGRI count rates at the position of the sources were extracted from all individual images to produce their long-term light curve on the ScW timescale. Since IGR J17507-2647 and IGR J17503-2636 have a significantly different temporal behavior above 20 keV (i.e., persistent and transient, respectively), we adopted two different methods for our temporal investigation.
IGR J17503-2636 is a transient source discovered by INTEGRAL during revolution 1986 (August 2018); hence, we used public IBIS/ISGRI observations from revolution 30 to 1985 (i.e., from approximately January 2003 to August 2018) to search for any possible transient hard X-ray activity before its discovery. The dataset consists of 19 662 ScWs where the source was within 12° of the center of the IBIS/ISGRI FoV. The corresponding effective exposure time is equal to ∼28 Ms. In particular, we used the bursticity method developed by Bird et al. (2010, 2016) to search for any transient hard X-ray activity in a systematic way. Such a method optimizes the source detection timescale by scanning the IBIS/ISGRI light curve with a variable time window to search for the best source significance value on timescales ranging from 0.5 days to weeks, months, or years. Then, the exact duration, time interval, and energy band over which the source significance is maximized are recorded (results in Sect. 3.3.1).
IGR J17507-2647 is a persistent source best detected in the energy band 18–60 keV, as is reported in the latest published INTEGRAL IBIS catalog, which considered satellite revolutions up to 1000 (Bird et al. 2016). Hence, we used public IBIS/ISGRI observations from revolution 30 to 1000 – that is, from approximately January 2003 to December 2010 – to produce the source long-term light curve (18–60 keV) on the ScW timescale. The dataset consists of 9262 ScWs where the source was within 12° of the center of the instrument FoV. The effective exposure time is equal to ∼12 Ms. The produced long-term light curve was investigated to highlight any possible flaring or strongly variable behavior of the source on top of its persistent nature (results in Sect. 3.3.2).
The summary of the INTEGRAL observations analyzed here is reported in Table 4 for both sources. The interested reader can use this information to download the list of the about 30 000 ScWs from public archives, like HEASARC2.
INTEGRAL observations analyzed (range of the revolution number dataset, effective exposure, start time of the first and last ScW from the rev dataset during which the source was in the FoV.
3. Results
In the following subsections, the results for both sources, obtained with XMM–Newton, Swift, and INTEGRAL satellites are reported.
3.1. XMM–Newton
We report here the EPIC spectral and temporal results, separately for each XMM–Newton observation, for clarity.
3.1.1. XMM–Newton ObsID 0844101101
The results of the time-averaged spectroscopy are reported in Table 5 for both sources. An absorbed power law is already a good fit to the spectrum of IGR J17503-2636, while the addition of a Gaussian line at ∼6.4 keV is needed to account for the emission of IGR J17507-2647. Count spectra, together with the residuals, are shown in Fig. 2. Both sources show a flat power law continuum (with a photon index, Γ, around 1.0) and a very high absorbing column density. The significance of the 6.4 keV line in the spectrum of IGR J17507-2647 was tested running 106 simulations with the tool SIMFTEST in XSPEC, obtaining a probability of 3.70 × 10⁻⁴ that data are consistent with the model without the emission line component.
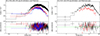 |
Fig. 2. Best fit of the EPIC counts spectra extracted from the whole observation (Obs ID 0844101101): IGR J17503-2636 is reported on the left (EPIC pn in black, MOS1 in red, and MOS2 in blue) and IGR J17507-2647 is on the right (EPIC pn in black, MOS2 in red). Lower panels show the residuals in units of standard deviation. Spectral parameters are listed in Table 5. |
Time-averaged EPIC spectroscopy (Obs ID 0844101101) of IGR J17503-2636 (second column) and IGR J17507-2647 (last four columns). The flux (UF) has been corrected for absorption (1–10 keV). d10 kpc is the source distance in units of 10 kpc.
In order to investigate the eventual contribution to the iron emission line in IGR J17507-2647 by highly ionized iron (6.7 and 6.9 keV lines), we added three Gaussian narrow lines (width fixed at 0) to the absorbed power law continuum. The Gaussian line energies were fixed at 6.4, 6.7, and 6.9 keV. The fit resulted in no evidence for the presence of ionized iron, as is reported in Table 5, where upper limits (90% c.l.) on these line fluxes are reported. The lack of any ionized iron lines (6.7 and 6.9 keV) is confirmed by the fact that fitting the IGR J17507-2647 spectrum with an APEC model (i.e., emission from a collisionally ionized gas, in XSPEC) resulted in a worse fit (χ2 = 135.33 for 101 d.o.f) than the simple power law, with a temperature of kT > 40 keV.
The light curves of both sources, extracted in two energy ranges (above and below 5 keV) are shown in Fig. 3, together with the hardness ratios. Some variability appears in the hardness of IGR J17503-2636 emission (lower panel on the left of Fig. 3), uncorrelated with the source count rate. Therefore, we also performed time-selected spectroscopy of IGR J17503-2636, dividing EPIC exposure into eight intervals, each about 3 ks in duration. The best-fit results adopting an absorbed power law are reported in Table 6 and shown in Fig. 4.
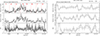 |
Fig. 3. EPIC pn, background-subtracted light curves (Obs ID 0844101101) of both sources (IGR J17503-2636 on the left, IGR J17507-2647 on the right), extracted in two energy ranges (above and below 5 keV), together with their hardness ratios in the lowest panels. Vertical, dash-dotted red lines indicate the eight time intervals used to perform the time-selected spectroscopy (Table 6). |
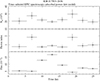 |
Fig. 4. Time-resolved spectroscopy of IGR J17503-2636 (Obs ID 0844101101). Eight temporal segments with an exposure time of about 3 ks are reported (Table 6). In the upper panel is shown the absorbing column density vs time, in the middle panel the power law photon index behavior, and in the lower panel the average observed flux inside each segment. |
Time-selected EPIC spectroscopy of source IGR J17503-2636, adopting a single absorbed power law model (Obs ID 0844101101). The flux is the average observed flux (1–10 keV) in each segment.
These eight time-selected spectra are featureless. Steeper spectra appear to be more absorbed. However, this trend is led by spectra extracted from time intervals 2 and 6. We refit them, fixing the photon index to 0.8, which was obtained in the other temporal segments. The resulting absorbing column densities become NH = 15.8−1.5+1.7 × 1022 cm−2 (spec no. 2) and NH = 17.1−2.0+2.2 × 1022 cm−2 (spec no. 6). The fits are worse (χ2 = 108.91 for 75 d.o.f in segment no. 2; χ2 = 86.46 for 67 d.o.f in segment no. 6).
We note that during the analysis of spectra extracted from time interval no. 6 (Fig. 5), some negative residuals appear at energies around 9.5 keV. We used a cyclotron line model (CYCLABS in XSPEC, multiplying the absorbed power law) to account for it. However, we tested the significance of the line running 106 simulations with the tool SIMFTEST in XSPEC. It returned a probability of 11% that data are consistent with the model without an extra component, implying that this feature is not significant.
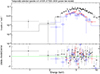 |
Fig. 5. Spectrum no. 6 from the time-resolved spectroscopy of IGR J17503-2636 (Obs ID 0844101101). The model adopted is a simple absorbed power law. Negative residuals appear in both EPIC pn (in black) and MOS2 (in blue). However, this absorption feature is not significant (see text). |
3.1.2. XMM–Newton ObsID 0932190801
During this observation, IGR J17503-2636 was undetected, while IGR J17507-2647 was bright enough for meaningful spectroscopy. We report the results in Table 7. The EPIC light curve of IGR J17507-2647 was very similar to the one observed in Fig. 3, with no evident variability in both intensity and the hardness ratio, along the whole exposure.
Time-averaged EPIC spectroscopy of IGR J17507-2647 (Obs ID 0932190801). The flux (UF) has been corrected for absorption (1–10 keV). d10 kpc is the source distance in units of 10 kpc.
We calculated upper limits for the source flux, adopting the EUPPER tool of the SAS on MOS2 data, which was the only camera for which the source position was not too close to the chip gaps. The local background was evaluated from a circular region near the source, at a similar off-axis position (∼12.3 arcmin), where the effective exposure time reduces to about 3.2 ks. In Table 8, we list the 3σ upper limits to the X-ray flux of IGR J17503-2636. The flux corrected for absorption (UF in this table), calculated in the energy range 2–10 keV, is also reported in the last column, assuming a power law model with a photon index of Γ = 1 and an absorbing column density of NH = 2 × 1023 cm−2.
XMM–Newton 3σ upper limits on the X-ray emission from IGR J17503-2636. UF is the flux, corrected for absorption, evaluated assuming a power law model with Γ = 1 and an absorbing column density of NH = 2 × 1023 cm−2.
3.1.3. XMM–Newton ObsID 0932191001
During this observation of the Milky Way survey, only the sky position of IGR J17503-2636 was inside the FoV, but the source is undetected. In order to evaluate upper limits on the source flux, we considered EPIC pn and MOS1 products, but not MOS2, which is strongly contaminated by stray light at the source position. The source is located at an off-axis position of ∼12.5 arcmin, where the exposure time reduces to about 2.1 ks and 3.3 ks for the pn and MOS 1, respectively. The 3σ upper limits are reported in Table 8. As before, the flux, corrected for absorption (UF; 2–10 keV), was calculated assuming a power law model with a photon index of Γ = 1 and an absorbing column density of NH = 2 × 1023 cm−2.
3.1.4. Timing analysis
We performed a search for periodic pulsations in the two XMM-Newton EPIC-pn observations (ObsIDs: 0844101101 and 0932190801) for the two sources IGR J17503-2636 and IGR J17507-2647, by implementing a Fourier domain acceleration search method via the PRESTO software (see Ransom et al. 2002 for more details on the method). The event files were barycentered using the barycen tool with the source positions derived from the EPIC-pn observations. We then extracted events in the 4–8 keV energy range from a circular region of 15 arcsec radius centered on the source position (for IGR J17503-2636) and an elliptical region (for IGR J17507-2647), created light curves binned to the optimal EPIC-pn resolution of 73 ms, and subtracted the local background. Using this background subtracted light-curve and the accelsearch routine in PRESTO, we detected a possible periodicity candidate for IGR J17503-2636, as is shown in the power spectral density (PSD) in Fig. 6. This candidate was found to have a period of 0.335397(3) seconds, period derivative, Ṗspin, of  s s−1, and a pulsed fraction of (10 ± 1)%, with a significance of ∼3.8σ (after considering the total number of trials in the PSD). In order to correct for the low-frequency (red) noise, we divided the observed PSD by the best-fit phenomenological (constant + power-law) model for the red noise. Moreover, in order to verify whether the periodicity could be associated with the background, we extracted events of the background in the vicinity of the source and ran the same search as above. We did not find any periodicity candidates associated with the background above a significance of 1.5σ.
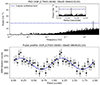 |
Fig. 6. PSD of the EPIC-pn observation of IGR J17503-2636 (ObsID 0844101101) with the 3σ confidence level plotted. Bottom panel: Pulse profile (and best-fit sinusoid) corresponding to the periodicity candidate with a period of 0.3 seconds. |
As a caveat, we note that the significance of the periodicity for IGR J17503-2636 peaks in the 4–8 keV energy range, and has a lower significance of 2σ if events between 2–4 keV are also included. The significance also appears to vary with the size of the source extraction region (with a significance of 3.8σ for a radius of 15 arcsec and a lower significance of 2σ for a radius of 20 arcsec). As a final remark, we note that we could not find any additional archival X-ray dataset to check this candidate periodicity, including Jem-X data during the discovery outburst, where the source could only be detected (Chenevez et al. 2018; Ferrigno et al. 2019).
In the case of IGR J17507-2647, we did not detect any periodic signals above a significance level of 2σ (in the range of 0.2–1000 s). We placed an upper limit on the pulsed fraction of less than 20% (for the candidate with the highest power in the PSD with period of ∼37 seconds).
3.2. Swift
For completeness, we have analyzed the Swift/XRT observations covering the sky positions of both sources, to obtain their long-term light curves. However, we note that most of the Swift/XRT observations of IGR J17503-2636 have already been reported and discussed by Ferrigno et al. (2019) and Ferrigno et al. (2022). Net count rates (0.3–10 keV; per-observation) are reported in Table 9, while the light curves are shown in Fig. 7, with fluxes (1–10 keV) corrected for absorption. The conversion from net count rates to unabsorbed fluxes assumes a power law model with a photon index, Γ, of 1 and a column density of NH = 2 × 1023 cm−2 for IGR J17503-2636 and NH = 1 × 1023 cm−2 for IGR J17507-2647. The Swift long-term light curve of IGR J17507-2647 shows a stable intensity, with an average flux, corrected for absorption, of 4 × 10⁻¹² erg cm−2 s−1 (1–10 keV).
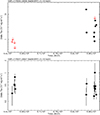 |
Fig. 7. Swift/XRT long-term light curves with fluxes corrected for absorption in the 1–10 keV energy range (IGR J17503-2636 on the top, IGR J17507-2647 on the bottom). Time is in units of MJD (spanning seven years, from July 2012 to May 2019). Fluxes are in units of 10−11 erg cm−2 s−1. Downward red arrows indicate 3σ upper limits on the source intensity. |
Swift/XRT count rates (0.3–10 keV) for both sources. Upper limits are at 3σ.
3.3. INTEGRAL
Both sources were in the FoV of IBIS on board the INTEGRAL satellite. We discuss these sources separately in the following subsections.
3.3.1. IGR J17503-2636
IGR J17503-2636 is a transient source discovered by INTEGRAL on August 11, 2018, during satellite revolution 1986 (Chenevez et al. 2018; Ferrigno et al. 2019). We utilized the bursticity method developed by Bird et al. (2010, 2016) in order to search for any possible transient hard X-ray activity from the source before its discovery. To this aim, we used all public IBIS/ISGRI observations during which the source was in the instrument FoV; that is, from revolution 46 (February 28, 2003) to 1945 (April 23, 2018). No significant transient hard X-ray activity was found in the energy band 18–60 keV. IGR J17503-2636 is not reported in the latest published INTEGRAL IBIS catalog (up to revolution 1000) of Bird et al. (2016), despite an extensive coverage of its sky region for an effective exposure time of ∼12 Ms. This information can be used to infer a 3σ upper limit of 0.3 mCrab or 2.3 × 10⁻¹² erg cm−2 s−1 (20–40 keV) on its hard X-ray flux in quiescence.
Ferrigno et al. (2019) report a duration of ∼12 days for the transient X-ray activity of IGR J17503−2636. However, we note that the true duration could be significantly longer: in fact, the source was discovered during INTEGRAL satellite revolution 1986 (August 2018), and it was not in the IBIS/ISGRI FoV during any previous satellite revolutions back to revolution 1946 (April 23, 2018). Because of this temporal gap of ∼4 months, the duration of the source outburst activity is unconstrained. In principle, it could well be that IGR J17503-2636 was already active when it entered for the first time in the satellite FoV when discovered. This hypothesis is supported i) by the relative weakness of the source 20–40 keV flux (< 8 × 10⁻¹¹ erg cm−2 s−1) when discovered, ii) by the evident declining trend of the source flux when discovered, as has clearly been measured in the soft X-ray band by different X-ray satellites (Ferrigno et al. 2019). All this suggests that the brightest source peak activity had already happened when it entered for the first time in the INTEGRAL FoV and was discovered. Since the source was not detected during the satellite revolution 1945 (April 23, 2018) – the closest observation during which the source was again in the INTEGRAL FoV before its discovery in revolution 1986 – we can place an upper limit of ∼4 months on the outburst duration.
3.3.2. IGR J17507-2647
IGR J17507-2647 is a persistent hard X-ray source best detected in the energy band 18–60 keV. It is characterized by a very stable flux of 1.1 mCrab or 8.3 × 10⁻¹² erg cm−2 s−1 (20–40 keV), as is consistently listed in all the published INTEGRAL catalogs (Bird et al. 2007, 2010, 2016). We produced and investigated the long term IBIS/ISGRI light curve (18–60 keV), spanning a baseline of ∼7 years of observations, in order to highlight any possible flaring or strongly variable behavior of the source on top of its persistent nature, with negative results.
4. Discussion
We have analyzed unpublished X-ray observations of two IGR sources whose nature is uncertain. The XMM–Newton observations have permitted us to obtain the most sensitive view in soft X-rays of IGR J17503-2636 and IGR J17507-2647 to date: we have constrained the lowest luminosity state ever observed from IGR J17503-2636 and discovered a broad iron emission line in the IGR J17507-2647 spectrum, with centroid energy in the range of 6.3–6.6 keV. In parallel, we have analyzed INTEGRAL data, spanning a baseline of about 15 years. We discuss these results in the following subsections.
4.1. IGR J17503-2636
The XMM–Newton observations confirm the X-ray transient behavior of this source, allowing us to pose the most stringent 3σ upper limit on the source flux UF < 9.5 × 10⁻¹⁴ erg cm−2 s−1 (2–10 keV, corrected for absorption). This is the lowest X-ray emission constrained for this source, leading to a dynamic range larger than ∼2100, compared with the flux in outbursts measured by Jem-X (2 × 10⁻¹⁰ erg cm−2 s−1; Chenevez et al. 2018). Our upper limit translates into an X-ray luminosity LX < 1.1 × 1033 d10 kpc2 erg s−1 (2–10 keV), where d10 kpc is the source distance in units of 10 kpc.
During the pointed XMM–Newton observation performed in 2020, the source displayed a very variable X-ray light curve, with some flaring behavior, typical of a wind-fed XRB (Martínez-Núñez et al. 2017). The time-average flux was 1.7 × 10⁻¹¹ erg cm−2 s−1 (1–10 keV), showing a highly absorbed spectrum (NH = 2 × 1023 cm−2), well described by a featureless hard power law model (Γ = 1). Temporally resolved spectroscopy showed a variable power law slope, with a steeper power law when the spectrum was more absorbed.
Our INTEGRAL results highlight the transient nature of IGR J17503−2636. From satellite observations covering a baseline of ∼15 years (2003–2018), the source has been detected in an outburst only once, when it was discovered. It spends the great majority of the time undetected with an hard X-ray flux lower than 0.3 mCrab or 2.3 × 10⁻¹² erg cm−2 s−1 (20–40 keV). At odds with previous literature reporting on short, hard X-ray activity (i.e., Ferrigno et al. 2019), we have demonstrated that the duration of the discovery outburst cannot be exactly determined. However, it cannot be longer than ∼4 months.
Masetti et al. (2018) identified the NIR counterpart of IGR J17503-2636, and interpreted the NIR photometry with emission from a highly absorbed early type supergiant companion, proposing an SFXT nature. SFXTs are HMXBs where a neutron star (NS) accretes matter from the wind of an O- or B-type supergiant companion (Sguera et al. 2005, 2006; Negueruela et al. 2006; Kretschmar et al. 2019). SFXTs show brief outbursts (lasting only a few days), punctuated by short flares during which the X-ray luminosity reaches 1036 − 37 erg s−1 for a few thousand seconds (with a duty cycle of less than 5%; Sidoli & Paizis 2018). SFXTs spend the majority of their lifetime below 1034 erg s−1, down to quiescence, when the luminosity is around 1031 − 32 erg s−1 (Kretschmar et al. 2019; Sidoli et al. 2023).
Ferrigno et al. (2019, 2022) discuss the X-ray light curves and spectra, supporting the proposed SFXT identification of IGR J17503-2636, although they also note something anomalous for an SFXT: the long X-ray outburst and the limited range of X-ray flux variability of a factor of 300 (compared with the typical 103–104). Incidentally, Ferrigno et al. mention an alternative interpretation of the NIR counterpart (McCollum et al. 2018) in a note, but they do not discuss it further and take into consideration only the SFXT scenario.
On the contrary, we think that the results reported by McCollum et al. (2018) deserve attention, since they represent a significant step forward in the analysis of the counterpart: first of all, their dataset extends over a broader range of wavelengths, up to the MIR range, considering also Spitzer and WISE observations. Moreover, these authors performed a fit of the SED, finding that the best fit is an M-type giant star (M4-6 III star), with an excess at longer wavelengths than 12 μm. It is remarkable that a hot massive star resulted in a significantly worse fit. Therefore, in the absence of confirmation by means of IR spectroscopy, we cannot ignore this published result, implying that IGR J17503-2636 is not an SFXT, but a different kind of XRB.
X-ray binaries with M-type giants companions are called symbiotic X-ray binaries (SyXBs; Masetti et al. 2006, Yungelson et al. 2019). SyXBs are a small (13 members, according to Yungelson et al. 2019) subclass of wide binaries (orbital periods > 100 days) composed of an NS accreting from the wind of a late-type (K1-M8) giant star. They display transient X-ray activity, with X-ray luminosity variable in the range of 1032–1036 erg s−1. Some members show X-ray pulsations with long periodicities (from hundred to thousands of seconds). Models to explain their X-ray outbursts share similarities to those proposed for SFXTs. This is not surprising, since these two types of highly magnetized NS wind accretors share many similarities in their observed X-ray properties (e.g., their flux variability and flaring behavior), the donor star (late vs. early type (super)giant star) and their outflowing stellar wind being the main crucial difference. The proposed models include the propeller regime (Afonina & Popov 2024), and the quasi-spherical settling accretion model. This latter was originally developed for HMXB pulsars (Shakura et al. 2012), later applied to SFXTs (Shakura et al. 2014), and then adapted to SyXBs (Yungelson et al. 2019).
In order to apply them to the single sources, the NS magnetic field strength and the pulsar spin period are crucial quantities. For what concerns the NS magnetic field, a hint of a cyclotron scattering feature was reported by Ferrigno et al. (2019) from the analysis of the NuSTAR spectrum of IGR J17503-2636. If confirmed by future observations, this implies an NS magnetic field of B ∼ 2 × 10¹² Gauss. Our timing analysis of XMM–Newton data led to a barely detected periodicity at ∼0.3 s. Since this periodicity needs to be confirmed, the discussion about the nature of IGR J17503-2636 can only be speculative, also in light of the fact that an NS with a spin period of 0.3 s in a binary system with an M giant star has no analogs, to the best of our knowledge. Searching the most recent catalog of LMXBs (including the SyXBs)3 (Avakyan et al. 2023), we found only the sources GRO J1744-28 (Pspin = 0.467 s) and 3A 1822-371 (Pspin = 0.59 s) with similar pulse periods. While for this latter source the spectral type of the donor star is not reported, the companion of the bursting pulsar GRO J1744-28 is a G/KIII star (Gosling et al. 2007; Doroshenko et al. 2020). If the candidate pulse period is confirmed, and if the system is fed by the wind of the giant companion, the spherical settling accretion model can be ruled out, as it applies to much slower pulsars (Shakura et al. 2012; Yungelson et al. 2019). In this case, a wind-fed system (with a pulse period of less than ∼30 s) is in the Bondi-Hoyle accretion stage.
Yungelson et al. (2019) presented their model of population of SyXBs, predicting the distributions of sources in the NS spin period–X-ray luminosity plane (Pspin–LX; their Fig. 2) for optical companions at different evolutionary stages. Remarkably, IGR J17503-2636 would be the first SyXB located in a predicted high number density region of the Pspin–LX diagram, which is still not populated by any known SyXBs (i.e. Log(Pspin) = − 0.5 and LX∼1035).
The fact that IGR J17503-2636 is undetected during two XMM–Newton observations reported here might be explained by the onset of the propeller (the centrifugal barrier halts most of the accretion). If this is the case, the limiting accretion luminosity for the onset of the propeller (Eq. (1) in Campana et al. 2002) is

where the spin period is in units of seconds, the NS magnetic field, B12, is in units of 1012 G, and the NS mass and radius scale as M = M1.4 1.4 M⊙ and R = R6 106 cm. We assume the constant factor ξ = 1 for a spherical symmetry, and M1.4 = 1 and R6 = 1 for the parameters of the NS. If Pspin = 0.3 s and B12 = 2, IGR J17503-2636 should always be in a propeller state, as Llim = 2.6 × 1039 erg s−1, which is orders of magnitude larger than the accretion X-ray luminosity observed with XMM–Newton (for a source in our Galaxy). In conclusion, both candidate values for these NS quantities cannot be true at the same time in IGR J17503-2636: if one of them is confirmed, either B is much lower or the NS rotates much more slowly. Finally, we remark that this conclusion is not affected by the assumptions made about the parameters on the right hand side of Eq. (1). It still holds even for an NS with a 2.5 M⊙ mass and a radius of 12 km, or for ξ = 0.5. The limiting X-ray luminosity from Eq. (1) will always be much larger than the X-ray luminosity of the source, even in the case of a very large distance (i.e., 20 kpc).
4.2. IGR J17507-2647
Besides the INTEGRAL catalog (Bird et al. 2007), the only papers in the literature discussing this source are Tomsick et al. (2009), who identified its Chandra counterpart, and Zolotukhin & Revnivtsev (2011), who found a faint, barely detected NIR counterpart in the UKIDSS-DR3 Galactic Plane Survey (K = 18.5 ± 0.4 mag, J > 20.3 mag, H > 19.3 mag).
We have analyzed two unpublished XMM–Newton observations covering the source sky position. In both datasets, the source is detected at a similar flux, corrected for absorption, of 4 × 10⁻¹² erg cm−2 s−1 (1–10 keV). This is also consistent with the Chandra flux (Tomsick et al. 2009), and with the long-term light curve we have obtained from Swift/XRT observations, indicative of a remarkably stable, persistent X-ray emission. The EPIC spectrum is highly absorbed (NH ∼ 1023 cm−2) and well fit by a flat power law model (photon index in the range from 0 to 1), which is again consistent with the Chandra results. With respect to the Chandra/ACIS-I spectrum, we have detected an iron emission line (at 6.3–6.6 keV) in both XMM–Newton observations, mostly consistent with a Fe Kα line.
We have investigated the long-term INTEGRAL IBIS light curve (18–60 keV) spanning a baseline of ∼7 years of observations in order to search for any possible flaring or strongly variable behavior of the source on top of its persistent nature. We found that IGR J17507-2647 is characterized by a very stable, persistent, and weak hard X-ray emission at a level of ∼8 × 10⁻¹² erg cm−2 s−1 (18–60 keV). This is a behavior similar to that found in the softer X-ray band (1–10 keV).
In previous literature, the source nature was discussed by Tomsick et al. (2009). These authors, based on the lack of a 2MASS, DENIS, USNO-B1.0, or USNO-A2.0 counterpart, suggested that the high absorption derived from the ACIS-I spectrum may be of interstellar origin, implying a large distance (i.e., close to the Galactic center). In this case, they derived an X-ray luminosity of ∼4 × 1034 erg s−1 (at 8.5 kpc). Tomsick et al. (2009) concluded that this luminosity is too large for a CV, favoring an XRB. On the other hand, an LMXB nature was simply assumed by Zolotukhin & Revnivtsev (2011), because of its location in the direction of the Galactic bulge region. Among XRBs, we note that the flat power law spectrum observed both during Chandra and XMM–Newton observations disfavors a LMXB, being more typical of an accreting pulsar in a HMXB, or a CV. But since a HMXB can be ruled out based on the candidate NIR counterpart (see below), we believe that the CV nature is a viable possibility.
We have used the online tool 3D-NH4 (Doroshenko 2024) to obtain the dependence of the absorbing column density, NH, from the distance toward IGR J17507-2647 (we have downloaded this plot and reported it in Fig. 8 with permission by V. Doroshenko). Assuming that the NH we measured (NH in the range of 5–10 × 1022 cm−2) in EPIC spectra is purely interstellar (as was also suggested by Tomsick et al. 2009), this implies a range of values for the pair of quantities, AV, and source distance (d) in between the two extremes, (1) AV ∼ 15 mag and d ∼ 6 kpc (for NH = 5.×1022 cm−2) and (2) AV ∼ 29 mag and d ∼ 16 kpc (for NH = 1.×1023 cm−2).
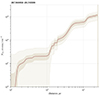 |
Fig. 8. Absorption vs. distance in the direction of IGR J17507-2647, obtained using the online tool http://astro.uni-tuebingen.de/nh3d/nhtool (Doroshenko 2024). The shaded regions show the estimated uncertainties for the estimate of NH, X − ray (light color) and NH, E(B − V) (denser color). |
In these two cases, the NIR counterpart excludes a hot massive star in our Galaxy, even on the main sequence (e.g., B0V), ruling out any type of HMXB. Therefore, the flat X-ray spectra below 10 keV leaves room only for a CV. K-M main sequence stars might match the NIR counterpart of IGR J17507-2647. This would suggest a CV or an LMXB. However, in these cases a significant contribution from an accretion disk might be present (de Martino et al. 2020), so we think that it is premature to engage in any further speculation about a single K-filter measurement. Moreover, we disfavor a LMXB, because these X-ray sources typically display a much steeper X–ray spectrum (Γ ∼ 2) below 10 keV. If we consider a source distance of ∼6 kpc, resulting in an X-ray luminosity of 2 × 1034 erg s−1, this is typical of magnetic CVs (mCVs), hosting a white dwarf with a strong magnetic fields (B > 106 Gauss). The mCVs are observed in a wide range of X-ray luminosities of 1030–1035 erg s−1 and a few times 1034 erg s−1 is a typical value in intermediate polars (IPs; de Martino et al. 2020; Suleimanov et al. 2022). The spectra of IPs are characterized by flat power-law shape with Γ ∼ 1 and iron complex emission at 6–7 keV (a 6.4 keV fluorescent iron line, an Fe XXVI line at 6.9 keV, and an Fe XXV line at 6.7 keV; de Martino et al. (2020)). The mean equivalent width (EW) of the ionized 6.7 keV line in IPs is around 107 ± 17 eV (Xu et al. 2016). The Fe Kα at 6.4 keV detected by XMM–Newton, together with the upper limits we placed on the equivalent width of the ionized iron lines, are also consistent with a mCV nature. The CV nature is also in line with our INTEGRAL results on IGR J17507-2647: if located at 6 kpc, the hard X-ray luminosity is ∼3.5 × 1034 erg s−1 (18–60 keV). In this context, we note that to date all the CVs detected by INTEGRAL above 20 keV are stable, weak, and persistent hard X-ray sources with typical luminosities in the range of 1032 − 34 erg s−1 (Barlow et al. 2006; Revnivtsev et al. 2008; Brunschweiger et al. 2009).
Therefore, we conclude that an mCV nature is favored for IGR J17507-2647.
5. Conclusions
We have reported and discussed X-ray results (XMM–Newton, Swift, and INTEGRAL) for two hard X–ray sources, IGR J17503-2636 and IGR J17507-2647. The main new results on IGR J17503-2636 can be summarized as follows:
-
The analysis of an XMM–Newton observation constrains the source flux in the lowest intensity state ever recorded for this source (< 9.5 × 10⁻¹⁴ erg cm−2 s−1; 3σ, 2–10 keV, corrected for absorption), updating the amplitude of flux variability (2–10 keV), compared with previous observations.
-
The XMM–Newton light curve is highly variable, with several short (∼1 ks) flares, typical of wind-fed X-ray sources.
-
A candidate pulsation at 0.3 s is barely detected (at 3.8σ) in EPIC data, which needs confirmation.
-
If this candidate spin period is confirmed by further observations, it cannot coexist with a high NS magnetic field of 2 × 10¹² G (reported previously in the literature as a candidate value, which needs confirmation too); otherwise, the source would always be in a propeller (i.e., mostly not accreting) state.
-
The XMM–Newton spectrum is very absorbed (NH = 2 × 1023 cm−2), featureless, and flat (power law photon index of Γ ∼ 1, with evidence of variability along the 25 ks EPIC exposure).
-
The duration of the INTEGRAL discovery outburst (the only one bright enough to be detected by INTEGRAL) has been revised and can be constrained to be shorter than ∼4 months (much longer than the duration of ∼12 days previously reported in the literature).
-
This information, put into the context of the alternative identification of the infrared/optical counterpart of IGR J17503-2636 with an M-type giant (McCollum et al. 2018), has led us to propose that IGR J17503-2636 is a SyXB, instead of a SFXT. In fact, we believe that the fit of the SED of the companion star (McCollum et al. 2018) over a large range of energies (compared with Masetti et al. photometry) represents a significant step forward in the identification of the source nature, in the absence of IR/optical spectroscopy.
The main new results that we have obtained for IGR J17507-2647 can be summarized as follows:
-
The XMM–Newton observations show stable and persistent X-ray emission, with a hard X-ray spectrum and a broad iron emission line with centroid energy at ∼6.3–6.6 keV; an iron emission line has never been observed before from this source.
-
The source was always detected during the short Swift/XRT observations spanning 7 years (July 2012–May 2019), with an average flux of 4 × 10⁻¹² erg cm−2 s−1 (1–10 keV, corrected for absorption).
-
The INTEGRAL data highlight the persistent character of its hard X-ray emission, consistent with the properties of mCVs observed by INTEGRAL.
-
These new findings have led us to propose that IGR J17507-2647 is a distant mCV.
Acknowledgments
This research is based on observations performed by the satellites XMM–Newton, INTEGRAL and Swift. This research has made use of data and software provided by the High Energy Astrophysics Science Archive Research Center (HEASARC), which is a service of the Astrophysics Science Division at NASA/GSFC. This research has made use of the VizieR catalog access tool, CDS, Strasbourg, France (Ochsenbein et al. 2000). We acknowledge the use of public data from the Swift data archive. We made use of the tool 3D-NH (http://astro.uni-tuebingen.de/nh3d/nhtool) made publicly available by V. Doroshenko. LS, VS and PE acknowledge funding from INAF through the grant “Bando Ricerca Fondamentale INAF 2023”. RS and PE acknowledge financial support from the Italian Ministry for University and Research, through the grants 2022Y2T94C (SEAWIND) and from INAF through LG 2023 BLOSSOM.
References
- Afonina, M. D., & Popov, S. B. 2024, Universe, 10, 205 [NASA ADS] [CrossRef] [Google Scholar]
- Arnaud, K. A. 1996, ASP Conf. Ser., 101, 17 [Google Scholar]
- Avakyan, A., Neumann, M., Zainab, A., et al. 2023, A&A, 675, A199 [NASA ADS] [CrossRef] [EDP Sciences] [Google Scholar]
- Avni, Y. 1976, ApJ, 210, 642 [NASA ADS] [CrossRef] [Google Scholar]
- Barlow, E. J., Knigge, C., Bird, A. J., et al. 2006, MNRAS, 372, 224 [NASA ADS] [CrossRef] [Google Scholar]
- Bird, A. J., Barlow, E. J., Bassani, L., et al. 2006, ApJ, 636, 765 [NASA ADS] [CrossRef] [Google Scholar]
- Bird, A. J., Malizia, A., Bazzano, A., et al. 2007, ApJS, 170, 175 [Google Scholar]
- Bird, A. J., Bazzano, A., Bassani, L., et al. 2010, ApJS, 186, 1 [NASA ADS] [CrossRef] [Google Scholar]
- Bird, A. J., Bazzano, A., Malizia, A., et al. 2016, ApJS, 223, 15 [Google Scholar]
- Brunschweiger, J., Greiner, J., Ajello, M., & Osborne, J. 2009, A&A, 496, 121 [NASA ADS] [CrossRef] [EDP Sciences] [Google Scholar]
- Campana, S., Stella, L., Israel, G. L., et al. 2002, ApJ, 580, 389 [NASA ADS] [CrossRef] [Google Scholar]
- Chakrabarty, D., Jonker, P. G., & Markwardt, C. B. 2018a, ATel, 11990, 1 [NASA ADS] [Google Scholar]
- Chakrabarty, D., Jonker, P. G., & Markwardt, C. B. 2018b, ATel, 11991, 1 [NASA ADS] [Google Scholar]
- Chenevez, J., Jaisawal, G., Kuulkers, E., et al. 2018, ATel, 11952, 1 [NASA ADS] [Google Scholar]
- de Martino, D., Bernardini, F., Mukai, K., Falanga, M., & Masetti, N. 2020, Adv. Space Res., 66, 1209 [Google Scholar]
- Doroshenko, V. 2024, A&A, submitted [arXiv:2403.03127] [Google Scholar]
- Doroshenko, V., Suleimanov, V., Tsygankov, S., et al. 2020, A&A, 643, A62 [NASA ADS] [CrossRef] [EDP Sciences] [Google Scholar]
- Ferrigno, C., Bozzo, E., Sanna, A., et al. 2019, A&A, 624, A142 [NASA ADS] [CrossRef] [EDP Sciences] [Google Scholar]
- Ferrigno, C., Bozzo, E., & Romano, P. 2022, A&A, 664, A99 [NASA ADS] [CrossRef] [EDP Sciences] [Google Scholar]
- Gosling, A. J., Bandyopadhyay, R. M., Miller-Jones, J. C. A., & Farrell, S. A. 2007, MNRAS, 380, 1511 [NASA ADS] [CrossRef] [Google Scholar]
- Jansen, F., Lumb, D., Altieri, B., et al. 2001, A&A, 365, L1 [NASA ADS] [CrossRef] [EDP Sciences] [Google Scholar]
- Kretschmar, P., Fürst, F., Sidoli, L., et al. 2019, New Astron. Rev., 86, 101546 [Google Scholar]
- Krivonos, R., Revnivtsev, M., Lutovinov, A., et al. 2007, A&A, 475, 775 [NASA ADS] [CrossRef] [EDP Sciences] [Google Scholar]
- Lucas, P. W., Hoare, M. G., Longmore, A., et al. 2008, MNRAS, 391, 136 [Google Scholar]
- Martínez-Núñez, S., Kretschmar, P., Bozzo, E., et al. 2017, Space Sci. Rev., 212, 59 [Google Scholar]
- Masetti, N., Orlandini, M., Palazzi, E., Amati, L., & Frontera, F. 2006, A&A, 453, 295 [NASA ADS] [CrossRef] [EDP Sciences] [Google Scholar]
- Masetti, N., Ferreira, T. S., Saito, R. K., Kammers, R., & Minniti, D. 2018, ATel, 11992, 1 [NASA ADS] [Google Scholar]
- McCollum, B., Laine, S., & McCollum, M. 2018, RNAAS, 2, 193 [NASA ADS] [Google Scholar]
- Negueruela, I., Smith, D. M., Reig, P., Chaty, S., & Torrejón, J. M. 2006, Proc. of the “The X-ray Universe 2005”, 26–30 Sept. 2005, El Escorial, Madrid, Spain (Noordwijk: ESA Pub. Division) [Google Scholar]
- Ochsenbein, F., Bauer, P., & Marcout, J. 2000, A&AS, 143, 23 [NASA ADS] [CrossRef] [EDP Sciences] [Google Scholar]
- Ransom, S. M., Eikenberry, S. S., & Middleditch, J. 2002, AJ, 124, 1788 [Google Scholar]
- Revnivtsev, M., Sazonov, S., Krivonos, R., Ritter, H., & Sunyaev, R. 2008, A&A, 489, 1121 [NASA ADS] [CrossRef] [EDP Sciences] [Google Scholar]
- Sguera, V., Barlow, E. J., Bird, A. J., et al. 2005, A&A, 444, 221 [NASA ADS] [CrossRef] [EDP Sciences] [Google Scholar]
- Sguera, V., Bazzano, A., Bird, A. J., et al. 2006, ApJ, 646, 452 [NASA ADS] [CrossRef] [Google Scholar]
- Shakura, N., Postnov, K., Kochetkova, A., & Hjalmarsdotter, L. 2012, MNRAS, 420, 216 [Google Scholar]
- Shakura, N., Postnov, K., Sidoli, L., & Paizis, A. 2014, MNRAS, 442, 2325 [Google Scholar]
- Sidoli, L., & Paizis, A. 2018, MNRAS, 481, 2779 [NASA ADS] [CrossRef] [Google Scholar]
- Sidoli, L., Ponti, G., Sguera, V., & Esposito, P. 2023, A&A, 671, A150 [NASA ADS] [CrossRef] [EDP Sciences] [Google Scholar]
- Strüder, L., Briel, U., Dennerl, K., et al. 2001, A&A, 365, L18 [Google Scholar]
- Suleimanov, V. F., Doroshenko, V., & Werner, K. 2022, MNRAS, 511, 4937 [NASA ADS] [CrossRef] [Google Scholar]
- Tomsick, J. A., Chaty, S., Rodriguez, J., Walter, R., & Kaaret, P. 2009, ApJ, 701, 811 [NASA ADS] [CrossRef] [Google Scholar]
- Turner, M. J. L., Abbey, A., Arnaud, M., et al. 2001, A&A, 365, L27 [CrossRef] [EDP Sciences] [Google Scholar]
- Verner, D. A., Ferland, G. J., Korista, K. T., & Yakovlev, D. G. 1996, ApJ, 465, 487 [Google Scholar]
- Wilms, J., Allen, A., & McCray, R. 2000, ApJ, 542, 914 [Google Scholar]
- Xu, X.-J., Wang, Q. D., & Li, X.-D. 2016, ApJ, 818, 136 [NASA ADS] [CrossRef] [Google Scholar]
- Yungelson, L. R., Kuranov, A. G., & Postnov, K. A. 2019, MNRAS, 485, 851 [NASA ADS] [CrossRef] [Google Scholar]
- Zolotukhin, I. Y., & Revnivtsev, M. G. 2011, MNRAS, 411, 620 [NASA ADS] [CrossRef] [Google Scholar]
All Tables
INTEGRAL observations analyzed (range of the revolution number dataset, effective exposure, start time of the first and last ScW from the rev dataset during which the source was in the FoV.
Time-averaged EPIC spectroscopy (Obs ID 0844101101) of IGR J17503-2636 (second column) and IGR J17507-2647 (last four columns). The flux (UF) has been corrected for absorption (1–10 keV). d10 kpc is the source distance in units of 10 kpc.
Time-selected EPIC spectroscopy of source IGR J17503-2636, adopting a single absorbed power law model (Obs ID 0844101101). The flux is the average observed flux (1–10 keV) in each segment.
Time-averaged EPIC spectroscopy of IGR J17507-2647 (Obs ID 0932190801). The flux (UF) has been corrected for absorption (1–10 keV). d10 kpc is the source distance in units of 10 kpc.
XMM–Newton 3σ upper limits on the X-ray emission from IGR J17503-2636. UF is the flux, corrected for absorption, evaluated assuming a power law model with Γ = 1 and an absorbing column density of NH = 2 × 1023 cm−2.
All Figures
|
Fig. 1. EPIC pn images of the three XMM observations. From top to bottom: ObsID 0844101101, 0932190801, and 0932191001 (0.3–12 keV). The black circles (1′ radius) mark the position of IGR J17503-2636 and IGR J17507-2647. Arches on the right of each image are due to stray light contamination by a bright source located outside the FoV, probably GX 3+1. Equatorial coordinates (J2000) are reported. |
| In the text | |
|
Fig. 2. Best fit of the EPIC counts spectra extracted from the whole observation (Obs ID 0844101101): IGR J17503-2636 is reported on the left (EPIC pn in black, MOS1 in red, and MOS2 in blue) and IGR J17507-2647 is on the right (EPIC pn in black, MOS2 in red). Lower panels show the residuals in units of standard deviation. Spectral parameters are listed in Table 5. |
| In the text | |
|
Fig. 3. EPIC pn, background-subtracted light curves (Obs ID 0844101101) of both sources (IGR J17503-2636 on the left, IGR J17507-2647 on the right), extracted in two energy ranges (above and below 5 keV), together with their hardness ratios in the lowest panels. Vertical, dash-dotted red lines indicate the eight time intervals used to perform the time-selected spectroscopy (Table 6). |
| In the text | |
|
Fig. 4. Time-resolved spectroscopy of IGR J17503-2636 (Obs ID 0844101101). Eight temporal segments with an exposure time of about 3 ks are reported (Table 6). In the upper panel is shown the absorbing column density vs time, in the middle panel the power law photon index behavior, and in the lower panel the average observed flux inside each segment. |
| In the text | |
|
Fig. 5. Spectrum no. 6 from the time-resolved spectroscopy of IGR J17503-2636 (Obs ID 0844101101). The model adopted is a simple absorbed power law. Negative residuals appear in both EPIC pn (in black) and MOS2 (in blue). However, this absorption feature is not significant (see text). |
| In the text | |
|
Fig. 6. PSD of the EPIC-pn observation of IGR J17503-2636 (ObsID 0844101101) with the 3σ confidence level plotted. Bottom panel: Pulse profile (and best-fit sinusoid) corresponding to the periodicity candidate with a period of 0.3 seconds. |
| In the text | |
|
Fig. 7. Swift/XRT long-term light curves with fluxes corrected for absorption in the 1–10 keV energy range (IGR J17503-2636 on the top, IGR J17507-2647 on the bottom). Time is in units of MJD (spanning seven years, from July 2012 to May 2019). Fluxes are in units of 10−11 erg cm−2 s−1. Downward red arrows indicate 3σ upper limits on the source intensity. |
| In the text | |
|
Fig. 8. Absorption vs. distance in the direction of IGR J17507-2647, obtained using the online tool http://astro.uni-tuebingen.de/nh3d/nhtool (Doroshenko 2024). The shaded regions show the estimated uncertainties for the estimate of NH, X − ray (light color) and NH, E(B − V) (denser color). |
| In the text | |
Current usage metrics show cumulative count of Article Views (full-text article views including HTML views, PDF and ePub downloads, according to the available data) and Abstracts Views on Vision4Press platform.
Data correspond to usage on the plateform after 2015. The current usage metrics is available 48-96 hours after online publication and is updated daily on week days.
Initial download of the metrics may take a while.