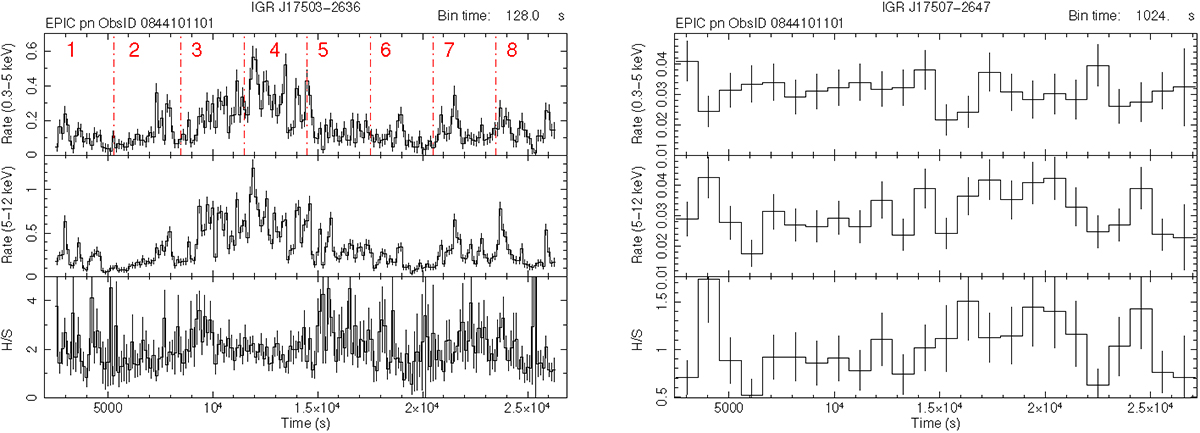
Fig. 3.
Download original image
EPIC pn, background-subtracted light curves (Obs ID 0844101101) of both sources (IGR J17503-2636 on the left, IGR J17507-2647 on the right), extracted in two energy ranges (above and below 5 keV), together with their hardness ratios in the lowest panels. Vertical, dash-dotted red lines indicate the eight time intervals used to perform the time-selected spectroscopy (Table 6).
Current usage metrics show cumulative count of Article Views (full-text article views including HTML views, PDF and ePub downloads, according to the available data) and Abstracts Views on Vision4Press platform.
Data correspond to usage on the plateform after 2015. The current usage metrics is available 48-96 hours after online publication and is updated daily on week days.
Initial download of the metrics may take a while.