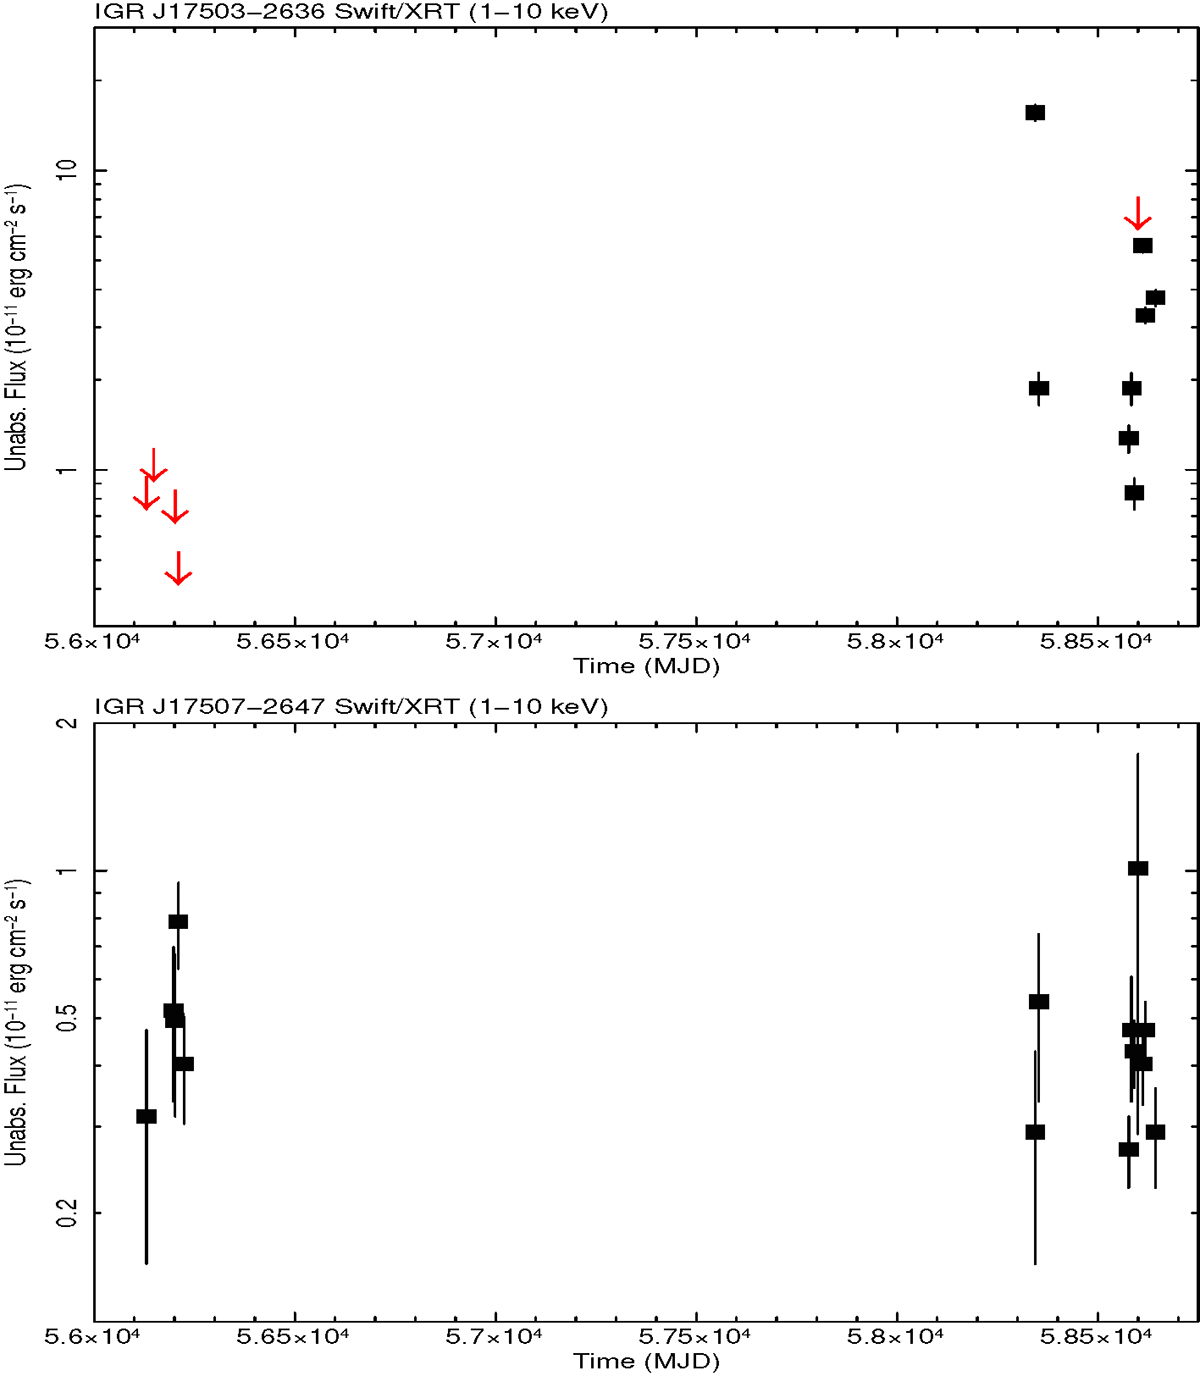
Fig. 7.
Download original image
Swift/XRT long-term light curves with fluxes corrected for absorption in the 1–10 keV energy range (IGR J17503-2636 on the top, IGR J17507-2647 on the bottom). Time is in units of MJD (spanning seven years, from July 2012 to May 2019). Fluxes are in units of 10−11 erg cm−2 s−1. Downward red arrows indicate 3σ upper limits on the source intensity.
Current usage metrics show cumulative count of Article Views (full-text article views including HTML views, PDF and ePub downloads, according to the available data) and Abstracts Views on Vision4Press platform.
Data correspond to usage on the plateform after 2015. The current usage metrics is available 48-96 hours after online publication and is updated daily on week days.
Initial download of the metrics may take a while.