Fig. 4.
Download original image
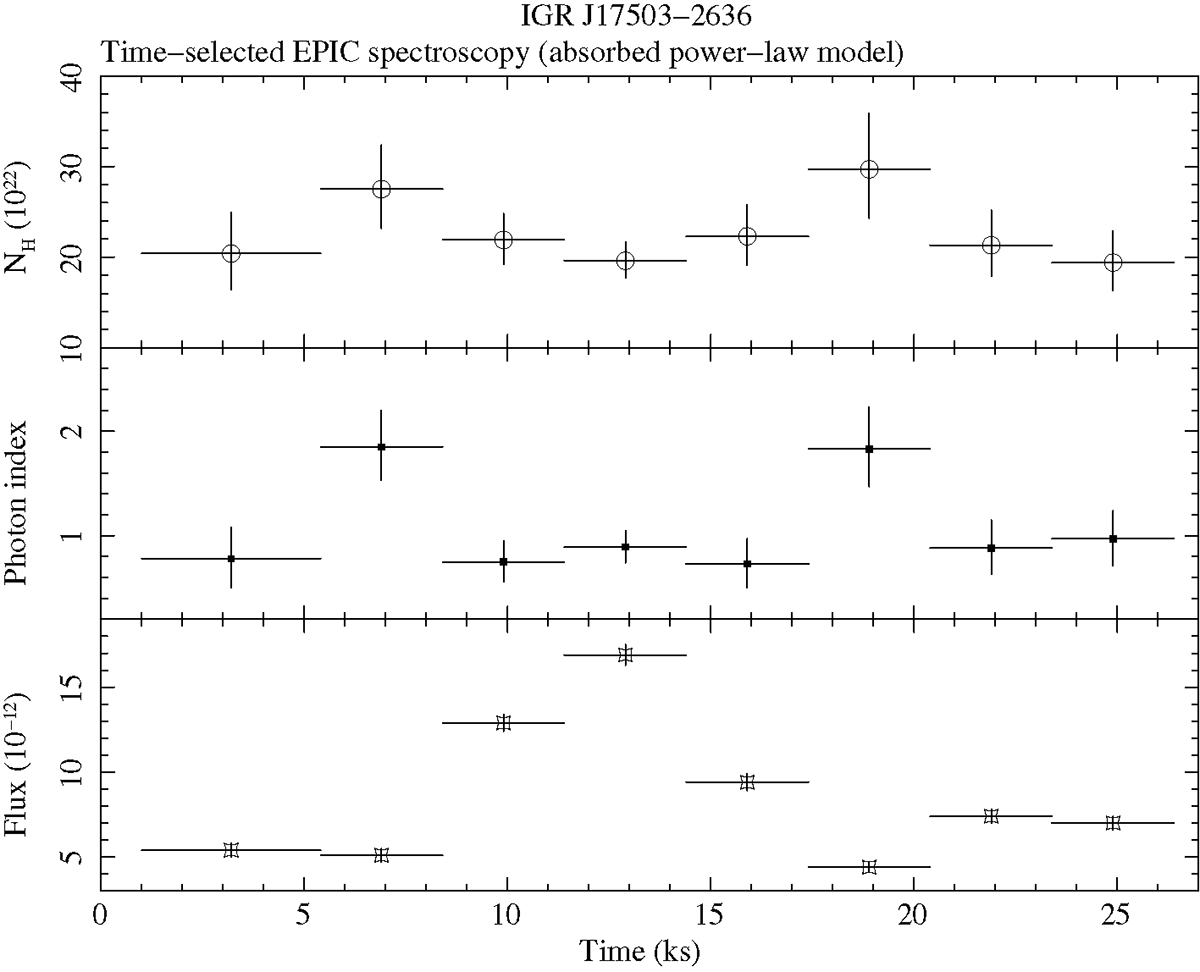
Time-resolved spectroscopy of IGR J17503-2636 (Obs ID 0844101101). Eight temporal segments with an exposure time of about 3 ks are reported (Table 6). In the upper panel is shown the absorbing column density vs time, in the middle panel the power law photon index behavior, and in the lower panel the average observed flux inside each segment.
Current usage metrics show cumulative count of Article Views (full-text article views including HTML views, PDF and ePub downloads, according to the available data) and Abstracts Views on Vision4Press platform.
Data correspond to usage on the plateform after 2015. The current usage metrics is available 48-96 hours after online publication and is updated daily on week days.
Initial download of the metrics may take a while.