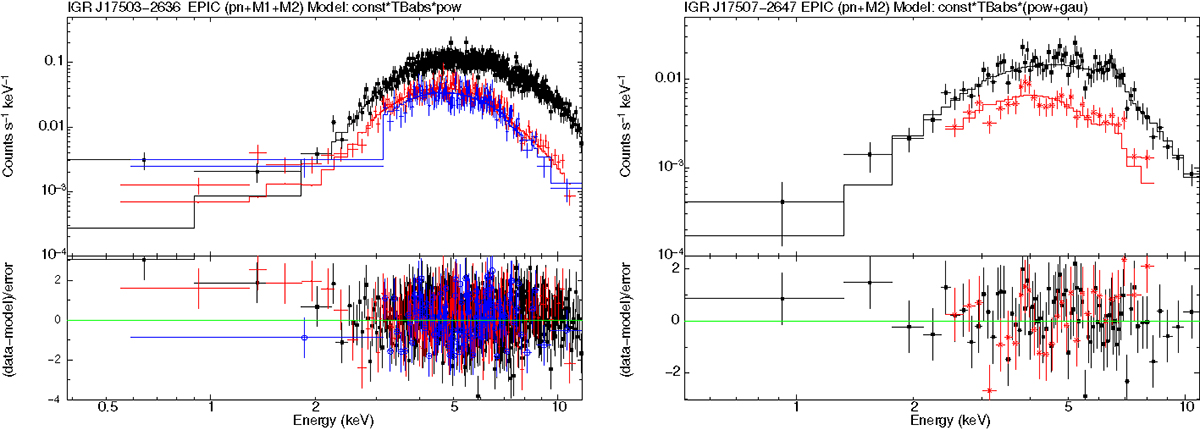
Fig. 2.
Download original image
Best fit of the EPIC counts spectra extracted from the whole observation (Obs ID 0844101101): IGR J17503-2636 is reported on the left (EPIC pn in black, MOS1 in red, and MOS2 in blue) and IGR J17507-2647 is on the right (EPIC pn in black, MOS2 in red). Lower panels show the residuals in units of standard deviation. Spectral parameters are listed in Table 5.
Current usage metrics show cumulative count of Article Views (full-text article views including HTML views, PDF and ePub downloads, according to the available data) and Abstracts Views on Vision4Press platform.
Data correspond to usage on the plateform after 2015. The current usage metrics is available 48-96 hours after online publication and is updated daily on week days.
Initial download of the metrics may take a while.