Fig. 9.
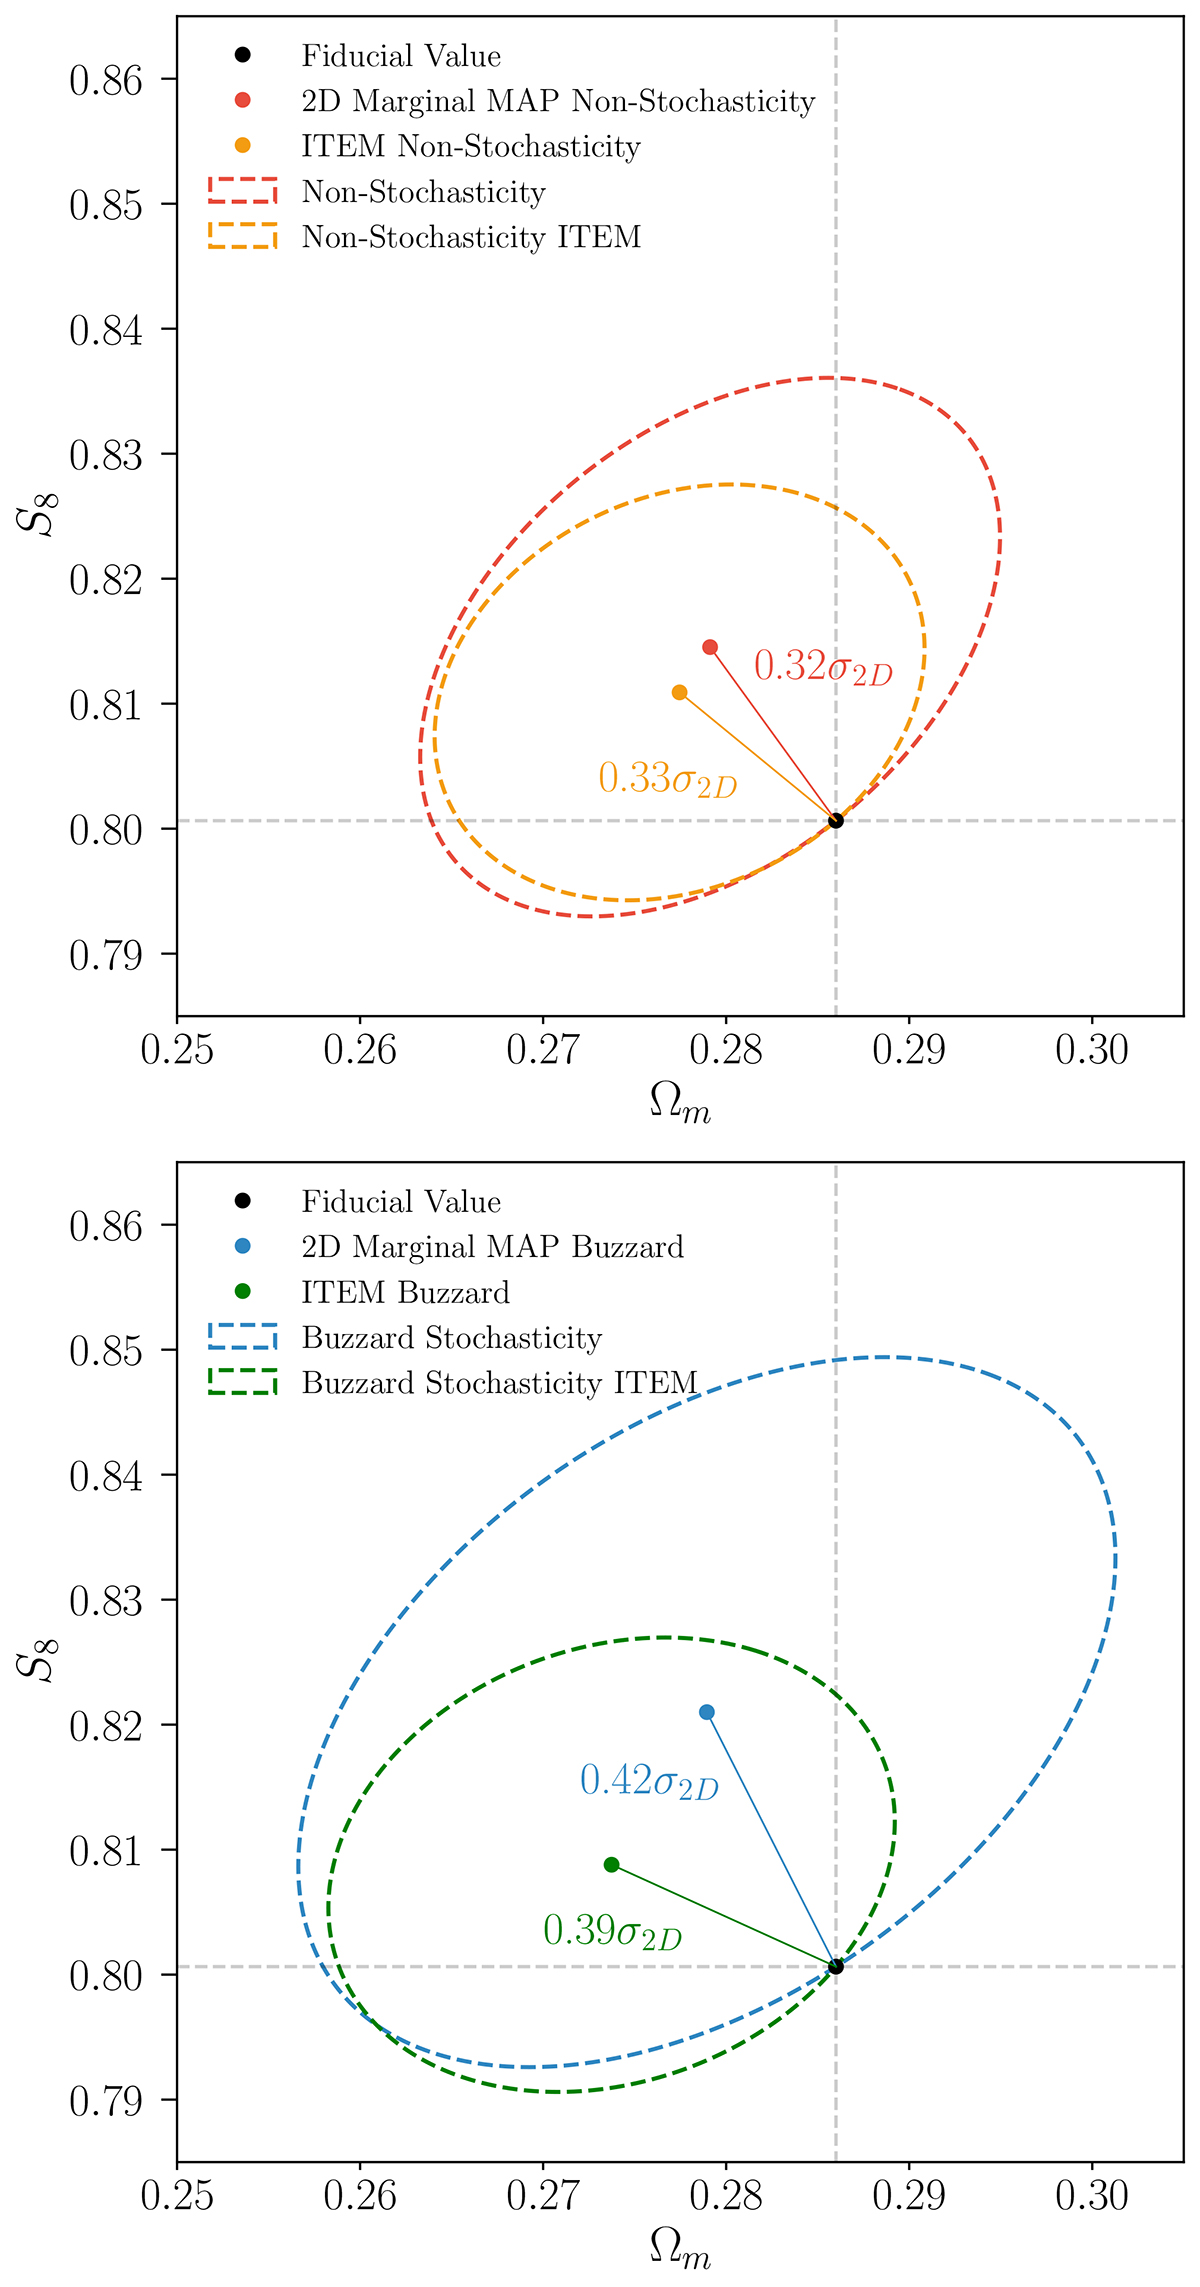
Download original image
Parameter biases of the data vectors with the original and ITEM priors. The red and blue ellipses show wide contours (same from Fig. 6), while the yellow and green ones were obtained after enforcing the 0.4σ2D bias threshold and 1D coverage threshold for the 2D marginalized constraints. Both are centered in their respective 2D marginalized MAP. Due to parameter volume effects, the marginalized constraints from the baseline prior analysis are not centered on the input cosmology. Top: simulated likelihood analysis for the data vector without shot-noise (α0 = 1.0, α1 = 0.0). Bottom: simulated likelihood analysis for the data vector with Buzzard stochasticity (α0 = 1.26, α1 = 0.29). The dashed horizontal and vertical lines indicate the fiducial parameter values.
Current usage metrics show cumulative count of Article Views (full-text article views including HTML views, PDF and ePub downloads, according to the available data) and Abstracts Views on Vision4Press platform.
Data correspond to usage on the plateform after 2015. The current usage metrics is available 48-96 hours after online publication and is updated daily on week days.
Initial download of the metrics may take a while.