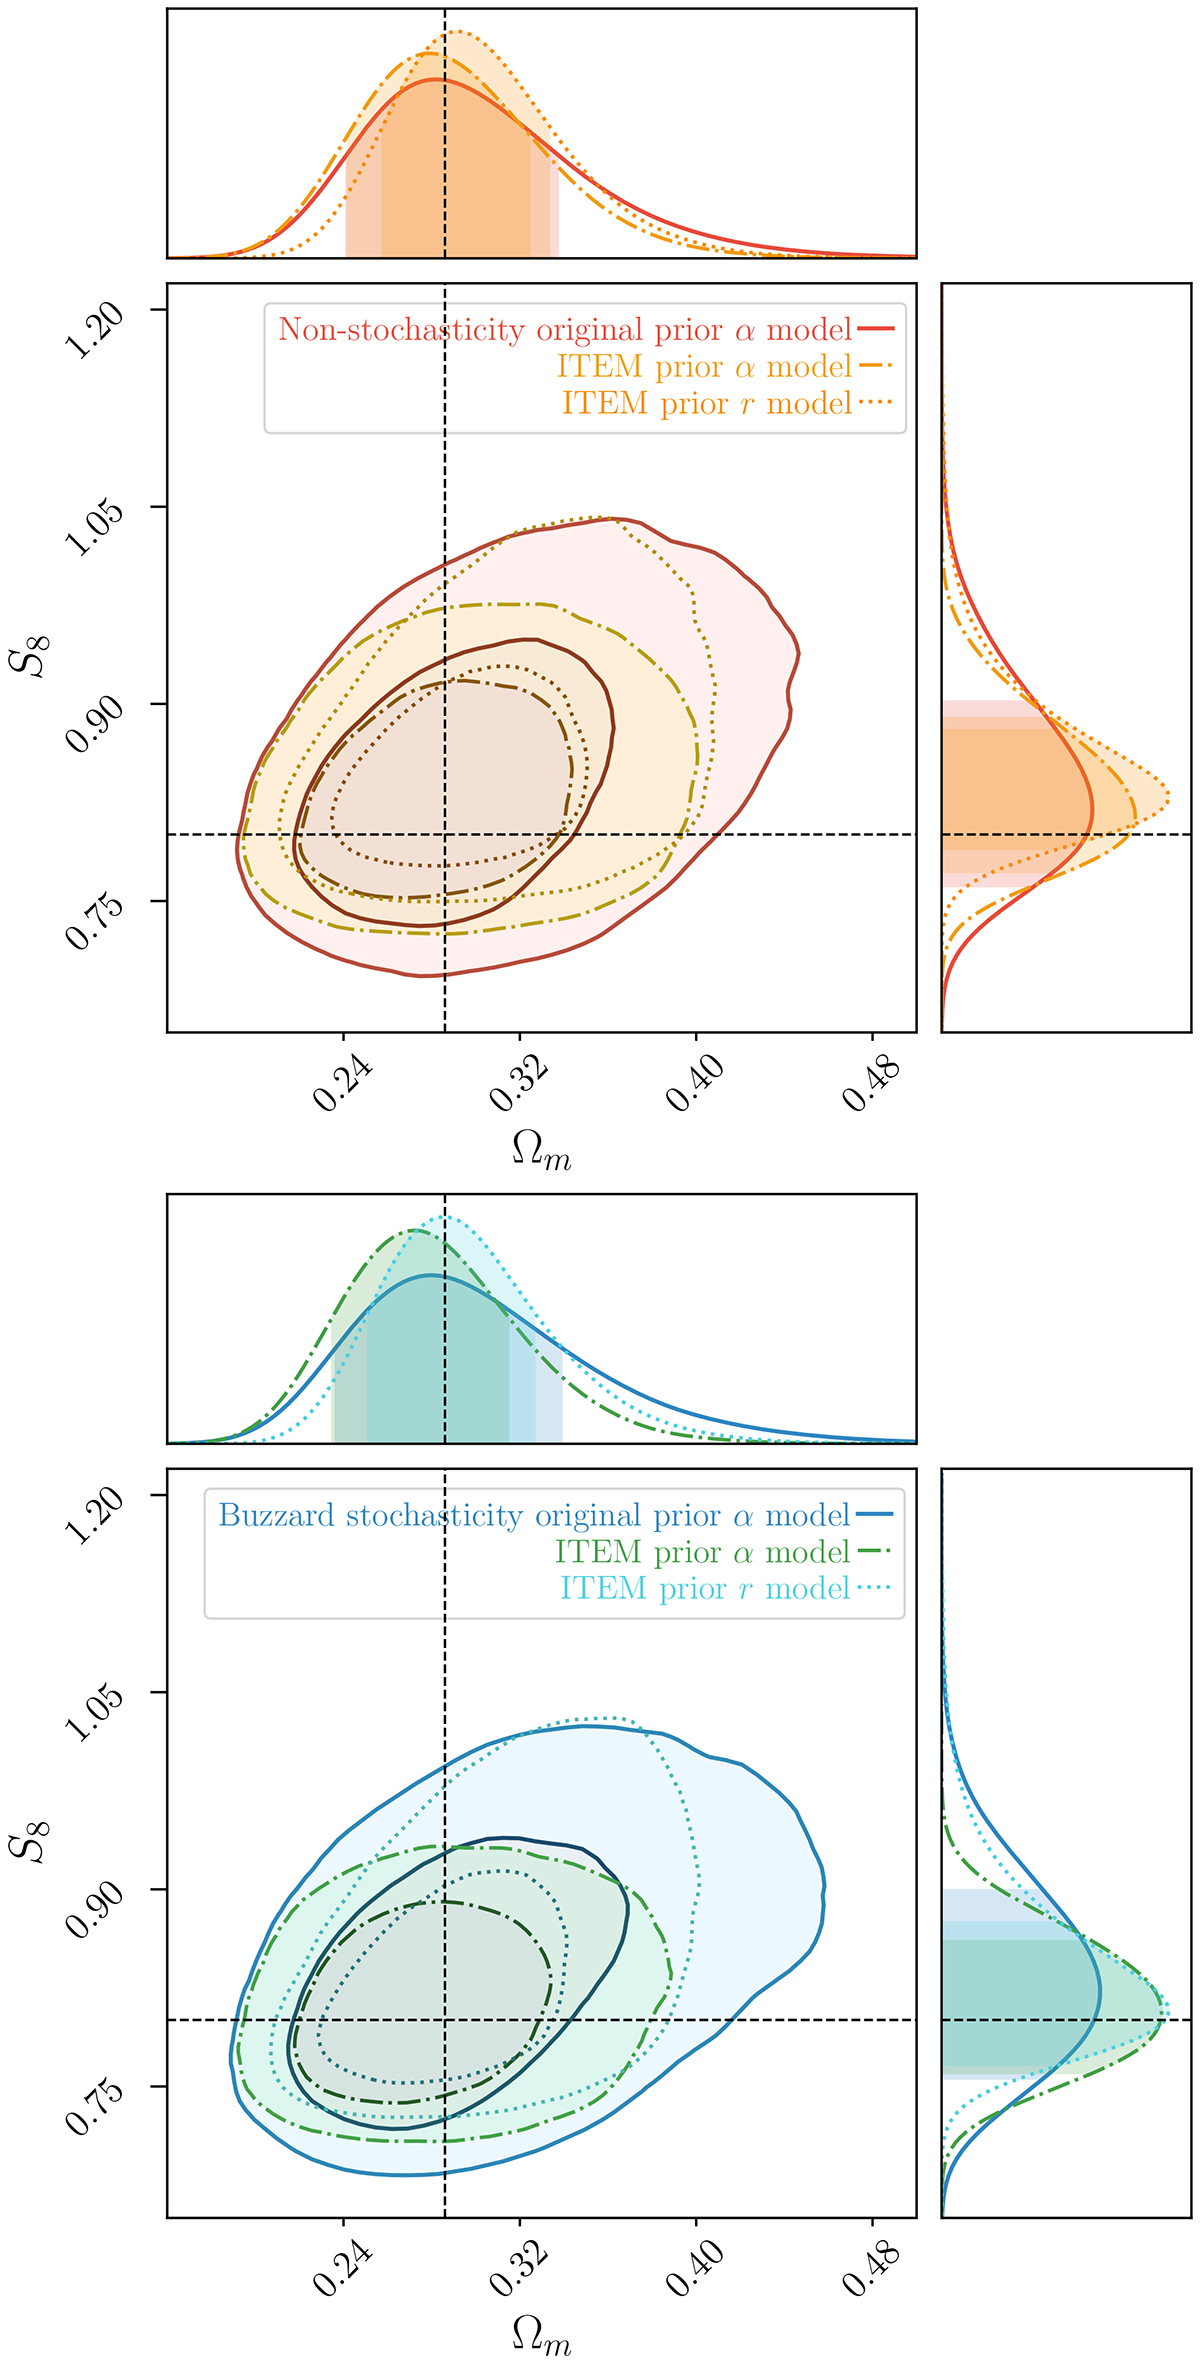
Fig. 10.
Download original image
Marginalized posterior distributions for the chains from the α and r models from DSS. These have been plotted with the widened 1σ and 2σ confidence levels to account for the bias as presented in Sect. 2.3.2. In the top and bottom panels, we illustrate the non-stochasticity and the Buzzard stochasticity respectively. The larger contours correspond to the posterior simulated using the original DSS α model priors. The narrow continuous contours illustrate the one with the ITEM prior on the α model, and the discontinuous contours for the r model.
Current usage metrics show cumulative count of Article Views (full-text article views including HTML views, PDF and ePub downloads, according to the available data) and Abstracts Views on Vision4Press platform.
Data correspond to usage on the plateform after 2015. The current usage metrics is available 48-96 hours after online publication and is updated daily on week days.
Initial download of the metrics may take a while.