| Issue |
A&A
Volume 692, December 2024
|
|
|---|---|---|
| Article Number | A265 | |
| Number of page(s) | 13 | |
| Section | Interstellar and circumstellar matter | |
| DOI | https://doi.org/10.1051/0004-6361/202451659 | |
| Published online | 19 December 2024 | |
Time evolution of o-H2D+, N2D+, and N2H+ during the high-mass star formation process
1
INAF, Osservatorio Astrofisico di Arcetri,
Largo E. Fermi 5,
50125
Firenze,
Italy
2
INAF, Istituto di Radioastronomia – Italian node of the ALMA Regional Centre (It-ARC),
Via Gobetti 101,
40129
Bologna,
Italy
3
Chemistry Department, Sapienza University of Rome,
P.le A. Moro,
00185
Rome,
Italy
4
Departamento de Astronomía, Facultad Ciencias Físicas y Matemáticas, Universidad de Concepción,
Av. Esteban Iturra s/n Barrio Universitario, Casilla 160,
Concepción,
Chile
5
Centre for Astrochemical Studies, Max-Planck-Institut für extraterrestrische Physik,
Gießenbachstraße 1,
85748
Garching bei München,
Germany
6
Max-Planck-Institut für Radioastronomie,
Auf dem Hügel, 69,
53121
Bonn,
Germany
7
Centre for Astrophysics and Planetary Science, University of Kent,
Canterbury
CT2 7NH,
UK
8
INAF, Istituto di Radioastronomia,
Via Gobetti 101,
40129
Bologna,
Italy
9
Instituto de Radioastronomía y Astrofísica UNAM,
Apartado Postal 3-72 (Xangari),
58089
Morelia,
Michoacán,
Mexico
★ Corresponding author; giovanni.sabatini@inaf.it
Received:
25
July
2024
Accepted:
13
November
2024
Context. Deuterium fractionation is a well-established evolutionary tracer in low-mass star formation, but its applicability to the high-mass regime remains an open question. In this context, the abundances and ratios of different deuterated species have often been proposed as reliable evolutionary indicators for different stages of the high-mass star formation process.
Aims. In this study, we investigate the role of N2H+ and key deuterated molecules (o-H2D+ and N2D+) as tracers of the different stages of the high-mass star formation process. We assess whether their abundance ratios can serve as reliable evolutionary indicators.
Methods. We conducted APEX observations of o-H2D+ (110–111), N2H+ (4−3), and N2D+ (3−2) in a sample of 40 high-mass clumps at different evolutionary stages, selected from the ATLASGAL survey. Molecular column densities and abundances relative to H2, X, were derived through spectral line modelling, both under local thermodynamic equilibrium (LTE) and non-LTE conditions.
Results. The o-H2D+ column densities show the smallest deviation from LTE conditions when derived under non-LTE assumptions. In contrast, N2H+ shows the largest discrepancy between the column densities derived from LTE and non-LTE. In all the cases discussed, we found that X(o-H2D+) decreases more significantly with each respective evolutionary stage than in the case of X(N2D+); whereas X(N2H+) increases slightly. Therefore, the validity of the X(o-H2D+)/X(N2D+) ratio as a reliable evolutionary indicator, recently proposed as a promising tracer of the different evolutionary stages, was not observed for this sample. While the deuteration fraction derived from N2D+ and N2H+ clearly decreases with clump evolution, the interpretation of this trend is complex, given the different distribution of the two tracers.
Conclusions. Our results suggest that a careful consideration of the observational biases and beam-dilution effects are crucial for an accurate interpretation of the evolution of the deuteration process during the high-mass star formation process.
Key words: astrochemistry / molecular processes / stars: formation / evolution
© The Authors 2024
 Open Access article, published by EDP Sciences, under the terms of the Creative Commons Attribution License (https://creativecommons.org/licenses/by/4.0), which permits unrestricted use, distribution, and reproduction in any medium, provided the original work is properly cited.
This article is published in open access under the Subscribe to Open model. Subscribe to A&A to support open access publication.
1 Introduction
Massive stars (i.e. M★ > 8 M⊙) are crucial for the energy balance of their host galaxies. They shape the properties of their environments at the different galactic scales through radiation, winds and supernova explosions (e.g. Kennicutt 2005), and enrich the interstellar medium (ISM) with heavy elements (e.g. Smartt 2009). The latter pave the way for the formation of complex organic molecules (COMs; namely, organic molecules with at least six atoms; Herbst & van Dishoeck 2009; Ceccarelli et al. 2023). However, due to the difficulties in observing high-mass star-forming regions (HMSFRs) at different stages of their life cycle (e.g. Zinnecker & Yorke 2007), the formation and evolution of massive stars is still poorly understood. One of the major challenges is to determine the ages of massive young stellar objects, which depends on a wide range of physical conditions and evolutionary phases, from cold and quiescent infrared dark clouds (IRDCs) to hot and ionised HII regions.
One way to estimate the age of HMSFRs is to use chemical clocks, namely, molecular species whose abundances change significantly over time due to chemical reactions, thermal processes, or selective depletion and desorption on dust grains (e.g. Fontani et al. 2007; Beuther et al. 2009; Hoq et al. 2013; Bovino et al. 2019, 2021; Giannetti et al. 2019; Urquhart et al. 2019; Sabatini et al. 2020, 2021; see also van Dishoeck & Blake 1998 for a review). Among the various chemical clocks proposed in the literature, deuterated species, such as N2D+ , and ortho-H2D+ (hereafter, o-H2D+) have received particular attention because of their strong response to gas temperature and ionisation fraction, both of which are expected to increase as star formation progresses (e.g. Bergin & Tafalla 2007 and Socci et al. 2024). Furthermore, H2D+ forms from the trihydrogen cation H3+ reacting with deuterated molecular hydrogen HD, a reaction that is particularly efficient when the temperature is low and the H2 ortho-to-para ratio is low (Dalgarno & Lepp 1984; Pagani et al. 1992). Then, N2H+ and N2D+ are formed from N2 , a late-type molecule that can take about ten times longer than CO to form (cf. Hily-Blant et al. 2010, and references therein). These species are predominantly formed and destroyed via gas-phase reactions. They have two main destruction routes: dissociative recombination with free electrons or reactions with carbon monoxide (e.g. Loison et al. 2019; Redaelli et al. 2020; Öberg & Bergin 2021, and references therein).
However, even though N2D+ is an abundant ion in cold and dense gas, it has been recently established that it is affected by depletion at high densities (i.e. n(H2)≳ 105 cm−3 ; Redaelli et al. 2019). Therefore, it is not an ideal tracer of the prestel- lar stages. In addition, based on the anti-correlated distribution between o-H2D+ and N2D+ reported by Giannetti et al. (2019), it was recently shown that relative to o-H2D+, which forms very early on and thus exclusively traces cold, prestellar gas, the (3– 2) transition of N2D+ (with a critical density, ncr > 105.5 cm−3; see Li et al. 2022) appears at relatively later stages of the starformation process surviving up to the early phase of protostellar activity.
Attempts to confirm this anti-correlation was pursued by Miettinen (2020), using Atacama Pathfinder Experiment (APEX) observations in three prestellar and three protostel- lar cores in the Orion-B9 filament. This work confirmed the downward trend for o-H2D+ with evolution, while reporting a large spread with an unclear behaviour for N2D+ . However, the authors justified this result with a spatial offset between the two tracers.
High-resolution interferometric observations (Kong et al. 2016) have shown that cores in evolved stages have higher N2D+ abundances compared to o-H2D+, confirming the fact that N2D+ is forming at later stages and under different physical conditions. Similar results were also reported in Li et al. (2022), who find a detection rate of N2D+ in protostellar environment higher than the one obtained in prestellar cores. Redaelli et al. (2022) reported well-correlated column densities for the two tracers by identifying cores in o-H2D+ in the 70 µm dark clump G014.492-00.139 (e.g. Sanhueza et al. 2019; Morii et al. 2023; Izumi et al. 2024). However, this result is not in contradiction with Giannetti et al. (2019), who analysed cores identified in sub-millimeter/far-infrared (sub-mm/FIR) wavelength continuum emission. This might indeed be insufficient if we are trying to distinguish between pre- and proto-stellar stages and can lead to unreliable results in the identification of prestellar phases; therefore, this may also be an obstacle when assessing the evolutionary behaviour of chemical clocks (Redaelli et al. 2021). Finally, when comparing single dish and interferometric results, we have to consider that the prior look at the average properties of the clumps, which smears out the chemical response to physical changes occurring at the smaller scales mapped by high-resolution observations (see Sabatini et al. 2022).
In this work, we report a comprehensive study of these molecules in HMSFRs, with the aim to further explore the chemical connection between deuterated species in a larger sample of independent clumps at distinct evolutionary stages. The paper is organised as follows: In Sect. 2, we describe the observational sample, Sects. 3 and 4, are focused on the data reduction and the data analysis, respectively. In Sect. 5, we discuss the result within the context of HMSFRs and make a comparison with previous works.
2 The sample
The APEX Telescope Large Area Survey of the Galaxy (ATLASGAL1; Schuller et al. 2009) provides a solid basis for a complete characterisation of a large number of massive star forming clumps in all their evolutionary phases (e.g. Molinari et al. 2008). The ATLASGAL Compact Source Catalog contains about 104 clumps identified in their 870 µm continuum emission (e.g. Contreras et al. 2013, Urquhart et al. 2014a). Together with follow-up spectral line observations, it provides reliable estimates of kinematic distances and location in the Galactic plane, total masses, bolometric luminosities, dust temperature, and age distributions (Urquhart et al. 2014b, 2018; Wienen et al. 2015, and Sabatini et al. 2021).
2.1 The Top100 sample
In the ATLASGAL framework, the TOP100-sample (hereafter, TOP100; see Giannetti et al. 2014) has been defined as a fluxlimited sample of 111 dense/massive clumps, selected with additional infrared (IR) criteria to include sources potentially covering the whole spectrum of ages (see König et al. 2017). Using the APEX-12 m, Mopra-22 m and the IRAM-30 m singledish telescopes, a comprehensive spectral survey, covering more than 120 GHz of bandwidth2, was performed in the frequency range from 80 to 345 GHz for all the TOP100 sources. This survey includes three spectral windows and contains a variety of molecular lines, including COMs. The gas excitation parameters and molecular column densities were derived by carefully analysing a subset of chemical species (i.e., C17O, C18O, 13CO, 13C18O, Giannetti et al. 2014; SiO and 29SiO, Csengeri et al. 2016; CH3CN, CH3CCH, and CH3OH, Giannetti et al. 2017; ortho- and para-H2CO, Tang et al. 2018). From this survey, Giannetti et al. (2017) showed a correlation of several quantities (temperature, column densities of different chemical tracers, and H2 volume density) with the evolutionary class and the luminosity-to-mass ratio (L/M; a robust evolutionary indicator of the star formation processes, e.g. Saraceno et al. 1996; Molinari et al. 2008), highlighting a pattern from the initial contraction phase of the clumpy material to the gradual accretion onto nascent young stellar objects (YSOs). Consequently, the evolutionary sequence outlined in the TOP100 holds statistical significance and, within this context, this sample offers an unbiased and comprehensive subset of massive clumps that reproduce the properties of the entire clump population in ATLASGAL.
2.2 Sub-sample selection
We select a sub-sample of the TOP100 by excluding the 22 HII regions, as they are associated with the lower abundances of deuterated molecules (e.g. Fontani et al. 2011; Urquhart et al. 2019; Sabatini et al. 2020). For the remaining sources, we add a second selection criterion that considers only the sources with a heliocentric distance <4 kpc to mitigate beam-dilution effects. This leads to a final sub-sample of 40 massive starforming clumps (see Appendix A). We note that the range of observed and inferred physical properties in this sub-sample in terms of total clump mass, bolometric luminosity, column and volume density, and temperature are consistent with the average properties of the different evolutionary classes defined in ATLASGAL and recently updated by Urquhart et al. (2022). The classification was based on a careful analysis of the available multi-wavelength data of the GLIMPSE and MIPSGAL surveys (3–24 µm; Churchwell et al. 2009 and Carey et al. 2009), complemented by the additional information of the 70 µm maps and the HiGAL catalogue (Molinari et al. 2010; Elia et al. 2021).
In most cases, the resulting classification is similar to that originally presented by König et al. (2017), and comprises four evolutionary stages: (1) quiescent: constituted by sources clear of any large-scale extended 70 µm emission, devoid of embedded objects and therefore cold (Tdust~10–15 K) clumps with L/M ≲ 1.5. This stage is associated with the earliest phase of massive star formation and mainly comprises starless or prestel- lar cores. Around 13% of the sources in our sample (five in total) belong to this class; (2) protostellar: composed of warmer clumps where at least one compact source is detected at 70 µm (but still undetected at 24 µm), within 12″ of the centre of the clump, and associated with young clumps likely dominated by cold gas with 1.5 ≲ L/M ≲ 5. Eight sources are classified as pro- tostellar in our sample; (3) YSOs: as a result of the progressive heating of the dust driven by the forming (proto-)stars, this stage includes clumps showing stronger emission in the mid-infrared at 3-8 and 24 µm, and 5 ≲ L/M ≲ 15. In this study, 18 sources are associated with this evolutionary stage; (4) HII regions: this is the most evolved stage of the sequence, consisting of clumps in which massive stars have formed almost entirely. These clumps are bright at 3–70 µm, with clear detection at 5 GHz. On average, the L/M of the sources associated with this class is ≳15. As mentioned above, none of the sources in our sample were associated with this evolutionary phase. An additional fifth category labelled “ambiguous”, is used to classify sources that are not included in the above groups. This category does not correspond to a specific evolutionary stage and is primarily composed of complexes in which several sub-regions at different evolutionary stages are close to each other or of clusters associated with photon-dominated regions (PDR) at the edge of evolved HII regions. Our final sample includes nine sources in this category.
All the evolutionary parameters evolve consistently with the original classification and show only very minor deviations compared to Giannetti et al. (2017). These parameters are shown in Table A.1. During the transition from the quiescent phase to the advanced evolutionary phases associated with the presence of a YSO, average dust temperature, and H2 column density increase from 16 to 23 K and from ~5.0×10²² to ~1.2×1023 cm−2, while the total mass and luminosity of the clumps increase from ~102 to ~2.0×10³ M⊙ and from ~102 to ~4.6×10⁴ L⊙, respectively, resulting in an increase of the average L/M from 3 to 33.
3 Observations and data reduction
In this work, we investigate how the abundances of multiple molecular tracers (i.e. N2D+, N2H+ and o-H2D+) vary across the different evolutionary stages of ATLASGAL clumps. The APEX datasets employed in this analysis are described in the following subsections.
3.1 N2D+ (deuterated diazenylium)
We observed the N2D+ (3–2) spectra with the nFLASH dualfrequency MPIfR-PI receiver, an evolved version of the original First Light APEX Submillimeter Heterodyne receiver (FLASH, Klein et al. 2014) mounted on the APEX telescope (Güsten et al. 2006), in the on-off (ONOFF) observing mode, assuming a rest frequency of 231.32167 GHz (Amano et al. 2005, see Table 1). The receiver allows simultaneous observations of two 4 GHz sidebands recorded by two fast Fourier transform spectrometer (FFTS) processor units that overlap in the middle by about 100 MHz, providing a full coverage of 7.9 GHz. The observations were performed from December 2020 to July 2021 in two projects (IDs: C-0105.F-9715C-2020 and C-0107.F-9711-2021; PIs: S. Bovino and G. Sabatini, respectively), with a native spectral resolution of 0.078 km s−1.
The final mean system temperatures, Tsys, ranged between ~ 120 and 250 K, depending on the weather conditions. All observations were made with a precipitable water vapour <2.0 mm. At ~231 GHz, the APEX telescope has an effective FWHM beam size of 26″.2, with a corresponding main-beam efficiency of ~0.73. The main-beam efficiency was applied to the spectra after setting the reference frequency to that of N2D+ (3−2). We subtracted a first-order polynomial baseline from each spectrum around the masked line. In some rare cases where a first-order baseline was not sufficient, a second- (or third-) order baseline was used. Finally, all the spectra of each source were averaged to obtain one spectrum per source. The spectral resolution, δν, was smoothed to 0.5 km s−1 to improve the signal-to-noise ratio (S/N). Observations were reduced using a GILDAS/CLASS4 Python interface pipeline.
Observations and molecular properties.
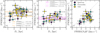 |
Fig. 1 Heliocentric distance versus the FWHM of (a) N2H+ and (b) N2D+. Orange and magenta lines represent the median FWHM values of N2H+ and N2H+, respectively, within the quiescent (solid), the protostellar (dotted) and the YSO (dashed) groups. Panel (c) compares the FWHMs of the two molecular tracers, with colours indicating the different evolutionary stages (dark blue: quiescent; green: protostellar; yellow: YSO). The uncertainties are shown as black bars. |
3.2 Additional tracers: N2H+ (diazenylium) and o-H2D+ (deuterated trihydrogen cation)
The o-H2D+ JKa,Kc = 110−111 spectra (νrest ~372.42139 GHz; Amano & Hirao 2005) are part of three APEX projects (IDs: 0101.F-9517; M-097.F-0039-2016 and M-098.F-0013-2016; PI: F. Wyrowski), observed from July 2017 to December 2018. These data were published in Sabatini et al. (2020) and we refer to this work for a complete description of the observations and data reduction.
From the same APEX projects, we have collected further observations of N2H+(4–3) at a rest frequency of ~372.67251 GHz (Amano et al. 2005), which we employed to estimate the deuteration fraction (see Sect. 4). The N2H+(4-3) data are available for the whole sample observed in N2D+ (3−2), with a native spectral resolution of 0.038 km s−1. The final mean Tsys lies between ~600 and 1200 (Sabatini et al. 2020). At ~372 GHz, the APEX telescope has an effective FWHM beam size of ~17″.5, with a corresponding main beam efficiency of ~0.735. The observations were reduced using GILDAS/CLASS. All the molecular and spectral parameters are summarised in Table 1.
4 Analysis and results
Figure A.1 presents the observed spectra of N2D+ and N2H+, while the spectra of o-H2D+ are published in Sabatini et al. (2020). The N2H+ (4-3) line is detected with S/N>3 in the whole sample (i.e. detection rate of 100% over all evolutionary stages defined in ATLASGAL; see Table 1). Conversely, the detection rate of N2D+, similar to o-H2D+, decreases with the evolution of the clump (e.g. Miettinen 2020; Sabatini et al. 2020), passing from 100%±22% in quiescent sources to 88%±18% and 67%±12% in protostellar and YSO stages, respectively, while slightly more than half of the PDRs (56%±17%) show N2D+ detection. The uncertainties in the detection rates are calculated using binomial statistics.
4.1 Spectral fitting
To infer the spectral line parameters of o-H2D+ , N2D+ , and N2H+, we employed MCWeeds (Giannetti et al. 2017): a flexible interface between PyMC (Patil et al. 2010), a Python library for building Bayesian statistical models, and Weeds (Maret et al. 2011), an extension of the CLASS software6 designed for modelling observed spectra under the assumption of local thermodynamic equilibrium (LTE). We used a fitting algorithm based on Markov chain Monte Carlo (MCMC) techniques to sample the parameter space with non-informative flat priors over the free parameters of the models, i.e. the line central velocity (V1sr) and linewidth (FWHM), the molecular column density (NLTE), the excitation temperature (Tex), and the source size (θsrc). For all tracers, we have assumed extended emission with respect to the APEX beam, as their emission scales are usually comparable to the typical clump sizes (e.g. Pillai et al. 2012; Feng et al. 2016; Redaelli et al. 2022; Sabatini et al. 2023). The APEX beam sizes at all the frequencies here analysed are smaller than the apparent diameters of the clump as measured by the ATLASGAL survey. However, our observations could be affected by beam dilution at different levels for the distinct tracers and/or evolutionary stages. This is likely not the case for N2H+, as its emission is usually found spread across the whole clump when maps are available (see, for instance Feng et al. 2016; Redaelli et al. 2022), whilst the problem might be more severe for the rarer deuterated species. Redaelli et al. (2021, 2022) reported extended o-H2D+ emission even in clumps with embedded protostars, suggesting that in the high-density environments typical of high-mass clumps, this molecule is abundant. Concerning N2D+, Redaelli et al. (2022) and Sakai et al. (2022) reported widespread, resolved emission and strong line emission even in evolved sources, respectively. However, we cannot exclude the possibility that the beam-filling factor is ηff < 1. We stress that we cannot quantify ηff solely on the basis of the data we have at hand, as this would require access to resolved maps of molecular emission. If ηff < 1, the column densities (and abundances) of N2D+ and o-H2D+ could be underestimated. However, due to the chemical link between them that we further discuss in Sect. 5, we can expect a similar extension for the two species, and even in the case of ηff < 1, a comparable underestimation of the final column densities.
In quiescent sources, the N2H+ lines are detected as a single Gaussian-like component with an average FWHM of ≈2.5 km s−1 (see Table A.2 and Fig. 1a). As the sources evolve, the N2H+ lines become broader (FWHM>3.6 km s−1) and may exhibit multiple velocity components (e.g. 351.45+0.66, G317.87-0.15 and G353.41-0.36). Conversely, the spectra of N2D+ are well fitted by a single velocity component with smaller FWHMs throughout the whole evolutionary sequence (the only exception is the PDR G353.41-0.36). The FWHMs of N2D+ lines display less variation across evolutionary stages than N2H+ lines (see Fig. 1b). Neither the FWHMs of N2H+ nor N2D+ show a significant correlation with the heliocentric distance (D⊙; see Table A.2) of the sources at the different stages (Figs. 1a,b), ruling out any distance-related bias in the FWHMs. Instead, the different behaviour found in the class-averaged FWHMs suggest that N2H+ and N2D+ probe different regions within the same clumps. N2H+ likely traces larger-scale, more turbulent structures (e.g. Emprechtinger et al. 2009; Miettinen et al. 2011; Redaelli et al. 2022), while the formation of N2D+ is favoured in the denser, colder cores embedded in these structures (e.g. Öberg & Bergin 2021). The narrower N2D+ lines reflect this origin (see Fig. 1c).
4.2 Column densities and deuteration fraction
4.2.1 LTE analysis
The molecular column densities were determined with MCWeeds. The best-fit results are shown in Table A.2 and were derived assuming an excitation temperature Tex = Tdust (e.g. Giannetti et al. 2019; Sabatini et al. 2020). Although the gas-dust thermal coupling condition is virtually always valid under the typical conditions prevalent in high-mass clumps (i.e. when n(H2)> 104.5 cm−3; Goldsmith 2001), the H2 volume densities we derive for each clump (assuming a constant H2 distribution and using the clump size) are slightly below the critical densities of the molecular tracers. These derived densities, which represent lower limits, are presented in Table A.2, and the critical densities are listed in Table 1. However, we also found that varying the assumed temperature by 40% affects the column densities within the uncertainties given in Table A.2, so that this assumption has only a minor impact on the final results (see also Caselli et al. 2008 and Sabatini et al. 2020). Furthermore, the assumed Tdust values are broadly consistent with gas temperature estimates derived from common tracers like CO and CH3OH at the clump scale for the TOP100 sample (Giannetti et al. 2017). We also identified and corrected a typo in the version of MCWeeds used in Sabatini et al. (2020), which led to an overestimation of NLTE (o- H2D+) by a factor of  (Redaelli et al. 2022). The corrected column densities range from (0.8±0.5 to 5.0±1.2)×1012 cm−2 for o-H2D+, (0.6±0.1 to 36±5)×1012 cm−2 for N2H+, and (0.5±0.3 to 8.0±0.9)×1011 cm−2 for N2D+ (see Table A.2). These values are consistent with typical abundances relative to H2 reported in similar environments (e.g. Miettinen 2020; Sabatini et al. 2020; Li et al. 2022), and are lower than those found by Crapsi et al. (2005) in nearby low-mass star-forming regions observed with the IRAM-30m telescope; this is likely due to beam dilution from the larger APEX beam (see also Redaelli et al. 2022 for further discussions on G014.492-00.139). The new NLTE(o-H2D+) values vary by 25–50% compared to Sabatini et al. (2020) due to the different temperatures assumed (Urquhart et al. 2022, see Table A.1) and the correction introduced in MCWeeds.
4.2.2 Uncertainties due to line opacity and non-LTE conditions
In this section, we discuss the uncertainties on the NLTE (determined in Sect. 4.2.1) that are due to the assumption of optically thin lines and of LTE-conditions. Both assumptions can lead to an underestimation of the true column densities.
Concerning line opacities, Sabatini et al. (2020) report optically thin emission for all o-H2D+ detections. We verified this assumption with the RADEX code (van der Tak et al. 2007) to test the reliability of the MCWeeds results. As with the column density calculations, we assumed ηff = 1 when deriving the line opacities. We used the column densities and FWHM values obtained from MCWeeds and a constant kinetic temperature, Tkin, equal to Tdust as input for RADEX. We also assumed that the emission of the different tracers comes from the denser regions of the clump, and for this we set the H2 volume density, n(H2), well above the ncr of the individual tracers. We found optical depths, τ < 0.05, implying optically thin regimes for all the considered lines.
To test the LTE-assumption, we also performed a grid of non-LTE (NLTE) RADEX models, assuming the FWHM derived with MCWeeds and Tkin = Tdust as input to reproduce the observed lines, leaving the column density and line opacity (NNLTE and τNLTE) as free parameters. The collisional rates of N2H+, o-H2D+ and N2D+ are taken from Balanca et al. (2020), Hugo et al. (2009) and Lin et al. (2020), respectively. In NLTE analysis, a significant source of uncertainty arises from the assumption of a reliable value of n(H2) to reproduce the average environmental properties. This uncertainty is due to the non-uniform gas distribution within the clumps, as different molecular tracers may be associated with distinct regions characterised by different (and variable) densities. To account for this, we considered a range of n(H2) values (see Table A.2). The lower limit of this range was derived from N (H2), assuming a uniform distribution of H2 within each clump and using the effective radius of the clump, Reff, which provides a lower limit to the actual density. For the upper limit, we considered a typical uncertainty of a factor of 5 on Reff (Urquhart et al. 2018, 2022).
Table A.2 summarises the ranges of assumed n(H2), and of the NNLTE and τNLTE obtained with the RADEX code in the NLTE case. The NNLTE derived for the o-H2D+ line shows the smallest deviation from the LTE results. RADEX models at the lower n(H2) yield NNLTE that are 1.2 to 1.6 times higher than NLTE . This minor discrepancy is consistent with the fact that the gas density of the clumps is in almost all cases larger than the line ncr (see Table 1). The τNLTE are low (<0.06) and the estimated Tex range from 8.6 to 15.5 K, in agreement with the Tkin adopted in the LTE case, supporting for o-H2D+ (110−111) the LTE assumption made in Sect. 4.2.1. We emphasise that the difference between NNLTE and NLTE is even less pronounced at the higher n(H2), where NNLTE turns out to be 25% higher than NLTE at most. A similar result is found for N2D+, for which the estimated Tex range from 5.0 to 18.8 K. The NNLTE overestimates NLTE by factors of 1.3–5 at low n(H2) and by a factor of 1 to 1.6 at high n(H2). The N2D+ emission proves to be optically thin over the entire density range explored (τNLTE < 0.16).
Due to its higher ncr, the NNLTE derived from N2H+ (4–3) shows the most significant deviations from LTE. At the lowest n(H2), the NNLTE differ from the LTE results by factors ranging from 5 to 32. This discrepancy is often associated with optically thick emission (0.2 ≲ τNLTE ≲ 11). At higher densities, the NNLTE/NLTE is reduced to a factor of 1 to 6, and the emission becomes mostly optically thin (0.1 ≲ τNLTE ≲ 2). The associated Tex range from 5.5 to 15.6 K and, as observed for the other transitions, tend to increase with the evolutionary stage of clumps.
It is worth stressing that a NLTE analysis introduces additional uncertainties beyond those of an LTE approach. While both methods require knowledge of the gas temperature, the NLTE analyses also crucially depend on the assumed gas density (see Table A.2). This emphasises the larger uncertainty associated with NLTE results, especially when derived based on a single molecular transition. Despite the fact that the column density of N2H+ may be up to a factor of ~30 higher in the NLTE case, we anticipate here that the evolutionary trends of the abundances and abundance ratios given in the following sections are not affected by the choice of analysis. In the following, we show the results obtained with the LTE-analysis and discuss the differences with the NLTE case that are relevant for our conclusions.
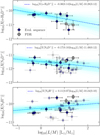 |
Fig. 2 Correlations between L/M and the abundances of o-H2D+, N2D+, and N2H+ obtained with the LTE analysis. Blue dots refer to sources associated with the evolutionary sequence defined in Sect. 2.2, whilst grey dots are associated with PDRs. Shaded dots refer to sources in which o-H2D+ is not detected. The blue dashed lines show the result of a linear least-squares fit to the data, while the cyan shaded areas show the 3σ uncertainties on the best-fit parameters (errors in parenthesis). |
4.2.3 Observed evolutionary trends
Figure 2 shows how the LTE-abundances of o-H2D+, N2D+, and N2H+ vary across the different evolutionary stages, identified by the L/M ratio. A linear least-squares fit to the data is shown in each panel as a blue dashed line. Remarkably, X(o- H2D+) decreases by ~1 orders of magnitude with increasing L/M, proving further evidence that o-H2D+ is sensitive to the evolutionary stage of massive star formation. The abundance of N2D+ shows a similar downward trend over the same L/M range, which is consistent with the results obtained by Fontani et al. (2011) in similar environments. Finally, X(N2H+) gradually increases with increasing L/M, suggesting that the formation of N2H+ is favoured at later stages, possibly correlating with the higher densities and temperatures associated with increased L/M (see Sect. 5). Finally, we note that the trends observed for X(o- H2D+) and X(N2H+) are also confirmed when considering the variation of N(o-H2D+) and N(N2H+) with L/M, while N(N2D+) remains flat with increasing L/M.
As a consequence of the above trends, it was also found that the deuteration fraction derived from diazenylium considering the N2D+(3-2) and N2H+(4–3) rotational transitions, namely, RD = N(N2D+)/N(N2H+), varies as a function of the different evolutionary classes. This is consistent with previous studies (e.g. Chen et al. 2011; Fontani et al. 2011), where RD increases with decreasing temperature and increasing gas density. Figure 3a compares NLTE(N2H+) with NLTE(N2D+) across the different evolutionary stages. We note a significant difference in the median deuteration fraction for the different evolutionary stages of massive star-forming clumps. The quiescent stage shows the highest median  , the protostel- lar stage exhibits intermediate values (=0.025±0.006), while the YSO stage displays the lowest
  . In the latter case, the RD is, on average, an order of magnitude lower than for quiescent sources. To confirm the statistical significance of the observed separation between the evolutionary classes, we applied the Anderson-Darling (AD; e.g. Scholz & Stephens 1987) test to the distribution of RD . We found a statistically significant difference in the RD distribution between quiescent and protostellar stages and between the protostellar and YSO, with a low probability (𝒫<0.02) that the two samples originate from the same population. This separation is even more significant when considering the quiescent and YSO classes (𝒫~0.001), indicating a clear chemical diversity and evolution across these stages. A similar, albeit less pronounced trend is observed for the median
  derived from the NLTE analysis (see Fig. 3b).
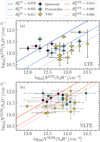 |
Fig. 3 Column densities of N2D+ compared to those of N2H+ and obtained under (a) LTE and (b) NLTE conditions. The different colours of markers refer to the evolutionary stages of clumps, as in Fig. 1. Lines show the median values of the deuteration fraction for the quiescent group (solid line; |


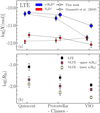 |
Fig. 4 Summary of the observed evolutionary trends. Panel a: Abundances of o-H2D+ (blue symbols) and N2D+ (red symbols) as a function of the evolutionary class defined in Sect. 2.2. Circles and diamonds refer to results from this work and Giannetti et al. (2019), respectively. Panel b: median RD factors derived for each evolutionary class defined in our sample. Different colours refer to values obtained from LTE and NLTE analysis discussed in Sects. 4.2.1 and 4.2.2. |
5 Discussion
Figure 4a shows the variation of the average abundances of o-H2D+ and N2D+ resulting from the LTE analysis, as a function of the evolutionary class (see Sect. 2.2). When considering the o- H2D+ (blue markers), our results are in agreement with Sabatini et al. (2020), and confirm a decreasing trend in X(o-H2D+) as clumps evolution progresses. However, the new classification and temperatures assumed to derive NLTE(o-H2D+) lead to a small variation in the median X(o-H2D+) ratios among the different stages. The quiescent-to-protostellar ratio decreases from ~2.0 in Sabatini et al. (2020) to ~1.3 in Fig. 4a. Conversely, the protostellar-to-YSO ratio increases from ~4.0 to ~4.3. The overall downward trend of X(o-H2D+) with evolution remains unchanged, confirming that the new classification has only a minor impact on the final results. The ratio between the median values of X(o-H2D+) in quiescent and YSO sources is also comparable to previous results (a factor of ~6 in Fig. 4a compared to ~8 in Sabatini et al. 2020). This difference is consistent with the estimated uncertainties and with the results by Giannetti et al. (2019), i.e. blue diamonds in Fig. 4a.
The red markers in Fig. 4a show the trend of X(N2D+) as a function of evolutionary classes. In contrast to Giannetti et al. (2019), our findings reveal a slight decrease in X(N2D+) with progressing star formation, with a difference of a factor of ~2.9 between the quiescent and YSO stages. However, it is important to note several caveats regarding this comparison: (1) Although the physical properties of the clumps and the observational setup (e.g. telescope, spectral setup, sensitivity) in Giannetti et al. (2019) are similar to those adopted here, the former sample is small (three clumps) and not statistically representative, as all three clumps belong to the same filamentary IRDC, G351.77- 0.51 (e.g. Sabatini et al. 2019). (2) One of the three sources in Giannetti et al. (2019) presents only an upper limit for X(N2D+), making it is difficult to assess evolutionary trends. The anticorrelation between the abundances of o-H2D+ and N2D+ – and, consequently, the reliability in using the X(o-H2D+) /X(N2D+) ratio as an evolutionary indicator of high-mass star-forming clumps – are not confirmed in our sample.
To interpret the results presented in Fig. 4a, we consider both chemical evolution and beam dilution effects that may affect our observational results. During the early quiescent phase, o- H2D+ is expected to be more abundant than N2D+ , as the former is the initial product of deuterium fractionation (e.g. Dalgarno & Lepp 1984; Caselli & Ceccarelli 2012; Ceccarelli et al. 2014), while the formation of N2D+ is limited by the presence of H2D+ and N2 (e.g. Öberg & Bergin 2021). The formation of both H2D+ and N2D+ is significantly influenced by the abundance of CO in the gas phase, which is strongly depleted in our quiescent sample with an average CO depletion factor ( fD)7 of 6 (Sabatini et al. 2020). As the evolution progresses (protostellar stage), the o-H2D+ can transform into its multiply deuterated isotopologues (D2H+ and D3+), possibly contributing to the observed slight decrease in X(o-H2D+) . At this stage, the average CO depletion factor remains similar to that of quiescent sources (see Giannetti et al. 2014) and any effect of heating on the chemistry is still negligible on the clump scales, as it occurs on very small scales as shown by Sabatini et al. (2022). The decrease in X(o-H2D+) would consequently also affect X(N2D+) , as the chemistry of N2D+ is strongly connected with that of H2D+ . Furthermore, N2 depletion could further reduce the N2D+ abundance (e.g. Redaelli et al. 2019; Sipilä et al. 2019). During the YSO phase, the temperature increase leads to CO desorption from the dust grains, resulting in the destruction of both o-H2D+ and N2D+ near the YSO. In addition, a higher ortho- to-para-H2 ratio suppresses deuterium fractionation (e.g. Hugo et al. 2009). These factors lead to a significant reduction of the o-H2D+ abundance. Although N2D+ may also be affected, its overall decrease is less pronounced, probably because its emission arises not only from the neighbourhood of the YSO, but also from the outer envelope, where o-H2D+ continues to transform into heavier isotopologues, as modelled by Sipilä et al. (2016). We find that with time, X(N2D+) evolves similarly to X(o-H2D+) but also that the former appears to be less sensitive to density and temperature variations that typically affect deuterated species during star formation, at least on the clump scale. The NLTE analysis discussed in Sect. 4.2.2 further supports this scenario and shows that, among the analysed tracers, the column density of o-H2D+ is the least sensitive to the assumed gas density. This is in line with the results of Miettinen (2020), who also found that it is difficult to detect a clear trend in X(N2D+), suggesting that this molecule is not ideal to follow the star formation process and may also lead to misleading results when used as a proxy for the identification of prestellar cores.
The only other evolutionary indicator we find is the RD determined from N2H+ and N2D+ (see Fig. 3). Regardless of the method used to derive the column density of each tracers, we observe that RD decreases by almost one order of magnitude between quiescent and YSO stages (see Fig. 4b). This trend is similar to what was found for X(o-H2D+) , and suggests that the physical conditions regulating the formation and destruction of deutereted molecules evolve consistently during the low- and high-mass star formation (see Chen et al. 2011; Fontani et al. 2011). However, caution is also required when comparing the observed chemical properties in low- and high-mass starforming regions, especially due to beam dilution effects. Sabatini et al. (2022) show that validity of typical evolutionary indicators, such as fD , can vary significantly depending on the spatial scale considered. Based on the pilot sample of the ALMA Survey of 70 µm Dark High-mass Clumps in Early Stages (ASHES; e.g. Sanhueza et al. 2019; Li et al. 2023), Sabatini et al. (2022) found that while fD decreases significantly on a large scale with increasing L/M of the clumps, the population of protostellar cores embedded in the ASHES clumps display fD that are, on average, higher than in prestellar cores. This is due to the fact that the CO-depletion process in the cold outer envelopes of the cores is still efficient even when a young stellar object has already formed. The same effect appears to be less pronounced in the low-mass star-forming regions, as the high-density envelopes are less extended, and more affected by the temperature fluctuations caused by the star formation activity. This affects also deuterium fractionation, which is only efficient in an environment strongly depleted of neutrals, and in particular CO. At the same time, the calculation of RD assumes that both N2H+ and N2D+ are co-spatially distributed along the line of sight. However, interferometric observations reveal that N2D+ typically traces more compact regions than N2H+ , especially in high-mass star formation, not always coinciding with the cores identified via o-H2D+ (e.g. Redaelli et al. 2022). We find that this effect is more pronounced in evolved clumps, as shown by the consistently broader N2H+ line profiles compared to N2D+ (Fig. 1). Thus, while the mean RD can serve as a reliable evolutionary indicator on clump scales, it may not accurately reflect the actual deuteration fraction of cores. This is especially important for the identification of prestellar cores in HMSFRs, as RD is often used as an indicator for these cold, dense, prestellar environments.
6 Conclusions
To assess the validity of the X(o-H2D+) /X(N2D+) ratio as an evolutionary indicator for the high-mass star formation process, we conducted APEX observations of N2H+ (4–3) and N2D+ (3–2) in a sample of 40 massive clumps at different evolutionary stages selected from the ATLASGAL survey (Schuller et al. 2009; Urquhart et al. 2022). The results for N2H+ and N2D+ were compared with the o-H2D+ (110–111) detections reported by Sabatini et al. (2020). We found emission of N2H+ in all observed clumps, while N2D+ was detected in 29 out of 40 sources, with decreasing detection rates with clump evolution, similar to o-H2D+ . Quantitatively, the detection rate of N2D+ decreases from 100% to 67%, while that of o-H2D+ ranges from 80% to 10%, from the quiescent to the YSO stages, respectively (Table 1).
As the clumps evolve, the N2H+ lines become broader, passing from typical FWHMs of ~2.5 km s−1 in quiescent clumps to ~3.6 km s−1 in YSO and exhibit multiple velocity components tracing larger, more turbulent structures in more evolved sources. Conversely, the N2D+ lines are on average narrower than N2H+ lines, with FWHMs in the ~1.8–2.3 km s−1 range, which suggest that they are associated with the denser and cooler cores into the clumps along the whole evolutionary sequence.
The abundances of o-H2D+ and N2D+ decrease from (5.3±1.2)×10−11 to (1±0.3)×10−11 and from (2.8±0.9)×10−12 to (0.8±0.3)×10−12, respectively, following the clumps’ evolution, which is consistent with previous findings (e.g., Chen et al. 2011; Fontani et al. 2011; Sabatini et al. 2020, see Fig. 4a). The validity of the X(o-H2D+) /X(N2D+) as an evolutionary indicator is not confirmed in our sample. However, X(o-H2D+) shows a much stronger decrease (a factor of ~6) over the different evolutionary stages than the N2D+ abundance (a factor of ~3). At the same time, when considering the column densities of the different tracers, this trend is confirmed only in the case of o-H2D+, while N(N2D+) shows flat values with increasing L/M of clumps.
The deuteration fraction resulting from N2H+ and N2D+ is also confirmed as a potential evolutionary indicator in massive star-forming clumps, as it decreases by almost an order of magnitude between quiescent and YSO stages. However, due to beam dilution effects that affect the individual observation, the interpretation of the latter indicator is more complex as the emission of N2D+ typically maps more compact regions than N2H+ (e.g. Miettinen et al. 2011; Redaelli et al. 2022).
In conclusion, our study confirms the potential of o-H2D+ and RD as tracers of the different evolutionary stages in high- mass star formation process. High-resolution interferometric observations are now crucial to accurately calibrate these indicators by resolving the denser cores harboured into massive clumps to mitigate beam dilution effects.
Acknowledgements
The authors thank the anonymous Referee for all the helpful suggestions that improved the manuscript, and Dr L. Podio for fruitful scientific discussions and feedback. This publication is based on data acquired with the Atacama Pathfinder Experiment (APEX) under programme IDs [0101.F-9517, M-097.F-0039-2016, M-098.F-0013-2016, C-0105.F-9715C-2020 and C-0107.F- 9711-2021]. APEX has been a collaboration between the Max-Planck-Institut fur Radioastronomie, the European Southern Observatory, and the Onsala Space Observatory. GS acknowledges the project PRIN-MUR 2020 MUR BEYOND- 2p (“Astrochemistry beyond the second period elements”, Prot. 2020AFB3FX), and the INAF-Minigrant 2023 TRIESTE (“TRacing the chemIcal hEritage of our originS: from proTostars to planEts”; PI: G. Sabatini). SB acknowledges BASAL Centro de Astrofisica y Tecnologias Afines (CATA), project number AFB-17002. This research has made use of the IRAM GILDAS software (http://www.iram.fr/IRAMFR/GILDAS), the Cologne Database for Molecular Spectroscopy (CDMS), the NASA’s Astrophysics Data System Bibliographic Services (ADS), Astropy (Astropy Collaboration 2013, 2018; see also http://www.astropy.org) and Matplotlib (Hunter 2007).
Appendix A Physical and chemical properties of the clumps
Table A.1 presents a comparison between the main physical properties and evolutionary classifications of clumps with o- H2D+ detection. The left columns display values from König et al. (2017) as adopted by Sabatini et al. (2020), while the right columns show the recently updated values from Urquhart et al. (2022). For ease of comparison, we have assigned numerical identifiers to the different evolutionary stages. Uncertainties associated with the NLTE (o-H2D+) estimates are derived from the fiducial fit provided by MCWeeds.
Table A.2 summarises the physical properties of all the clumps considered in this work, and the spectral properties and column densities of o-H2D+, N2H+ and N2D+ derived with MCWeeds (NLTE) and RADEX (NNLTE). Finally, the observed spectra of N2D+ and N2H+ are shown in Fig. A.1 and discussed in Sect. 4, while we refer to Sabatini et al. (2020) for a comprehensive description of the o-H2D+ APEX data.
Comparison between the physical properties presented in Sabatini et al. (2020) and those in Urquhart et al. (2022).
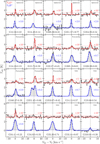 |
Fig. A.1 Spectral overview of the N2D+ (top) and N2H+ (bottom) lines observed in the entire sample. In each panel, the source name and evolutionary stage are shown in the lower centre and upper right corners, respectively. The MCWeeds models are shown in red for N2D+ and in blue for N2H+. The dotted lines represent the 3σ noise levels. The vertical dashed lines indicate the Vlsr of the sources (see Table A.2). Spectra have been multiplied by an arbitrary factor, shown in each panel. |
References
- Amano, T., & Hirao, T. 2005, JMoSp, 233, 7 [Google Scholar]
- Amano, T., Hirao, T., & Takano, J. 2005, JMoSp, 234, 170 [Google Scholar]
- Astropy Collaboration (Robitaille, T. P., et al.) 2013, A&A, 558, A33 [NASA ADS] [CrossRef] [EDP Sciences] [Google Scholar]
- Astropy Collaboration (Price-Whelan, A. M., et al.) 2018, AJ, 156, 123 [Google Scholar]
- Balanca, C., Scribano, Y., Loreau, J., Lique, F., & Feautrier, N. 2020, MNRAS, 495, 2524 [Google Scholar]
- Bergin, E. A., & Tafalla, M. 2007, ARA&A, 45, 339 [Google Scholar]
- Beuther, H., Zhang, Q., Bergin, E. A., & Sridharan, T. K. 2009, AJ, 137, 406 [Google Scholar]
- Bovino, S., Ferrada-Chamorro, S., Lupi, A., et al. 2019, ApJ, 887, 224 [NASA ADS] [CrossRef] [Google Scholar]
- Bovino, S., Lupi, A., Giannetti, A., et al. 2021, A&A, 654, A34 [NASA ADS] [CrossRef] [EDP Sciences] [Google Scholar]
- Carey, S. J., Noriega-Crespo, A., Mizuno, D. R., et al. 2009, PASP, 121, 76 [Google Scholar]
- Caselli, P., & Ceccarelli, C. 2012, A&A Rev., 20, 56 [NASA ADS] [CrossRef] [Google Scholar]
- Caselli, P., Walmsley, C. M., Tafalla, M., Dore, L., & Myers, P. C. 1999, ApJ, 523, L165 [Google Scholar]
- Caselli, P., Vastel, C., Ceccarelli, C., et al. 2008, A&A, 492, 703 [NASA ADS] [CrossRef] [EDP Sciences] [Google Scholar]
- Ceccarelli, C., Caselli, P., Bockelée-Morvan, D., et al. 2014, in Protostars and Planets VI, eds. H. Beuther, R. S. Klessen, C. P. Dullemond, & T. Henning, 859 [Google Scholar]
- Ceccarelli, C., Codella, C., Balucani, N., et al. 2023, in Astronomical Society of the Pacific Conference Series, 534, Protostars and Planets VII, eds. S. Inutsuka, Y. Aikawa, T. Muto, K. Tomida, & M. Tamura, 379 [NASA ADS] [Google Scholar]
- Chen, H.-R., Liu, S.-Y., Su, Y.-N., & Wang, M.-Y. 2011, ApJ, 743, 196 [Google Scholar]
- Churchwell, E., Babler, B. L., Meade, M. R., et al. 2009, PASP, 121, 213 [Google Scholar]
- Contreras, Y., Schuller, F., Urquhart, J. S., et al. 2013, A&A, 549, A45 [NASA ADS] [CrossRef] [EDP Sciences] [Google Scholar]
- Crapsi, A., Caselli, P., Walmsley, C. M., et al. 2005, ApJ, 619, 379 [Google Scholar]
- Csengeri, T., Leurini, S., Wyrowski, F., et al. 2016, A&A, 586, A149 [NASA ADS] [CrossRef] [EDP Sciences] [Google Scholar]
- Dalgarno, A., & Lepp, S. 1984, ApJ, 287, L47 [NASA ADS] [CrossRef] [Google Scholar]
- Elia, D., Merello, M., Molinari, S., et al. 2021, MNRAS, 504, 2742 [NASA ADS] [CrossRef] [Google Scholar]
- Emprechtinger, M., Caselli, P., Volgenau, N. H., Stutzki, J., & Wiedner, M. C. 2009, A&A, 493, 89 [NASA ADS] [CrossRef] [EDP Sciences] [Google Scholar]
- Feng, S., Beuther, H., Zhang, Q., et al. 2016, A&A, 592, A21 [NASA ADS] [CrossRef] [EDP Sciences] [Google Scholar]
- Fontani, F., Pascucci, I., Caselli, P., et al. 2007, A&A, 470, 639 [NASA ADS] [CrossRef] [EDP Sciences] [Google Scholar]
- Fontani, F., Palau, A., Caselli, P., et al. 2011, A&A, 529, L7 [NASA ADS] [CrossRef] [EDP Sciences] [Google Scholar]
- Giannetti, A., Leurini, S., Wyrowski, F., et al. 2017, A&A, 603, A33 [NASA ADS] [CrossRef] [EDP Sciences] [Google Scholar]
- Giannetti, A., Bovino, S., Caselli, P., et al. 2019, A&A, 621, L7 [NASA ADS] [CrossRef] [EDP Sciences] [Google Scholar]
- Giannetti, A., Wyrowski, F., Brand, J., et al. 2014, A&A, 570, A65 [NASA ADS] [CrossRef] [EDP Sciences] [Google Scholar]
- Goldsmith, P. F. 2001, ApJ, 557, 736 [Google Scholar]
- Güsten, R., Nyman, L. Å., Schilke, P., et al. 2006, A&A, 454, L13 [NASA ADS] [CrossRef] [EDP Sciences] [Google Scholar]
- Herbst, E., & van Dishoeck, E. F. 2009, ARA&A, 47, 427 [NASA ADS] [CrossRef] [Google Scholar]
- Hily-Blant, P., Walmsley, M., Pineau Des Forêts, G., & Flower, D. 2010, A&A, 513, A41 [NASA ADS] [CrossRef] [EDP Sciences] [Google Scholar]
- Hoq, S., Jackson, J. M., Foster, J. B., et al. 2013, ApJ, 777, 157 [Google Scholar]
- Hugo, E., Asvany, O., & Schlemmer, S. 2009, J. Chem. Phys., 130, 164302 [Google Scholar]
- Hunter, J. D. 2007, Comput. Sci. Eng., 9, 90 [NASA ADS] [CrossRef] [Google Scholar]
- Izumi, N., Sanhueza, P., Koch, P. M., et al. 2024, ApJ, 963, 163 [NASA ADS] [CrossRef] [Google Scholar]
- Kennicutt, R. C. 2005, in Massive Star Birth: A Crossroads of Astrophysics, 227, eds. R. Cesaroni, M. Felli, E. Churchwell, & M. Walmsley, 3 [NASA ADS] [Google Scholar]
- Klein, T., Ciechanowicz, M., Leinz, C., et al. 2014, IEEE Trans. Terahertz Sci. Technol., 4, 588 [CrossRef] [Google Scholar]
- Kong, S., Tan, J. C., Caselli, P., et al. 2016, ApJ, 821, 94 [NASA ADS] [CrossRef] [Google Scholar]
- König, C., Urquhart, J. S., Csengeri, T., et al. 2017, A&A, 599, A139 [Google Scholar]
- Li, S., Sanhueza, P., Lu, X., et al. 2022, ApJ, 939, 102 [CrossRef] [Google Scholar]
- Li, S., Sanhueza, P., Zhang, Q., et al. 2023, ApJ, 949, 109 [NASA ADS] [CrossRef] [Google Scholar]
- Lin, S.-J., Pagani, L., Lai, S.-P., Lefèvre, C., & Lique, F. 2020, A&A, 635, A188 [EDP Sciences] [Google Scholar]
- Loison, J.-C., Wakelam, V., Gratier, P., & Hickson, K. M. 2019, MNRAS, 484, 2747 [NASA ADS] [CrossRef] [Google Scholar]
- Maret, S., Hily-Blant, P., Pety, J., Bardeau, S., & Reynier, E. 2011, A&A, 526, A47 [NASA ADS] [CrossRef] [EDP Sciences] [Google Scholar]
- Miettinen, O. 2020, A&A, 634, A115 [NASA ADS] [CrossRef] [EDP Sciences] [Google Scholar]
- Miettinen, O., Hennemann, M., & Linz, H. 2011, A&A, 534, A134 [NASA ADS] [CrossRef] [EDP Sciences] [Google Scholar]
- Molinari, S., Pezzuto, S., Cesaroni, R., et al. 2008, A&A, 481, 345 [NASA ADS] [CrossRef] [EDP Sciences] [Google Scholar]
- Molinari, S., Swinyard, B., Bally, J., et al. 2010, PASP, 122, 314 [Google Scholar]
- Morii, K., Sanhueza, P., Nakamura, F., et al. 2023, ApJ, 950, 148 [NASA ADS] [CrossRef] [Google Scholar]
- Müller, H. S. P., Schlöder, F., Stutzki, J., & Winnewisser, G. 2005, JMoSt, 742, 215 [Google Scholar]
- Öberg, K. I., & Bergin, E. A. 2021, Phys. Rep., 893, 1 [Google Scholar]
- Pagani, L., Salez, M., & Wannier, P. G. 1992, A&A, 258, 479 [NASA ADS] [Google Scholar]
- Patil, A., Huard, D., & Fonnesbeck, C. 2010, JSS, 35, 1 [Google Scholar]
- Pillai, T., Caselli, P., Kauffmann, J., et al. 2012, ApJ, 751, 135 [Google Scholar]
- Redaelli, E., Bizzocchi, L., Caselli, P., et al. 2019, A&A, 629, A15 [NASA ADS] [CrossRef] [EDP Sciences] [Google Scholar]
- Redaelli, E., Bizzocchi, L., & Caselli, P. 2020, A&A, 644, A29 [NASA ADS] [CrossRef] [EDP Sciences] [Google Scholar]
- Redaelli, E., Bovino, S., Giannetti, A., et al. 2021, A&A, 650, A202 [NASA ADS] [CrossRef] [EDP Sciences] [Google Scholar]
- Redaelli, E., Bovino, S., Sanhueza, P., et al. 2022, ApJ, 936, 169 [NASA ADS] [CrossRef] [Google Scholar]
- Sabatini, G., Giannetti, A., Bovino, S., et al. 2019, MNRAS, 490, 4489 [Google Scholar]
- Sabatini, G., Bovino, S., Giannetti, A., et al. 2020, A&A, 644, A34 [EDP Sciences] [Google Scholar]
- Sabatini, G., Bovino, S., Giannetti, A., et al. 2021, A&A, 652, A71 [NASA ADS] [CrossRef] [EDP Sciences] [Google Scholar]
- Sabatini, G., Bovino, S., Sanhueza, P., et al. 2022, ApJ, 936, 80 [NASA ADS] [CrossRef] [Google Scholar]
- Sabatini, G., Bovino, S., & Redaelli, E. 2023, ApJ, 947, L18 [NASA ADS] [CrossRef] [Google Scholar]
- Sakai, T., Sanhueza, P., Furuya, K., et al. 2022, ApJ, 925, 144 [NASA ADS] [CrossRef] [Google Scholar]
- Sanhueza, P., Contreras, Y., Wu, B., et al. 2019, ApJ, 886, 102 [Google Scholar]
- Saraceno, P., Andre, P., Ceccarelli, C., Griffin, M., & Molinari, S. 1996, A&A, 309, 827 [Google Scholar]
- Scholz, F. W., & Stephens, M. A. 1987, JASA, 82, 918 [Google Scholar]
- Schuller, F., Menten, K. M., Contreras, Y., et al. 2009, A&A, 504, 415 [NASA ADS] [CrossRef] [EDP Sciences] [Google Scholar]
- Sipilä, O., Caselli, P., & Taquet, V. 2016, A&A, 591, A9 [NASA ADS] [CrossRef] [EDP Sciences] [Google Scholar]
- Sipilä, O., Caselli, P., Redaelli, E., Juvela, M., & Bizzocchi, L. 2019, MNRAS, 487, 1269 [Google Scholar]
- Smartt, S. J. 2009, ARA&A, 47, 63 [NASA ADS] [CrossRef] [Google Scholar]
- Socci, A., Sabatini, G., Padovani, M., Bovino, S., & Hacar, A. 2024, A&A, 687, A70 [NASA ADS] [CrossRef] [EDP Sciences] [Google Scholar]
- Tang, X. D., Henkel, C., Wyrowski, F., et al. 2018, A&A, 611, A6 [NASA ADS] [CrossRef] [EDP Sciences] [Google Scholar]
- Urquhart, J. S., Csengeri, T., Wyrowski, F., et al. 2014a, A&A, 568, A41 [NASA ADS] [CrossRef] [EDP Sciences] [Google Scholar]
- Urquhart, J. S., Moore, T. J. T., Csengeri, T., et al. 2014b, MNRAS, 443, 1555 [Google Scholar]
- Urquhart, J. S., König, C., Giannetti, A., et al. 2018, MNRAS, 473, 1059 [Google Scholar]
- Urquhart, J. S., Figura, C., Wyrowski, F., et al. 2019, MNRAS, 484, 4444 [Google Scholar]
- Urquhart, J. S., Wells, M. R. A., Pillai, T., et al. 2022, MNRAS, 510, 3389 [NASA ADS] [CrossRef] [Google Scholar]
- van der Tak, F. F. S., Black, J. H., Schöier, F. L., Jansen, D. J., & van Dishoeck, E. F. 2007, A&A, 468, 627 [NASA ADS] [CrossRef] [EDP Sciences] [Google Scholar]
- van Dishoeck, E. F., & Blake, G. A. 1998, ARA&A, 36, 317 [Google Scholar]
- Vastel, C., Caselli, P., Ceccarelli, C., et al. 2006, ApJ, 645, 1198 [NASA ADS] [CrossRef] [Google Scholar]
- Wienen, M., Wyrowski, F., Menten, K. M., et al. 2015, A&A, 579, A91 [NASA ADS] [CrossRef] [EDP Sciences] [Google Scholar]
- Zinnecker, H., & Yorke, H. W. 2007, ARA&A, 45, 481 [Google Scholar]
Defined as the ratio between the expected CO/H2 abundance and the observed one (e.g., Caselli et al. 1999).
All Tables
Comparison between the physical properties presented in Sabatini et al. (2020) and those in Urquhart et al. (2022).
All Figures
|
Fig. 1 Heliocentric distance versus the FWHM of (a) N2H+ and (b) N2D+. Orange and magenta lines represent the median FWHM values of N2H+ and N2H+, respectively, within the quiescent (solid), the protostellar (dotted) and the YSO (dashed) groups. Panel (c) compares the FWHMs of the two molecular tracers, with colours indicating the different evolutionary stages (dark blue: quiescent; green: protostellar; yellow: YSO). The uncertainties are shown as black bars. |
| In the text | |
|
Fig. 2 Correlations between L/M and the abundances of o-H2D+, N2D+, and N2H+ obtained with the LTE analysis. Blue dots refer to sources associated with the evolutionary sequence defined in Sect. 2.2, whilst grey dots are associated with PDRs. Shaded dots refer to sources in which o-H2D+ is not detected. The blue dashed lines show the result of a linear least-squares fit to the data, while the cyan shaded areas show the 3σ uncertainties on the best-fit parameters (errors in parenthesis). |
| In the text | |
|
Fig. 3 Column densities of N2D+ compared to those of N2H+ and obtained under (a) LTE and (b) NLTE conditions. The different colours of markers refer to the evolutionary stages of clumps, as in Fig. 1. Lines show the median values of the deuteration fraction for the quiescent group (solid line; |
| In the text | |
|
Fig. 4 Summary of the observed evolutionary trends. Panel a: Abundances of o-H2D+ (blue symbols) and N2D+ (red symbols) as a function of the evolutionary class defined in Sect. 2.2. Circles and diamonds refer to results from this work and Giannetti et al. (2019), respectively. Panel b: median RD factors derived for each evolutionary class defined in our sample. Different colours refer to values obtained from LTE and NLTE analysis discussed in Sects. 4.2.1 and 4.2.2. |
| In the text | |
|
Fig. A.1 Spectral overview of the N2D+ (top) and N2H+ (bottom) lines observed in the entire sample. In each panel, the source name and evolutionary stage are shown in the lower centre and upper right corners, respectively. The MCWeeds models are shown in red for N2D+ and in blue for N2H+. The dotted lines represent the 3σ noise levels. The vertical dashed lines indicate the Vlsr of the sources (see Table A.2). Spectra have been multiplied by an arbitrary factor, shown in each panel. |
| In the text | |
Current usage metrics show cumulative count of Article Views (full-text article views including HTML views, PDF and ePub downloads, according to the available data) and Abstracts Views on Vision4Press platform.
Data correspond to usage on the plateform after 2015. The current usage metrics is available 48-96 hours after online publication and is updated daily on week days.
Initial download of the metrics may take a while.