Fig. 3
Download original image
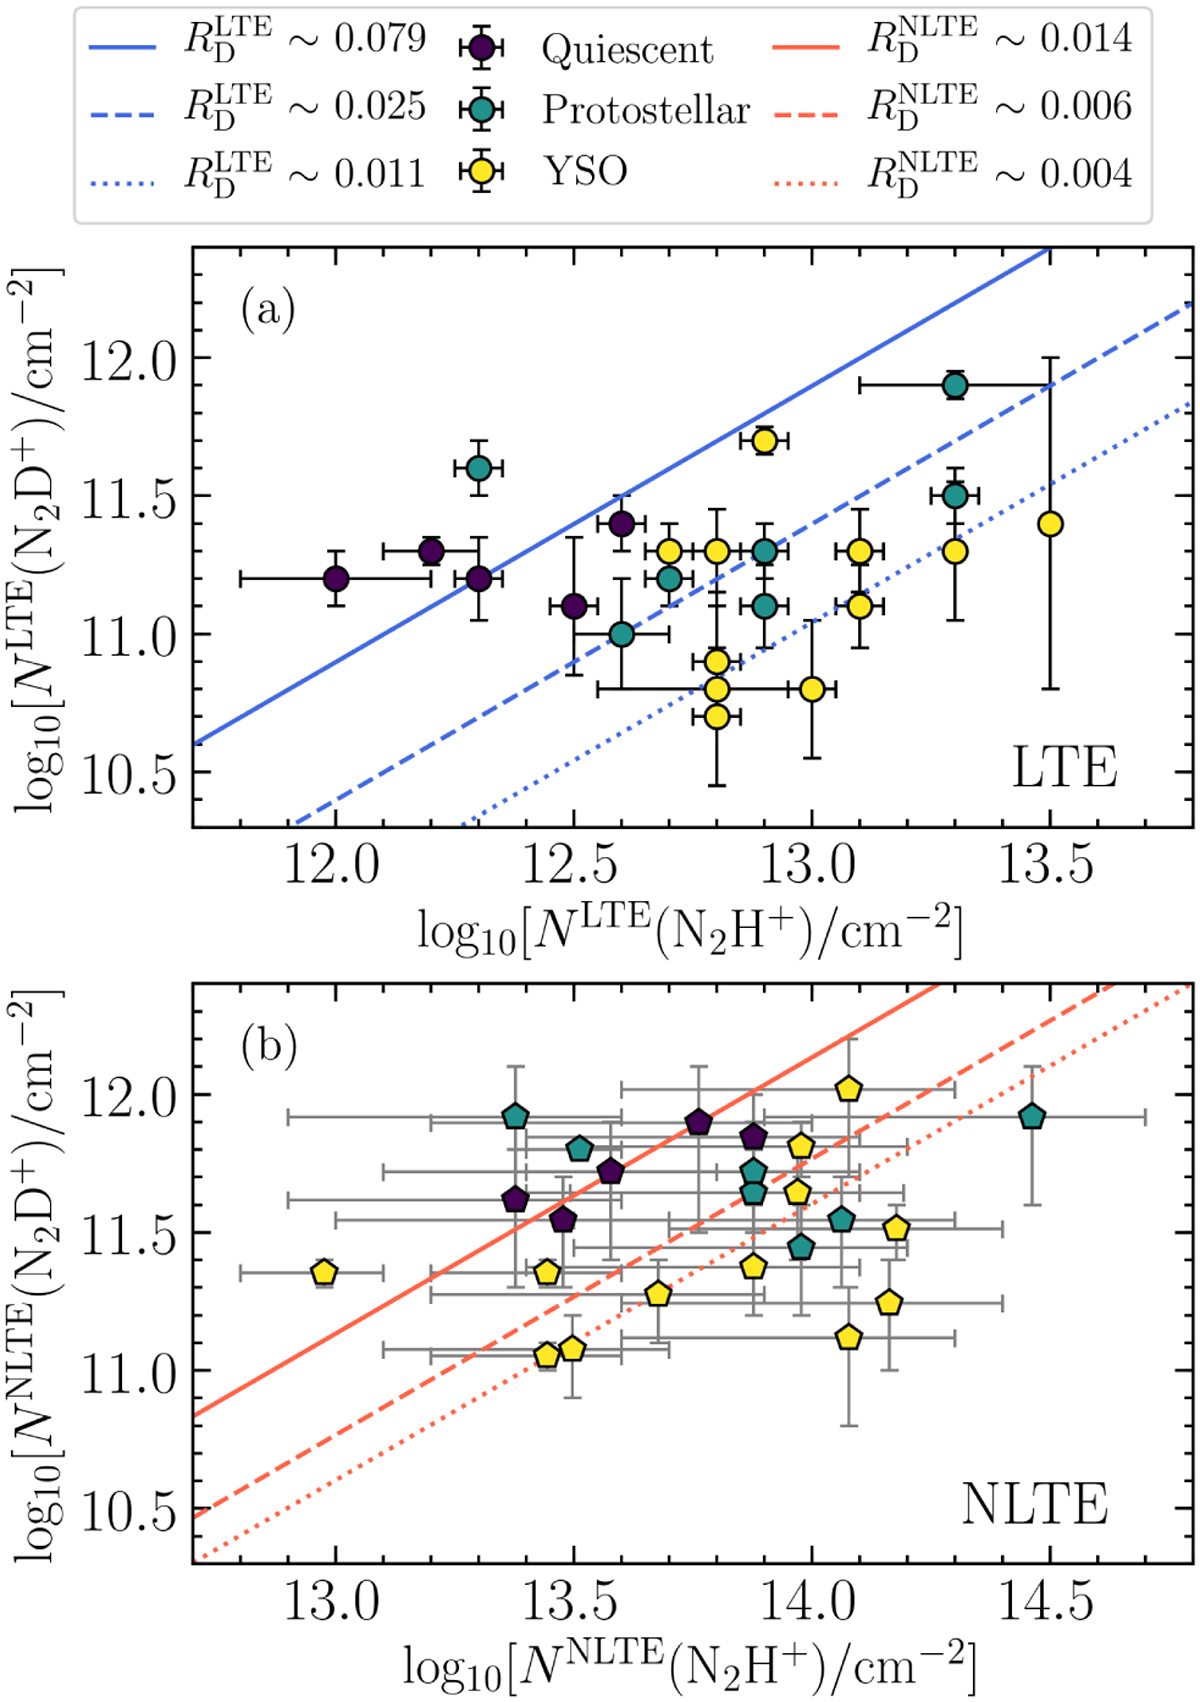
Column densities of N2D+ compared to those of N2H+ and obtained under (a) LTE and (b) NLTE conditions. The different colours of markers refer to the evolutionary stages of clumps, as in Fig. 1. Lines show the median values of the deuteration fraction for the quiescent group (solid line; ![]() and
and ![]() ), the protostellar group (dashed line;
), the protostellar group (dashed line; ![]() and
and ![]() ), and the YSO group (dotted line;
), and the YSO group (dotted line; ![]() and
and ![]() ). The black bars show the uncertainties associated with NLTE , while the grey bars refer to the ranges in NNLTE listed in Table A.2.
). The black bars show the uncertainties associated with NLTE , while the grey bars refer to the ranges in NNLTE listed in Table A.2.
Current usage metrics show cumulative count of Article Views (full-text article views including HTML views, PDF and ePub downloads, according to the available data) and Abstracts Views on Vision4Press platform.
Data correspond to usage on the plateform after 2015. The current usage metrics is available 48-96 hours after online publication and is updated daily on week days.
Initial download of the metrics may take a while.