Fig. 2
Download original image
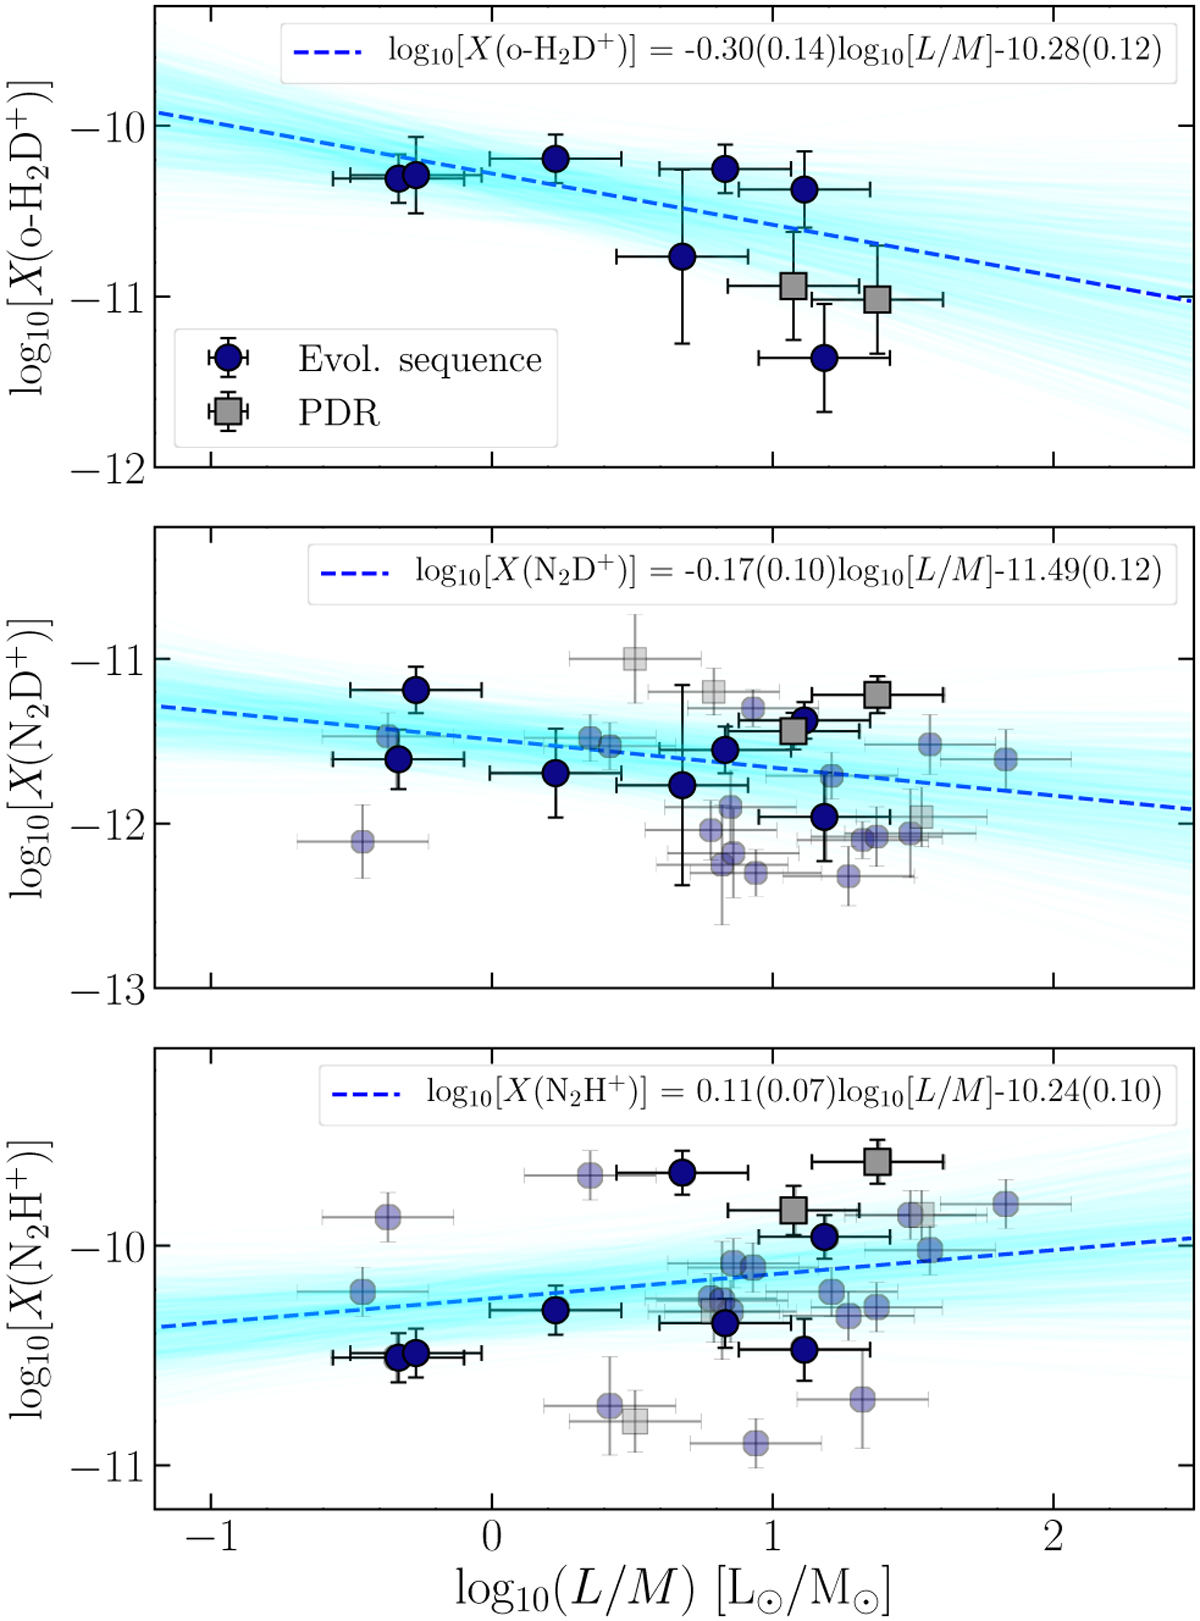
Correlations between L/M and the abundances of o-H2D+, N2D+, and N2H+ obtained with the LTE analysis. Blue dots refer to sources associated with the evolutionary sequence defined in Sect. 2.2, whilst grey dots are associated with PDRs. Shaded dots refer to sources in which o-H2D+ is not detected. The blue dashed lines show the result of a linear least-squares fit to the data, while the cyan shaded areas show the 3σ uncertainties on the best-fit parameters (errors in parenthesis).
Current usage metrics show cumulative count of Article Views (full-text article views including HTML views, PDF and ePub downloads, according to the available data) and Abstracts Views on Vision4Press platform.
Data correspond to usage on the plateform after 2015. The current usage metrics is available 48-96 hours after online publication and is updated daily on week days.
Initial download of the metrics may take a while.