Fig. 4
Download original image
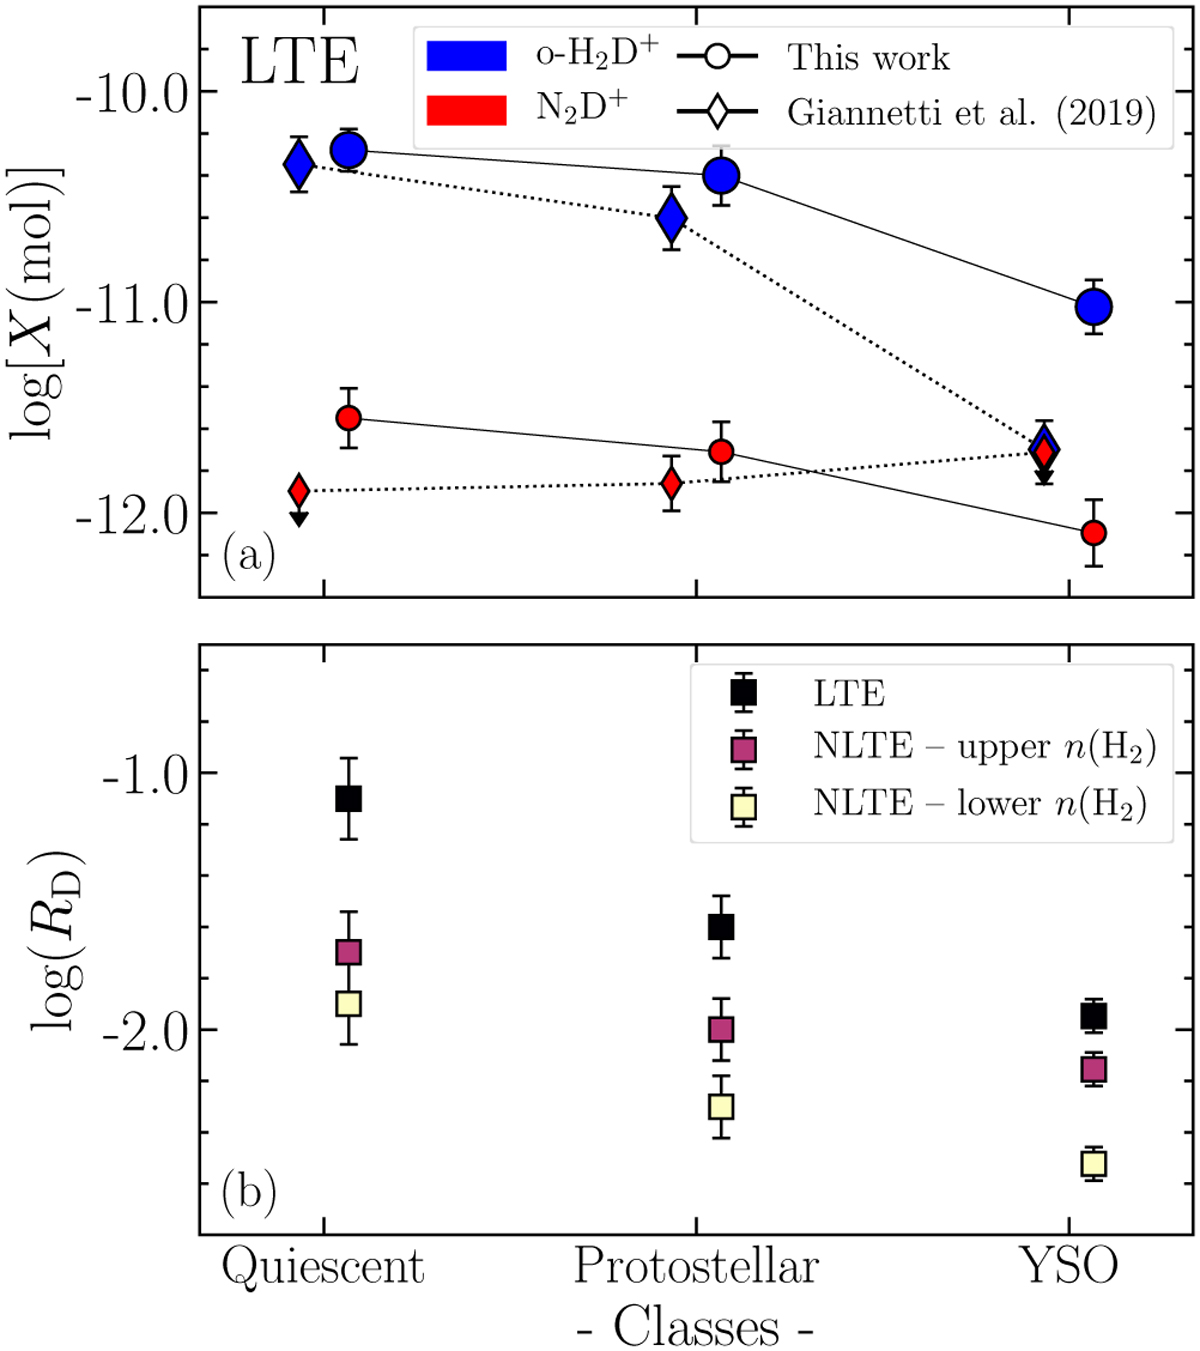
Summary of the observed evolutionary trends. Panel a: Abundances of o-H2D+ (blue symbols) and N2D+ (red symbols) as a function of the evolutionary class defined in Sect. 2.2. Circles and diamonds refer to results from this work and Giannetti et al. (2019), respectively. Panel b: median RD factors derived for each evolutionary class defined in our sample. Different colours refer to values obtained from LTE and NLTE analysis discussed in Sects. 4.2.1 and 4.2.2.
Current usage metrics show cumulative count of Article Views (full-text article views including HTML views, PDF and ePub downloads, according to the available data) and Abstracts Views on Vision4Press platform.
Data correspond to usage on the plateform after 2015. The current usage metrics is available 48-96 hours after online publication and is updated daily on week days.
Initial download of the metrics may take a while.