Fig. A.1
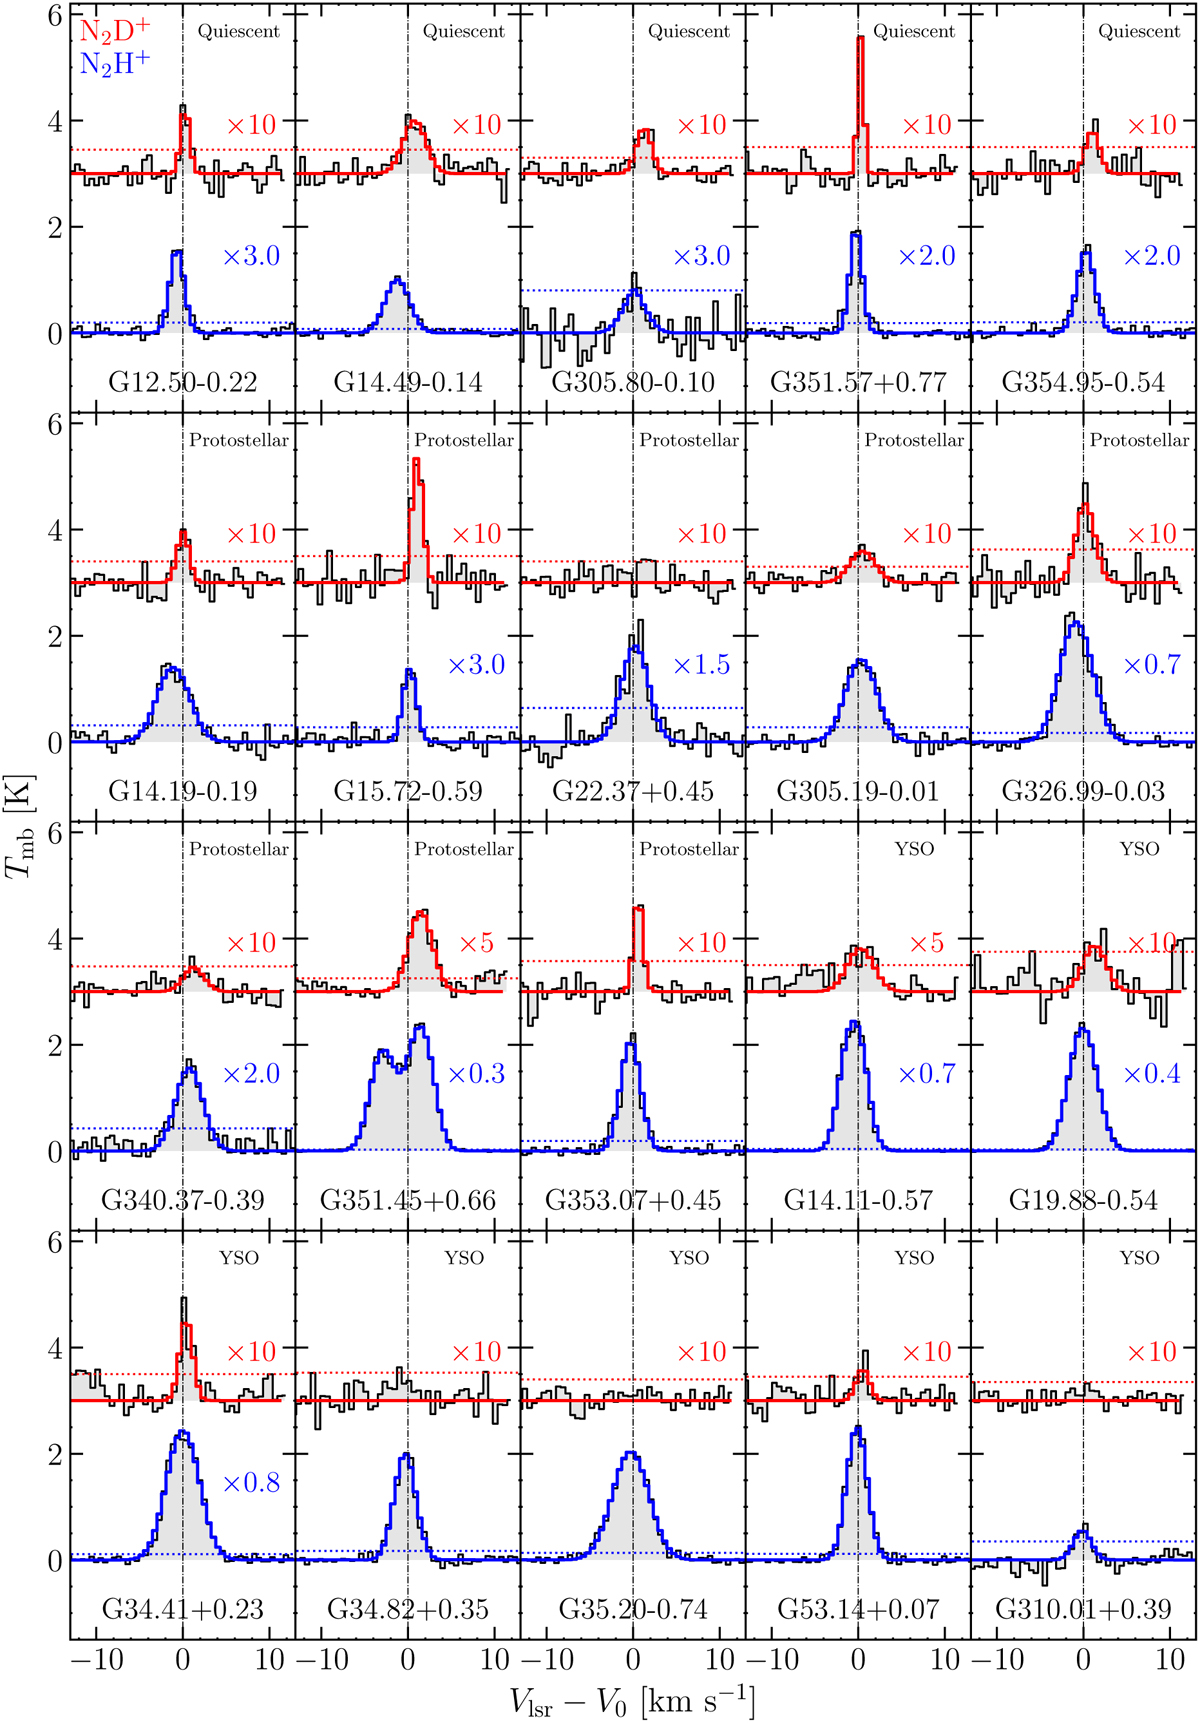
Download original image
Spectral overview of the N2D+ (top) and N2H+ (bottom) lines observed in the entire sample. In each panel, the source name and evolutionary stage are shown in the lower centre and upper right corners, respectively. The MCWeeds models are shown in red for N2D+ and in blue for N2H+. The dotted lines represent the 3σ noise levels. The vertical dashed lines indicate the Vlsr of the sources (see Table A.2). Spectra have been multiplied by an arbitrary factor, shown in each panel.
Current usage metrics show cumulative count of Article Views (full-text article views including HTML views, PDF and ePub downloads, according to the available data) and Abstracts Views on Vision4Press platform.
Data correspond to usage on the plateform after 2015. The current usage metrics is available 48-96 hours after online publication and is updated daily on week days.
Initial download of the metrics may take a while.