| Issue |
A&A
Volume 691, November 2024
|
|
|---|---|---|
| Article Number | A118 | |
| Number of page(s) | 15 | |
| Section | Extragalactic astronomy | |
| DOI | https://doi.org/10.1051/0004-6361/202451185 | |
| Published online | 01 November 2024 | |
AGN feeding along a one-armed spiral in NGC 4593
A study using ALMA CO(2–1) observations
1
European Southern Observatory (ESO), Karl-Schwarzschild-Strasse 2, 85748 Garching bei München, Germany
2
Physics Department, Aeronautics Institute of Technology – ITA, Praça Marechal Eduardo Gomes, 50, São José dos Campos, 12228-900 São Paulo, Brazil
3
Centro de Estudios de Física del Cosmos de Aragón (CEFCA), Plaza San Juan 1, 44001 Teruel, Spain
4
LERMA, Observatoire de Paris, Collége de France, PSL University, CNRS, Sorbonne University, Paris, France
5
INAF-Istituto di Astrofisica e Planetologia Spaziali, Via del Fosso del Cavaliere, 100, 00100 Roma, Italy
6
Instituto de Astrofísica de Canarias (IAC), E-38205 La Laguna, Tenerife, Spain
7
Universidad de La Laguna, Dpto. Astrofísica, E-38206 La Laguna, Tenerife, Spain
8
Instituto de Estudios Astrofísicos, Facultad de Ingeniería y Ciencias, Universidad Diego Portales, Av. Ejército Libertador 441, Santiago, Chile
9
Kavli Institute for Astronomy and Astrophysics, Peking University, Beijing 100871, China
10
Department of Space, Earth & Environment, Chalmers University of Technology, SE-412 96 Gothenburg, Sweden
11
National Astronomical Observatory of Japan, National Institutes of Natural Sciences (NINS), 2-21-1 Osawa, Mitaka, Tokyo 181-8588, Japan
12
Department of Astronomy, School of Science, Graduate University for Advanced Studies (SOKENDAI), Mitaka, Tokyo 181-8588, Japan
13
Instituto de Física Fundamental, CSIC, Calle Serrano 123, E-28006 Madrid, Spain
14
Departamento de Tecnologías Industriales, Facultad de Ingeniería, Universidad de Talca, Los Niches km 1, Curicó, Chile
⋆ Corresponding author; This email address is being protected from spambots. You need JavaScript enabled to view it.
Received:
19
June
2024
Accepted:
19
September
2024
Abstract
Context. We investigate active galactic nuclei (AGN) feeding through the molecular gas (CO(2−1) emission) properties of the local Seyfert 1 galaxy NGC 4593, using Atacama Large Millimeter Array (ALMA) observations and other multi-wavelength data.
Aims. Our study aims to understand the interplay between the AGN and the interstellar medium (ISM) in this galaxy, examining the role of the AGN in steering gas dynamics within its host galaxy, evaluating the energy injected into the ISM, and determining whether gas is inflowing or outflowing from the galaxy.
Methods. After reducing the ALMA CO(2−1) images, we employed two models, 3D-BAROLO and DISCFIT, to construct a disc model and fit its emission to the ALMA data. Additionally, we used photometric data to build a spectral energy distribution (SED) and apply the CIGALE code to derive key physical properties of the AGN and its host.
Results. Our analysis reveals a complex interplay within NGC 4593, including a clear rotational pattern, the influence of a non-axisymmetric bar potential, and a central molecular zone (CMZ)-like ring. We observe an outflow of CO(2−1) gas along the minor axis, at a distance of ∼220 pc from the nucleus. The total molecular gas mass is estimated to be 1 − 5 × 10⁸ M⊙, with non-circular motions contributing 10%. Our SED analysis indicates an AGN fraction of 0.88 and a star formation rate (SFR) of 0.42 M⊙ yr−1.
Conclusions. These findings highlight the complex dynamics in the centre of NGC 4593, which are significantly influenced by the presence of the AGN. The overall physical properties of this system suggest that the AGN has a substantial impact on the evolution of NGC 4593.
Key words: ISM: jets and outflows / galaxies: active / galaxies: evolution / galaxies: individual: NGC 4593 / galaxies: kinematics and dynamics / submillimeter: ISM
© The Authors 2024
 Open Access article, published by EDP Sciences, under the terms of the Creative Commons Attribution License (https://creativecommons.org/licenses/by/4.0), which permits unrestricted use, distribution, and reproduction in any medium, provided the original work is properly cited.
This article is published in open access under the Subscribe to Open model. This email address is being protected from spambots. You need JavaScript enabled to view it. to support open access publication.
1. Introduction
The role of active galactic nuclei (AGN) in shaping the evolution of galaxies across the Universe is not well understood. AGNs are powered by the accretion of matter into a supermassive black hole (SMBH) in the galaxy’s core, and in many cases, their luminosity outshines that of the host galaxy (Kauffmann & Haehnelt 2000; Heckman et al. 2004; Hopkins et al. 2005).
Observational and theoretical studies in the last decades have highlighted a possible link between the redshift evolution of black hole (BH) accretion and the star formation rate in galaxies, which may result from feeding and feedback processes (Silk & Rees 1998; Fabian 2012). The relative influence of matter accretion (feeding) versus feedback processes, such as energy released in the form of radiation, outflows, and jets, likely interacts with the surrounding medium, preventing the gas from cooling and condensing into stars. AGN feedback can also have positive effects, such as jet-induced star formation (e.g., Combes 2017). These processes are observed in various gas phases, including molecular, atomic, and ionised, and their interaction with host galaxies remains a topic of ongoing research (e.g., Cicone et al. 2014; Hatziminaoglou et al. 2010; Morganti 2017; Fiore et al. 2017; Tombesi et al. 2015).
Theoretical works suggest that even a tiny fraction of the vast energy produced by AGN can have a significant impact on the growth and evolution of galaxies, highlighting the importance of further research in this area (e.g., McNamara & Nulsen 2007; Gitti et al. 2012; Gaspari et al. 2020; Schawinski et al. 2007). Massive molecular outflows are observed in many galaxies and are generally interpreted as the long-sought feedback mechanism. However, the exact properties and timescales of this feedback are still not fully understood (Morganti 2017). Several studies suggest that the observed outflows do not suppress star formation in their host galaxies (e.g., Feruglio et al. 2010; Harrison 2013). The relationship between AGN feedback and star formation is indeed complex, suggesting a potential interplay between these two processes (e.g., Harrison 2017; Girdhar et al. 2022).
AGN radiation is often ‘hidden’ by large amounts of dust and gas, which prevents the study of the activities in the central part of galaxies where the interaction between AGN and host galaxy takes place (Hickox & Alexander 2018). Dust and gas absorb and scatter radiation from the central AGN, thereby attenuating the radiation intensity, and the dust grains mainly absorb the FUV radiation and re-emit it mostly at far-infrared (FIR) wavelengths. This reemission in the IR drastically affects the observable parameters of the AGN (Pier & Krolik 1992), and polarising its light provides important knowledge on the AGN structure and shape (Antonucci & Miller 1985). Studies demonstrate that radiative feedback from AGNs confirms that radiation pressure on dusty gas is the primary mechanism regulating the obscuration and, consequently, the visibility of AGN activities (Hensley et al. 2014; Venanzi et al. 2020; Arakawa et al. 2022; Ishibashi & Fabian 2015; Ricci et al. 2017a, 2022). The AGN feedback effectively clears out the obscuring dust and gas within the BH, impacting its interaction with the host galaxy. The study by Hopkins et al. (2012) suggests that radiation pressure on dust grains is a significant, yet not exclusive, driver of galactic superwinds. In a specific case, Contursi et al. (2013) observed in the outflow of M 82 that dust is kinematically decoupled from gas, indicating that dust grains move slower than ionised and molecular gas and may fall back into the galaxy disc.
Carbon monoxide (CO) is a pivotal tracer for cold molecular gas in galaxies, detectable with submillimetre and radio telescopes (e.g., Bolatto et al. 2013). The several rotational transitions of the CO molecules provide insights into the molecular gas temperature and density (e.g., Weiß et al. 2005; Papadopoulos et al. 2010; Kamenetzky et al. 2018; Andreani et al. 2018). Several ALMA observations of galaxies have particularly focused on the dynamics of the gas around AGN (Veilleux et al. 2020; Esposito et al. 2022), highlighting the influence of AGN emission on the molecular gas properties. The exact nature of this influence, especially on star-forming gas, can be localised and complex (Rosario et al. 2019). Multi-transition CO data modelling further refines our understanding of the AGN impact on molecular gas (van der Werf et al. 2010; Fluetsch et al. 2019).
High-resolution CO observations are crucial to constrain the spatial and velocity dynamics of molecular gas (Sun et al. 2018). Through moment maps, we derive the properties of the gas dynamics, with zeroth, first, and second moment maps detailing the CO emission distribution, line-of-sight velocity, and velocity dispersion, respectively (e.g., Davis et al. 2013). Different studies examine the relationship between CO molecular gas and obscured AGN, highlighting the intricate interplay with dust. For instance, ALMA observations of dust-obscured quasars at high redshifts unveil molecular gas outflows and feedback mechanisms, suggesting a potential evolutionary sequence between star-forming galaxies, ultra-luminous infrared galaxies, and quasars (Spingola et al. 2019; Brusa 2017). However, this correlation may primarily be driven by underlying factors such as stellar mass and SFR. Interestingly, when controlling for star formation, Koss et al. (2021) find no significant differences in molecular gas properties between AGN-hosting galaxies and inactive galaxies, indicating that AGN feedback might not have a discernible impact on the molecular gas reservoirs.
Molecular outflows are usually identified in high spectral resolution data cubes as high-velocity gas deviating from a regular gas rotation (e.g., Cicone et al. 2014). In a comprehensive study, Lutz et al. (2020) discuss methods for detecting such outflows, emphasising the intermittent activity of AGN as a potential driver (e.g., Newman et al. 2012). Additionally, Stuber et al. (2021) find that central molecular outflows are relatively common in nearby spiral galaxies, especially those with higher stellar mass and SFR. These outflows often link to AGN and bars, but they seem to have a limited effect on suppressing star formation due to their low mass-loading factors.
In this paper, we report a study of the galaxy NGC 4593, which belongs to the Twelve-micron WInd STatistics (TWIST) sample, a CO(2−1) molecular gas survey of 41 galaxies drawn from the 12-micron sample (Rush et al. 1993). Other studies (Fernández-Ontiveros et al. 2020; Bewketu Belete et al. 2021) have reported results derived from four galaxies in the same sample.
NGC 4593 is a face-on spiral galaxy in the southern sky (α = 12h39m39.4s, δ = −5° 20′39″) located at D ≈ 39 ± 4 Mpc (Marinova & Jogee 2007). This galaxy is a well-defined barred spiral with nuclear, inner, and outer rings, classified morphologically as (R)SB(rs)b (de Vaucouleurs et al. 1991). It contains a prominent bar that likely drives gas inflow toward the nucleus. NGC 4593 has a nuclear dust ring linked to radial dust lanes in the galaxy’s bar, indicative of gas inflow (e.g., Wu et al. 2021; Hunt et al. 2008; Laine 2001). The accretion disc size in NGC 4593 exceeds that of the broad-line region, hinting at a complex central engine structure (e.g., Cackett 2019). NGC 4593 is a well-studied Seyfert 1 galaxy, exhibiting polarised continuum emission, X-ray, UV, and radio variability, as well as time lags between FUV and NUV bands, and between 0.3 − 0.5 keV vs. 0.8 − 1.5 keV and 0.3 − 0.5 keV vs. 4.0 − 10.0 keV energy bands (Sriram et al. 2009; Kumari et al. 2023; Kammoun et al. 2021).
The density profile of NGC 4593’s circumnuclear medium aligns with a power-law distribution, indicating a continuous gas distribution around the central BH (Wang et al. 2022). In Table 1, we summarise the observed properties and measured quantities for NGC 4593, providing an overview of the galaxy’s physical characteristics, which are used in this work.
Observed properties of NGC 4593.
The main goal of this paper is to study the molecular gas properties in the central part of NGC 4593 using ALMA observations of the CO(2−1) transition. Using these observations (Section 2), we model the data to determine the kinematics and morphology of the gas (Section 3). To acquire a better understanding of the interaction between the molecular gas and the AGN, we further enhance our study by using observations at other wavelengths to create a spectral energy distribution (SED). This approach provides a more holistic perspective of the galaxy, allowing for a better understanding of the influence of AGN activity on its host galaxy. We discuss how our findings contribute to the ongoing debate over the mechanisms driving AGN feeding, feedback, and dust emission, as well as their impact on galaxy evolution, in Section 4.
2. Observations
2.1. ALMA mm/sub-mm interferometry
NGC 4593 was observed by the Atacama Large Millimeter/submillimeter Array (ALMA) on January 4th, 2018 (Cycle 5, PI Matthew A. Malkan, Program ID: 2017.1.00236.S). The spectral setup was optimised for the CO(2−1) transition line in band 6, at a rest frequency of 230.5380 GHz. The synthesised beam size was 0.029″ × 0.027″, and the rms sensitivity was 0.36 mJy/beam over 0.9767 GHz. The observations consist of a total of 1920 channels with a total bandwidth of 1.875 GHz. The observing parameters are detailed in Table 2.
ALMA observations of NGC 4593.
Data were calibrated and imaged using the Common Astronomy Software Applications (CASA) package (Bean et al. 2022), pipeline v5.1.1-5, and our own scripts to perform the imaging and post-processing tasks under CASA v5.4.0-70. For the image reconstruction, we used the standard hogbom deconvolution algorithm with briggs weighting and a robustness value of 2.0. The beam size for our object in the CO(2−1) spectral window is 12.8″ × 6.5″ at a position angle of PA = −59.3°, corresponding to 438 × 345 pc2 at a distance of 39 Mpc. The field of view (FOV) has a diameter of 27″ (5.1 kpc) and is covered using a single pointing, with the largest angular scale recoverable being 2.6″ (∼490 pc). The continuum sensitivity of the data is 0.1 mJy/beam, while the rms noise for the spectral line data, with a channel width of 10 km/s, is 0.7 mJy/beam.
After reconstructing the image, we prepared the final CO data cube and maps. We used the same deconvolution algorithm for image reconstruction, processing it initially at the native velocity resolution of 2.4 km/s, as shown in Table 2. To improve the signal-to-noise ratio, we resampled the data to a coarser velocity resolution of 10 km/s. This resampling helped us optimise the analysis of kinematic features while preserving critical details. We applied a masking process to isolate CO(2−1) emission regions, starting with a threshold mask at 2 × rms noise level to detect significant emission. We then made manual adjustments to refine the mask and minimise noise. This process follows the methodology used in the analysis of ESO 420−G13 (Fernández-Ontiveros et al. 2020). After masking, we subtracted the continuum emission using a zero-degree polynomial fit in the spatial frequency domain and the adjacent channels. Finally, we corrected the data cubes for primary beam attenuation within the 37.84″ field of view, ensuring accurate calibration for further analysis.
2.2. Ancillary data
To gain a more comprehensive understanding of our object, we expanded our analysis beyond ALMA observations. Specifically, we adopted a multi-wavelength approach to construct a well-sampled SED. For this purpose, we utilise Johnson photometry for the U, B, and V bands (McAlary et al. 1983). Additionally, we incorporated far-ultraviolet (FUV) and near-ultraviolet (NUV) measurements from GALEX (Bouquin et al. 2018). Spitzer-IRS high-resolution spectra are crucial for constraining the dusty torus component at its peak wavelengths (Tommasin et al. 2010). 2MASS measurements were adopted for the near-infrared continuum in the J and H bands (Jarrett et al. 2003), and additional 2 μm observations were obtained from Skrutskie et al. (2006). The Wide-field Infrared Survey Explorer (WISE) survey contribute key data points in the mid-infrared range (Cutri et al. 2012). HST/STIS (UV, NIR, and optical) observations were collected from the HST science archive (archival research programme ID: HST-AR-16143; PI: M. Malkan) Malkan et al. (1998) and shown Fig. 1 (Cackett et al. 2018) together with the CO(2−1) emission.
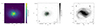 |
Fig. 1. Multi-wavelength observations of NGC 4593. Left: Background merged image from Hubble Space Telescope (HST) observations, combining data from the Wide Field Planetary Camera 2 (WFPC2) using the F606W filter and the F547M filter. The squared zoomed region highlights the inner galaxy, showing the AGN at its centre. Middle: Zoomed region of the HST image with contours from the ALMA CO (J = 2 − 1) emission line moment-0 map, illustrating the distribution and intensity of CO emission with contour levels of Contours = [0.25, 0.35, 0.4, 0.5, 1, 2, 4, 6]. Right: Digitized Sky Survey (DSS) image of the galaxy (Image credit: DSS, STScI). |
In order to provide a comprehensive view of possible AGN feeding and feedback mechanisms within host galaxies, our study incorporates SED fitting alongside our CO observations (Ciesla et al. 2015). This method enriches our analysis by enabling detailed quantification of dust and gas properties, crucial for interpreting molecular gas dynamics. By linking SED-derived parameters such as dust mass, SFRs, and the AGN’s Eddington ratio with CO kinematics, we can better understand the interplay between AGN activity and star formation. Furthermore, SED fitting allows us to identify the AGN component or fraction and assess its impact on the surrounding environment (Atlee et al. 2011; Karouzos et al. 2014; Salomé et al. 2023). We have complemented our observations with additional ALMA data, specifically for the continuum emission in Band 3. This observation was carried out under the project code: 2018.1.00576.S. The selected frequency band for this observation is Band 3, which ranges from 89.509 to 105.494 GHz. The angular resolution achieved during this observation is 0.25″. The Band 3 observation has a continuum sensitivity of 0.0259 mJy/Beam, obtained with an integration time of 5 minutes. The detailed information of the observations with ALMA is listed in Table 2. The photometry data used for the SED fitting, supported by ancillary data are listed in Table 3.
Photometry data for NGC 4593.
3. Results
3.1. Molecular gas properties
Moment maps were created from the available data cubes and are shown in Fig. 2. The moment-0 map delineates the overall spatial molecular gas distribution within the galaxy, indicating intensity values ranging from 0 to 6.0 Jy/beam km/s, with a heightened concentration of gas discernible in the very inner regions of the galaxy. The moment-1 map traces the velocity field of the gas, quantified in units of km/s, and highlights the dynamics in NGC 4593, including the rotational dynamics and the kinematic patterns inherent in the galaxy’s structure. In Fig. 2, we present a comparison between the dust and molecular gas distributions within the galaxy under study. This figure features the continuum emission, indicating the extent of dust, with ALMA CO(2−1) contours overlaid to highlight the molecular gas distribution.
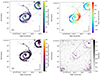 |
Fig. 2. CO(2−1) moment maps from the ALMA Band 6 data cube of NGC 4593, created using CASA. Top left: Integrated intensity (moment-0 map) showing the spatial distribution of the line flux, with a total calculated flux of approximately 100 Jy km/s. The colour bar represents the intensity scale in Jy km/s per beam units. Top right: Intensity-weighted velocity (moment-1 map) with scale bar units in km/s, tracing gas velocities and kinematics within the galaxy. Bottom left: Intensity-weighted velocity dispersion (moment-2 map) with scale bar units in km/s. Bottom right: ALMA Band 6 continuum image (background) displaying the dust distribution, overlaid with CO(2−1) emission moment-0 map contours from ALMA observation Project ID: 2017.1.00236.S. |
As shown in Fig. 2, the CO gas distribution within NGC 4593 exhibits a striking one-arm structure. This feature is indicative of a logarithmic m = 1 mode, which refers to a pattern where there is a single dominant spiral arm in the distribution of gas. This phenomenon is not commonly observed in the nuclear regions of barred galaxies (Shaw et al. 1995; Phookun et al. 1993; Ann & Thakur 2005; Thakur et al. 2009). The m = 1 mode suggests a significant deviation from axisymmetric equilibrium, potentially driven by tidal interactions or internal instabilities.
3.2. 3D-BAROLO model
To delve into the kinematics of NGC 4593’s innermost regions, we employed the 3D-Based Analysis of Rotating Object via Line Observations (3D-BAROLO) software (Di Teodoro & Fraternali 2015). This tool fits a 3D tilted-ring model to emission line data cubes, enabling us to infer the galaxy’s rotation curves and the gas column density, a critical parameter in our analysis. 3D-BAROLO provides two distinct normalisation options for the gas column density: pixel-by-pixel (LOCAL) and azimuthally averaged (AZIM). The LOCAL normalisation allows to consider the non-axisymmetric density models and prevents regions with unusual gas distributions, such as clumpy regions or voids, from skewing the overall fit. This method offers a granular view of the galaxy’s kinematics and is particularly beneficial when examining complex structures or regions with high spatial variability in the gas distribution. On the other hand, the AZIM normalisation uses the azimuthally averaged flux in each ring as the normalisation value, providing a more global perspective of the galaxy’s kinematics. This method is particularly effective when the goal is to understand large-scale kinematic patterns in the galaxy, such as rotation curves or velocity dispersions profiles.
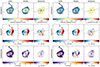 |
Fig. 4. Detailed intensity, velocity, and dispersion maps for the CO(2−1) emission in NGC 4593, developed using 3D-BAROLO software. The figure is divided into two panels: the left panel refers to the azimuthal normalised model, while the right one refers to the local normalised model. Each panel consists of a 3 × 3 grid of images (rows: intensity, velocity, dispersion; columns: data, model, residuals). The top row presents the CO(2−1) intensity maps across the field of view, with the colour bar representing the intensity scale in Jy km s−1 per beam units. The middle row shows the velocity maps, depicting the gas velocities across the field of view, with scale bar units in km/s. The bottom row displays the velocity dispersion of the CO(2−1) line across the field of view, also denoted in km/s. The left column in each panel shows the data, the middle column displays the model, and the right column provides the residuals. |
We used the CO(2−1) data cube with a spectral resolution of 10 km/s as input data for 3D-BAROLO. The tilted-ring model adopted by 3D-BAROLO operates on two fundamental assumptions: the emitting material is encapsulated within a thin disc, and the angular momentum of the galaxy is responsible for the observed rotational pattern. These assumptions prove to be remarkably effective in scrutinising galaxy kinematics, extending their applicability even to scenarios where the galaxy is not perfectly edge-on or the gas does not adhere to a circular motion trajectory. As inputs to the model, we used Hubble and Pan-STARRS images of the galaxy to deduce the initial values for position angle (PA) and inclination (INC). The ALMA moment-0 maps (see Fig. 2) are instrumental in pinpointing the galaxy’s centre and systemic velocity (Vsys). Fig. 3 showcases the channel maps, which feature two distinctive normalisations, LOCAL and AZIM, conceived through the analytical process of 3D-BAROLO.
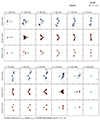 |
Fig. 3. CO(2−1) channel maps from the ALMA B6 data cube, generated using 3D-BAROLO modelling, provide insight into the morphology and gas kinematics of NGC 4593. The channel maps display velocities ranging from −230 km/s (top left) to +156 km/s (bottom right), relative to the galaxy’s systemic velocity (vsys). This vsys is estimated as the central velocity in the global line profile, valued at 12.56 km/s. The velocities presented signify deviations from this systemic velocity. Maps are shown in increments of 10 km/s, and each square box covers an area of 8.58″. The top row displays selected channels in blue, while the middle and bottom rows depict maps normalised using the azimuthal and local normalisation methods, respectively, highlighting distinct patterns in the emission’s spatial distribution and intensity. A green cross in each panel marks the disc’s centre, and solid red lines represent the RMS noise level (σrms) of 0.7 mJy. |
Fig. 4 shows a dissection of the molecular gas dynamics in NGC 4593, the CO(2−1) emission characteristics within the galaxy, as interpreted through two distinct normalisation methods: Azimuthal and Local, respectively portrayed in separate panels. The model enables us to discern a clear velocity field within the residual representations, indicating a spread of up to ±50 km/s. This trend is consistent across both the Azimuthal and Local normalisation techniques, substantiating the robustness of the observed patterns. Similarly, the velocity dispersion maps delineate variations up to 50 km/s, shedding light on the complex, yet orderly gas dynamics prevalent within the NGC 4593 galaxy. Furthermore, the velocity field distribution ranges from −150 to 150 km/s for both data and model, while the residuals show a range of −50 to 50 km/s. The dispersion (sigma) ranges from 10 to 35 km/s for data and model, and −10 to 20 km/s for residuals. The intensity ranges from 0.002 to 0.016 Jy km/s for data/model and −0.0025 to 0.0025 for residuals.
The position-velocity (p − v) diagrams of the CO(2−1) emission in NGC 4593, extracted from the data and model cubes along the major and minor axes, are shown in Fig. 5. For the major axis (top panel), the observed rotational velocities (yellow dots) from the best-fit disc model align closely with the data-derived contours, showcasing a consistent rotation curve. The minor axis (bottom panel), on the other hand, offers insights into non-rotational gas motions 1.5″ away from the centre of the galaxy (redshifted motion to the south of AGN near the centre). The dashed green circle in the bottom panel highlights a region about 2″ away from the centre, where possible gas inflow or outflow is observed. The disparities between the model and observed data in this plane may hint at vertical motions or inflows (or outflows), potentially driven by mechanisms like feeding or feedback, interactions with neighbouring galaxies, or even AGN-driven winds. In the bottom panel of Fig. 5, it is clear that the model does not accurately represent the molecular gas distribution between 4″ and 6″. This discrepancy could arise from the model primarily emphasising the central region. Alternatively, it might indicate the presence of cold molecular outflows.
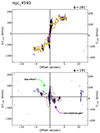 |
Fig. 5. Position-velocity (p − v) diagrams of the CO(2−1) emission in NGC 4593, extracted from the data and 3D-BAROLO model along the major (top panel) and minor (bottom panel) axes. Blue solid contours illustrate the p − v diagram derived from the data cube, while red solid contours depict the p − v diagram from the model cube. The contour levels for both data and model are set at [1, 2, 4, 8, 16, 32, 64]×l, with l = 0.0012. In the top panel, yellow solid dots represent the rotation velocity of each ring from the best-fit disc model. The dashed light green circle in the bottom panel highlights the region where a potential gas inflow or outflow is located. These p − v diagrams facilitate the investigation of the spatial and kinematic structure of the CO(2−1) emission in NGC 4593. |
3.3. DISCFIT model
To complement and cross-verify our results obtained from the 3D-BAROLO analysis, we utilised an additional analysis tool, DISCFIT. DISCFIT (Spekkens & Sellwood 2007) is an instrumental modelling tool for dissecting the structural components of galaxies. This tool adeptly deconstructs a galaxy’s luminosity distribution into its fundamental constituents, such as the disc, bulge, and bar structures, when they are present. We applied DISCFIT to NGC 4593 and replicated the galaxy’s observed kinematic features using the velocity moment map as an input, and utilising the same initial conditions as used for 3D-BAROLO. However, as shown in Fig. 6 (residuals in the top right and rotation curve comparison in the bottom plot), we observe notable deviations, particularly in the galaxy’s core and along the first eastern spiral arm. These deviations, visible in the residuals and the rotation curve comparison, show that while the models capture the general kinematic structure, they struggle to accurately represent the complex dynamics in these regions. One key observation is that 3D-BAROLO tends to align more closely with observational data when accounting for radial velocity, suggesting a potential overfitting to axisymmetric non-circular motions. In contrast, DISCFIT provides a more consistent fit regardless of radial velocity inclusion. Notably, DISCFIT does not significantly react to data bumps that 3D-BAROLO attempts to follow. A specific example of this behaviour is evident near the galaxy’s centre, around 0.8″ from the nucleus, which can be observed in the residual image of DISCFIT overlaid with contours.
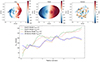 |
Fig. 6. CO(2−1) observed velocity field and corresponding residuals derived from DISCFIT modelling for NGC 4593. The left panel showcases the observed velocity field of the CO(2−1) emission, with the scale bar units given in km/s. The middle panel shows the residuals produced by subtracting the DISCFIT model from the observed data, with green contours representing levels of 5σrms. The bottom panel compares the rotation curve velocities (Vrot) obtained from both 3D-BAROLO and DISCFIT models, considering cases with and without radial velocity (Vrad). |
The discrepancy between models could also be attributed to their dimensional approaches: DISCFIT’s 2D modelling contrasts with 3D-BAROLO’s additional consideration of disc scale-height (Z0 parameter), set to 1″ in our study. This difference becomes particularly apparent at the edges of the rings in the models. 3D-BAROLO excels in detailing galaxy morphology, aiding in the derivation of physical quantities like surface density and the calculation of molecular and black hole masses. Conversely, DISCFIT better elucidates axisymmetric behaviours. However, the face-on orientation of NGC 4593 complicates the evaluation of model accuracy. Furthermore, the absence of the galaxy’s outer northern arms, approximately 10″ from the centre, raises questions about possible outer rings or gas stripped and scattered in a conical distribution.
In Fig. 7, we compare the spiral arm widths, estimated from the observational data of CO(2−1) molecular gas, with the disc scale height derived from 3D-BAROLO modelling. In the inner disc region (0 to 5.5″), the spiral arm width ranges from 1.0″ to 1.3″, while the disc scale height shows a similar variation, from 1.1″ to 1.3″. Beyond 5.5″, the single-arm region has a width ranging from 1.35″ to 1.45″. Although it is not possible to measure the flaring directly without an edge-on galaxy, the proportionality between the width and height suggests that the flaring in NGC 4593 is compatible with that seen in other galaxies (e.g., Patra 2020).
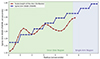 |
Fig. 7. Comparison between the spiral arm widths and disc scale height as a function of radius in NGC 4593. The blue line represents the spiral arm widths, estimated from the observational data of CO(2−1) molecular gas. The red line shows the disc scale height, derived from 3D-BAROLO modelling. |
4. Discussion
4.1. Gas kinematics
In our analysis, delineated in Fig. 8, we subjected the ALMA data for NGC 4593 to a detailed 3D-BAROLO analysis. This analytical representation comprises six plots, each detailing a distinctive parameter – Vrot (rotation velocity), σgas (gas velocity dispersion), vrad (radial velocity), ϕ (azimuthal angle), i (inclination angle), and Σ (gas surface density measured in Jy km/s) – in relation to the radius measured in arcseconds.
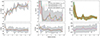 |
Fig. 8. Kinematic and structural parameters of NGC 4593 as a function of radius. Top row, from left to right: Rotation Velocity (Vrot), Velocity Dispersion (σgas), and Surface Density (Σ). Bottom row, from left to right: Inclination Angle (i) showing the variation of inclination with radius, Position Angle (ϕ) illustrating the fluctuation of position angle with radius, and Radial Velocity (Vrad) displaying the radial velocity (km/s) versus radius, marked in grey. In each subplot, the observational data are represented by grey points with error bars. The fitted azimuthal normalisation with Vrad = 0 is depicted by an orange line with a dash-dot pattern, while the local normalisation series with Vrad = 0 is shown as a solid green line. The local normalisation with Vrad ≠ 0 is represented by a dashed red line, and the azimuthal normalisation with Vrad ≠ 0 is indicated by a dotted blue line. |
The best-fit values of the model to the data, derived from this analysis, indicate an average inclination of 47.4° and a position angle (PA) of 276°. Since the kinematic major axis is roughly E-W, the near side is located to the north, and the far side to the south, as indicated by the molecular gas kinematics (see Fig. 9). We conclude that the near side of NGC 4593 is to the north and the far side to the south, further supported by the dust lane morphology visible in HST images (see Fig. 1). This conclusion is confirmed by extended MUSE observations of the galaxy’s kinematics (den Brok et al. 2020), which ensure consistency with the northern side as the near side.
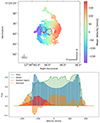 |
Fig. 9. Analysis of molecular gas dynamics in NGC 4593. Top: Red-circled region (a) indicates potential non-circular motion due to the outflow of cold molecular gas, visible on the mean velocity map (background). The central dashed circle (region b) highlights the CMZ-like ring, which contains significant molecular gas. Bottom: Comparison between the CO(2−1) ALMA observations (green) and the 3D-BAROLO model (blue) for NGC 4593. The plot shows the average flux as a function of velocity, with residuals (orange) and possible outflowing gas from region (a) highlighted in red. |
The residual map reveals deviations from the expected rotation (see Figs. 4, 6). A redshifted residual does not necessarily imply that a region is receding; it may instead indicate less blueshifted velocity than expected. These residuals could result from unmodelled radial gas motions or other dynamic factors. 3D-BAROLO’s axisymmetric assumption may not fully account for the kinematics of molecular gas in heavily barred systems. For instance, Schnorr-Müller et al. (2014) demonstrated that non-axisymmetric bar potentials in NGC 2110 influenced significant molecular outflows, suggesting that similar effects could be at play in NGC 4593.
4.2. Estimation of the molecular gas mass
We computed the CO(2−1) line luminosity  using the following equation (Solomon & Vanden Bout 2005):
 (1)
(1)
To determine the total flux SCOΔv, we used the moment-0 map of the ALMA CO(2−1) observations (Fig. 2), where the restoring beam size is 0.23″ × 0.18″ at a position angle of −59.30°. Focusing on a region with a 12″ radius, we obtained a flux density of 146.3 ± 1.1 Jy km/s, which serves as our value for SCOΔv. Using these values, along with D = 39 Mpc, z = 0.009, and νobs = 230 GHz, we calculated the CO(2−1) line luminosity to be:
![Mathematical equation: $$ \begin{aligned} L^{\prime }_{\mathrm{CO} (2{-}1)} \approx 1.40 \pm 0.10\times 10^{8} \,\, [\mathrm K\,km\,s^{-1}\,pc^{2} ]. \end{aligned} $$](/articles/aa/full_html/2024/11/aa51185-24/aa51185-24-eq3.gif) (2)
(2)
We then converted  to
to  using a conversion ratio of
  , which reflects the typical ratio observed in galaxies with moderate to high levels of star formation, including (ultra) luminous infrared galaxies ((U)LIRGs) (Kamenetzky et al. 2016). This conversion yields:
![Mathematical equation: $$ \begin{aligned} L^{\prime }_{\mathrm{CO} (1{-}0)} \approx (0.28 \pm 0.02) \times 10^{8} \,\, [\mathrm K\,km\,s^{-1}\,pc^{2} ]. \end{aligned} $$](/articles/aa/full_html/2024/11/aa51185-24/aa51185-24-eq7.gif) (3)
(3)
Using the conversion factor αCO, which ranges from 0.8 M⊙ to 3.2 M⊙ (Bolatto et al. 2013), we estimated the molecular gas mass M(H2) to be within the range:
 (4)
(4)
It is important to note that, in addition to the conversion factor, there are uncertainties in the derived total CO luminosity due to the nature of interferometric observations, which can filter out extended emissions. Consequently, the total molecular gas mass could be larger if CO(2−1) emission is more extended.
4.3. Estimation of SMBH mass
To estimate the mass of the supermassive black hole (SMBH) in NGC 4593, we adopted the methodology outlined in Smith et al. (2021), which relies on the correlation between the SMBH mass and the rotation of its host galaxy using molecular gas kinematics. The relationship is described by the following equation:
![Mathematical equation: $$ \begin{aligned} \log \left(\frac{M_{\mathrm{BH} }}{M_{\odot }}\right) = (7.5 \pm 0.1) + (8.5 \pm 0.9) \left[\log \left(\frac{W_{50}}{\sin i}\,\mathrm{km\,s}^{-1}\right) - 2.7\right], \end{aligned} $$](/articles/aa/full_html/2024/11/aa51185-24/aa51185-24-eq9.gif) (5)
(5)
where MBH represents the central SMBH mass, W50 denotes the full width at half-maximum of a double-peaked CO(2−1) emission line profile, and i is the inclination of the CO disc. This relationship exhibits a total scatter of 0.6 dex, comparable to other SMBH mass correlations, which have an intrinsic scatter of 0.5 dex.
For our analysis, we derived the line width at half-maximum, W50, by employing the method described by Tiley et al. (2016) for measuring the line width of double-peaked profiles. This approach involves fitting a Gaussian double-peak profile to the emission-line data. As demonstrated in Fig. 9, we utilised a double-peak Gaussian function to accurately fit the integrated CO(2−1) emission-line spectrum, representing the observed emission profile from the entire field of view (FOV) as obtained from our 3D-BAROLO modelling. The W50 value was determined using the formula  , where w is the velocity half-width at half-maximum (HWHM) and σ is the velocity width of the Gaussian peaks. From this analysis, we obtained W50 ≃ 314 ± 10 km/s, and the inclination was derived as i ≃ 47.70° ±1.1, as depicted in Fig. 8.
Combining these measurements, we calculated the SMBH mass as  . This result was compared with the values obtained from the WISDOM project for NGC 4593 (Tiley et al. 2016), yielding
  , and with Denney et al. (2006), who derived an SMBH mass of approximately
  using reverberation mapping.
4.4. Evidence of non-circular motion and molecular inflow or outflows
Our analysis using 3D-BAROLO on NGC 4593 reveals significant dynamics within the galaxy’s gas structure. The CO gas distribution exhibits a one-arm structure, indicative of an m = 1 density wave or perturbation. Such a feature, rare in the nuclear regions of barred galaxies, suggests a dominant regular velocity field, implying limited non-circular motion. However, the presence of this m = 1 feature challenges the axisymmetric assumptions inherent in the 3D-BAROLO models. The discrepancy in the fit between the galaxy’s northern and southern sections highlights the limitations of current models in fully capturing the kinematic complexity. This aspect aligns with observations by Barbosa et al. (2006) regarding ionised gas kinematics, offering a broader comparative perspective on gas dynamics in barred galaxies.
The observed CO ring (inner) near the centre of the bar shows a complex interplay between bar dynamics and molecular gas distribution. The kinematic position angle (PA) of approximately −59.3° in the nuclear disc significantly differs from the morphological PA of 46°, suggesting that the ring has an elliptical structure with elongated stellar and gas orbits. This discrepancy likely indicates non-circular motions within the nuclear region, possibly driven by the influence of the central bar or other asymmetries in the gravitational potential. The inner structure of NGC 4593 is intricately shaped by its AGN, which exerts considerable influence on both the light profile and the dynamics of the central region, as demonstrated by Gadotti (2008). The poor fit in the nuclear region may reflect the limitations of the current kinematic model, which assumes axisymmetric conditions that may not fully capture the complexities of the actual orbital dynamics.
Adding to this complexity, the misalignment between its bar and bulge, alongside the presence of a pseudobulge identified through Ks-band surface photometry (Kormendy et al. 2006), suggests a deviation from the standard evolutionary path driven by secular processes and bar-driven gas inflows (Sanders et al. 2022). Furthermore, the central region is characterised by a nuclear dust ring linked to radial dust lanes, indicating active gas inflow and potential starburst activity, which could significantly impact the pseudobulge’s development. The dynamic evolution of this region is further influenced by a non-axisymmetric bar potential, which alters gas dynamics and morphological structures, marking a critical phase in the galaxy’s evolution.
Residuals from the 3D-BAROLO modelling on velocity dispersion maps (Fig. 4) further support our findings by highlighting regions of excess velocity dispersion. These residuals, unaccounted for by the model, suggest additional kinematic components like turbulence or unresolved inflows (or outflows). Fig. 9 illustrates the CO(2−1) mean velocity map and the residuals between the observed and modelled data using 3D-BAROLO. The dashed red circle (region a), located about 2″ to 3″ northeast of the galaxy’s centre, highlights an area with non-circular motion likely caused by inflows or outflows of cold molecular gas. This region, visible in the velocity map, contributes approximately 10% of the galaxy’s total flux, with about half of this flux seen in the residuals, indicating that around 5% of the total flux is linked to non-circular motion. The estimated gas mass in this area is between (0.5 − 2.5)×107 M⊙.
We must consider that some of these residuals may be associated with extraplanar gas, often extending several kiloparsecs above the disc in spiral galaxies (e.g., Fraternali et al. 2002; Li et al. 2021). However, given the low inclination of NGC 4593, distinguishing non-circular motions within the plane of the disc from potential outflows in the perpendicular direction is challenging. The residuals observed in our analysis are relatively small and appear consistent with non-circular motions in the plane, rather than significant extraplanar outflows. If these were true outflows, we would expect velocities much larger than the observed rotational velocity (Marasco et al. 2019). Additionally, extraplanar gas in other galaxies, such as the Milky Way, tends to be mostly atomic, have low densities, and constitute a small fraction of the total mass (typically less than 15%) (Söding et al. 2024). Furthermore, the global SFR in NGC 4593 does not suggest a strong star-formation-driven outflow, and the galaxy does not reside in a particularly crowded environment that would indicate gas stripping or strong interactions (Kormendy et al. 2006).
Therefore, while we cannot completely rule out the presence of extraplanar gas, it is unlikely to be a significant factor in the observed kinematics of NGC 4593. The presence of this excess gas flux in the residuals suggests an inflow or outflow of molecular gas. Moreover, the bump in rotation velocity, radial velocity, surface density, and velocity dispersion for the same radius away from the centre, observed in the 3D-BAROLO results (see Fig. 8), provides further evidence of this non-circular motion. The rotation velocity shows a noticeable rise and fall in the region, indicative of local perturbations. The radial velocity profile demonstrates deviations from the symmetric field expected for purely circular motions, suggesting inflow or outflow dynamics. An excess in surface density corresponds with the region, consistent with molecular gas accumulation. Finally, an increase in velocity dispersion in this region highlights the disturbed nature of the molecular gas. These characteristics, combined with the residual analysis, confirm the presence of non-circular motion and molecular inflows or outflows. The observed inflows or outflows and perturbations challenge the axisymmetric assumptions in the 3D-BAROLO models and underline the importance of non-axisymmetric bar potentials in shaping gas dynamics.
4.5. Central molecular zone (CMZ) ring
The CMZ is a dense, gas-rich region typically found in the innermost few hundred parsecs of galaxies, characterised by intense star formation and dynamic activity influenced by the gravitational effects of the galactic bar and potential AGN activity (Morris et al. 1983; Bally et al. 1987). Understanding the CMZ is crucial for studying galactic evolution due to its high concentration of molecular gas and its role as a central engine driving various dynamic processes.
Inflows of molecular gas, driven by bar-induced gravitational torques, funnel material into the CMZ, creating high-density molecular rings. These inflows are significant as they can enhance star formation rates (SFRs), fuel AGN activity, and drive turbulence within the CMZ. The interaction between inflowing gas and the central black hole (BH) can lead to episodic accretion events, contributing to AGN feedback mechanisms that regulate the growth and activity of the BH (Sormani & Barnes 2019; Hatchfield et al. 2021; Tress et al. 2024).
Our analysis suggests the presence of a CMZ-like ring in the innermost region of NGC 4593 (see Fig. 9). The bar of the galaxy, with a length of approximately 35″ (Mulchaey & Regan 1997), aligns in such a way that it channels molecular gas into the CMZ-like ring through shocks and streaming motions. These patterns are consistent with bar-driven inflow mechanisms observed in other barred galaxies (Athanassoula 1992). The CMZ-like ring, with its high concentration of molecular gas, could play a crucial role in the galaxy’s evolution, potentially influencing SFRs, AGN activity, and the overall dynamical state of the galaxy (Armillotta et al. 2020; Torii et al. 2013).
We estimate that the CMZ-like ring, located in the central region with a radius of about 2″, accounts for approximately 20% of the total molecular gas mass in NGC 4593, translating to a mass range of ∼0.2 − 1.0 × 10⁸ M⊙. The surface density of molecular gas in this CMZ-like ring is estimated to be in the range of Σ ∼ 0.26 − 0.34 Jy km/s, which is significantly higher than the average surface density of molecular gas across the entire galaxy, estimated at Σ ∼ 0.10 − 0.14 Jy km/s. This suggests that the surface density in the CMZ-like ring is about 2.5 times higher than the galaxy-wide average.
The velocity structure of the ring reveals strong rotational motion with signs of non-circular streaming inflow, potentially driven by bar-induced mechanisms. By examining the residual velocity field from our model, we observe significant residuals in the central region of the galaxy. The residual velocity profile indicates an inflow or outflow pattern that is perpendicular to the overall velocity map of the galaxy. Furthermore, most of these residuals at the centre are positive, suggesting an inflow of gas towards the nucleus.
4.6. The spectral energy distribution
To characterise galaxies and gain insights into their basic constituents, decomposing their spectral energy distributions (SEDs) into various components is a standard approach. We employed the Code Investigating GALaxy Emission (CIGALE; Boquien et al. 2019; Yang et al. 2020, 2022) to plot and analyse the SED of NGC 4593. The photometry data, including observations and corresponding error bars used as inputs for CIGALE, are reported in Table 3. For modelling the star formation history, we used a “delayed” model, characterised by a gradual rise of the star formation rate (SFR) to a maximum, followed by an exponential decline. This model can also accommodate an exponential burst to simulate a recent episode of star formation.
For the Stellar Population Synthesis, we utilised a Single Stellar Population (SSP) as defined in Bruzual & Charlot (2003), incorporating a Chabrier Initial Mass Function, a metallicity of 0.02, and a separation age of 10 Myr. Dust attenuation was modelled using the attenuation modules from Calzetti et al. (2000) and Leitherer et al. (2002), while the dust emission parameters were based on the models by Dale et al. (2014). In addition, CIGALE allows for the inclusion of AGN emission in the SED. We employed a two-phase torus model for the AGN component, as described by Stalevski et al. (2016), and linked the X-ray and UV/optical emissions of the AGN using the  relation (Just et al. 2007), with a maximum deviation of |Δαox|max = 0.2 to account for intrinsic scatter.
Initial conditions for our object were set as a face-on type-1 AGN, following the methodology outlined by Mountrichas et al. (2021) and Ciesla et al. (2015), who investigated type-1 and type-2 AGNs using CIGALE. Parameters such as inclination and other model settings were primarily derived from the 3D-BAROLO results presented in Section 3, while other initial conditions were allowed greater flexibility to improve the fit. This approach, while computationally demanding, yielded more precise fitting results.
The resulting SED fit, shown in Fig. 10, represents the best-fitting model obtained with CIGALE based on our initial conditions and photometric data. For the AGN component, specific parameters in the torus model were chosen, including an outer-to-inner radius ratio (Rout/Rin) of 20, with possible values ranging from 10 to 30. The half-opening angle was selected based on the type-1 AGN perspective, and the inclination angle was derived from the position angle (PA) of the source (see Table 1 for detailed parameter values). Although the alignment between the galaxy disc and torus may not be perfect, we assumed a standard inclination angle for consistency. Dust density gradients were set to 1.0 for both polar angle and radial direction, ensuring a comprehensive representation of the dust distribution.
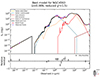 |
Fig. 10. SED of NGC 4593 derived using the CIGALE software. The plot shows the observed SED, indicated by red points, compared to the best-fit model represented by the solid black line. The constituent components of the model are illustrated as follows: dust emission (red line), AGN emission (orange line), and stellar emission, both attenuated (yellow dashed line) and unattenuated (blue dashed line). The vertical axis denotes the flux density Sν in mJy, while the horizontal axis represents the wavelength λ in μm. This SED plot provides a comprehensive view of the various emission components contributing to the observed radiation from NGC 4593. |
The power-law index δ, modifying the optical slope of the disc, was set to −0.36, with an average edge-on optical depth at 9.7 μm of 4.37 ± 0.93. These parameters indicate a prominent dusty torus structure around the AGN, aligned with the direct line of sight to the bright accretion disc and central engine, thus confirming the type-1 classification of NGC 4593. Based on this model, the AGN fraction (the ratio of AGN luminosity to total FIR luminosity) was determined to be 0.876 ± 0.052, underscoring the significant impact of the AGN on the SED and its influence on the galaxy’s overall spectrum. Detailed results derived by CIGALE are provided in Table 4.
CIGALE-derived parameters for NGC 4593.
NGC 4593 is classified as a late-type barred spiral (SB) galaxy hosting a type-1 AGN. Its bolometric luminosity (log(Lbol) = 44.163) and the substantial AGN contribution to the overall spectrum indicate a dominant AGN influence. Bright AGNs often exhibit complex interactions between SFRs and AGN luminosity, with various studies suggesting diverse relationships (Fanidakis et al. 2012; Gutcke et al. 2015). The AGN disc luminosity (1.26 × 1036 erg/s) and intrinsic 2−10 keV luminosity (Lν, 2 keV = 1.11 × 10¹⁸ erg/s) support the presence of a powerful central black hole ( ).
).
Despite the strong AGN activity, the galaxy’s SFR remains moderate. Using CIGALE, we derived an SFR of 0.43 M⊙ yr−1 and a stellar mass of log(M*/M⊙) = 10.646, consistent with previous studies. The SFR calculated from the PAH 11.25 μm emission (Mordini et al. 2021) is 0.36 M⊙/yr, while that from the [CII]158 μm line (Fernández-Ontiveros et al. 2020) is 0.19 M⊙/yr. In contrast, the total FIR luminosity estimate (Kennicutt 1998) provides a higher SFR of 1.2 M⊙/yr, using the log(FIR) luminosity from Spinoglio et al. (1995) of 43.43. The specific star formation rate (sSFR) of 4.4 × 10⁻¹¹ yr−1 indicates significant star-forming activity relative to its stellar mass, possibly influenced by AGN feedback mechanisms.
NGC 4593 is positioned near the threshold between high-luminosity AGNs (with log10(LAGN)≳44) and lower-luminosity AGNs. High-luminosity AGNs tend to show a strong positive correlation between SFR and LAGN, whereas lower-luminosity AGNs may exhibit a mildly negative correlation (Rosario et al. 2013). However, studies such as those by Pitchford et al. (2016) and Hatziminaoglou et al. (2018) indicate that AGN luminosity and SFR are not always strongly correlated, with some FIR-bright AGNs displaying signs of companions or mergers.
Our findings place NGC 4593 within the high-luminosity AGN regime. The AGN fraction relative to the IR luminosity is 0.87, and its bolometric luminosity exceeds 1044 erg/s, highlighting the dominance of AGN activity in its SED. While this dominance indicates a significant AGN contribution to the galaxy’s IR emission, it does not imply a straightforward correlation between AGN luminosity and star formation processes. This result suggests that while AGN activity significantly influences the galaxy’s infrared emission, it may not directly drive star formation.
According to Zhuang & Ho (2023), AGNs and their host galaxies evolve along specific trajectories on the black hole mass (MBH) versus stellar mass (M*) plane. Galaxies above the MBH − M* relation typically grow horizontally with substantial stellar mass increases, while those on the relation evolve proportionally in both MBH and M*. Our analysis reveals that NGC 4593 aligns with this “horizontal path”, suggesting that radiative-mode feedback cannot fully suppress star formation in such AGNs, and kinetic-mode feedback is insufficient to halt long-term star formation. The high AGN fraction and substantial stellar mass growth support the conclusion that radiative-mode feedback does not effectively constrain star formation in NGC 4593.
4.7. Challenges in kinematic modelling
Our analysis reveals a significant challenge in modelling the dynamics of NGC 4593 due to the clear presence of an m = 1 feature, which indicates lopsidedness that the 3D-BAROLO model, which imposes axisymmetry, struggles to account for. This discrepancy suggests potential variations in fits between the northern and southern regions of the galaxy, which the model cannot adequately address. The proximity of the bar’s PA to the kinematic PA complicates the determination of true inclinations, potentially leading to systematic biases, especially in the presence of an outer ring, which is rarely circular. The assumption of circular orbits by 3D-BAROLO, when the orbits may actually be elongated, introduces further inaccuracies in the modelled inclination and fails to capture the lack of a velocity gradient in the modelled PV diagrams. Consequently, the radial velocities predicted by 3D-BAROLO cannot accurately reproduce the observed elongated orbits, as they assume isotropic motion, overlooking the complexities of elliptical orbits that do not conform to simple inflow or outflow patterns.
A critical limitation in our modelling is that the CO(2−1) line does not represent the entire molecular gas content, and relying solely on it could lead to an underestimation of the total molecular gas mass. Furthermore, the interferometric observations used in this study filter out extended emissions, resulting in missing flux, suggesting that the actual molecular gas mass could be higher than our model predicts.
This missing flux is particularly important in regions with significant non-circular motions, such as the areas affected by the bar and spiral arms, where the model’s limitations in capturing the full extent of gas dynamics are most evident. Additionally, the 3D-BAROLO model, with its inherent assumption of axisymmetry, cannot capture the entire molecular gas distribution, leading to the omission of the single arm of the galaxy in our analysis. This limitation underscores the need for a more comprehensive modelling approach to fully understand the gas dynamics in NGC 4593.
5. Summary and conclusions
We used CO(2−1) observations from ALMA to study the kinematics and morphology of molecular gas in the Seyfert 1 AGN galaxy NGC 4593, which is a barred spiral galaxy. For this work, we used 3D-BAROLO and DISCFIT to analyse the gas kinematics and morphology. Additionally, we utilised multi-wavelength data to construct the SED of the galaxy using CIGALE. Our analysis revealed that the molecular gas mass in NGC 4593 is in the range 1.0 ∼ 5.0 × 10⁸ M⊙, derived from the CO(1−0) line luminosity from the CO(2−1) using an excitation factor typical of active galaxies (Kamenetzky et al. 2016).
The gas distribution exhibits a one-arm structure, indicative of an m = 1 density wave or perturbation. Such a feature, rare in the nuclear regions of barred galaxies, suggests a dominant regular velocity field, implying limited non-circular motion. Yet, the evident m = 1 feature challenges the axisymmetry assumptions inherent in the 3D-BAROLO models.
The mass of the central SMBH was estimated based on the relationship between the CO line width (W50) and SMBH mass. Our analysis yielded a BH mass of  , which aligns with previous estimates from reverberation mapping.
In the region about 2″ to 3″ (∼220 pc) northeast of the galaxy centre (see Fig. 9), we identified significant non-circular motion likely due to molecular gas outflow. This region contains between (0.5 − 2.5)×107 M⊙ of gas, representing roughly 10% of the total galaxy flux. Perturbations in rotation velocity, radial velocity, surface density, and velocity dispersion confirm the presence of significant non-circular motion and molecular outflows. These findings align with observations by Barbosa et al. (2006), who noted similar perturbations in ionised gas kinematics.
The inner structure of NGC 4593 appears to be shaped by a CMZ-like ring in the innermost region of the galaxy. This ring, which could account for up to 20% of the total molecular gas mass, exhibits strong rotational motion with signs of non-circular inflow patterns. The bar-driven inflow mechanisms channel molecular gas into this CMZ-like ring, thereby affecting star formation and AGN activity in the central region. This prominent bar structure significantly influences the gas dynamics.
The SED fitting using CIGALE confirmed the presence of a strong AGN component in NGC 4593. The AGN fraction to IR luminosity is 0.87, underscoring the significant impact of the AGN on the galaxy’s overall spectrum. The inferred star formation rate is not large, which might suggest the suppression of star formation processes because of AGN quenching. NGC 4593 fits well within the high-luminosity AGN regime, with a bolometric luminosity above 1044 erg/s. The galaxy’s stellar mass growth suggests that radiative-mode feedback is ineffective in fully suppressing star formation. Instead, the AGN activity remains tightly linked with star formation, consistent with the coevolution trajectory outlined by Zhuang & Ho (2023).
NGC 4593 exhibits complex gas dynamics due to the interplay between bar dynamics and AGN activity. The presence of a CMZ-like ring and significant molecular outflows highlight the impact of non-axisymmetric bar potentials on shaping gas dynamics.
Acknowledgments
It is with profound sadness we note the passing of our esteemed colleague, M. Malheiro, who made significant contributions to this work. This paper makes use of data from ALMA program ADS/JAO.ALMA#2017.1.00236.S and ADS/JAO.ALMA#2018.1.00576.S. ALMA is a partnership of ESO (representing its member states), NSF (USA) and NINS (Japan), together with NRC (Canada) and NSTC and ASIAA (Taiwan) and KASI (Republic of Korea), in cooperation with the Republic of Chile. The Joint ALMA Observatory is operated by ESO, AUI/NRAO and NAOJ. KK acknowledges the support of the European Southern Observatory (ESO) through the SSDF grant, which facilitated a visit to ESO contributing to this work. CR acknowledges support from Fondecyt Regular grant 1230345 and ANID BASAL project FB210003. JAFO acknowledges financial support by the Spanish Ministry of Science and Innovation (MCIN/AEI/10.13039/501100011033), by “ERDF A way of making Europe” and by “European Union NextGenerationEU/PRTR” through the grants PID2021-124918NB-C44 and CNS2023-145339; MCIN and the European Union – NextGenerationEU through the Recovery and Resilience Facility project ICTS-MRR-2021-03-CEFCA. MPS acknowledges support from grants RYC2021-033094-I and CNS2023-145506 funded by MCIN/AEI/10.13039/501100011033 and the European Union NextGenerationEU/PRTR. PA warmly thanks the Department of Physics, Section of Astrophysics, Astronomy and Mechanics of the Aristotle University of Thessaloniki (Greece), the Institute of Theoretical Astrophysics, University of Oslo (Norway), and the Fukui University of technology, Fukui (Japan) for their hospitality when part of this work was written.
References
- Andreani, P., Retana-Montenegro, E., Zhang, Z.-Y., et al. 2018, A&A, 615, A142 [NASA ADS] [CrossRef] [EDP Sciences] [Google Scholar]
- Ann, H., & Thakur, P. 2005, ApJ, 620, 197 [NASA ADS] [CrossRef] [Google Scholar]
- Antonucci, R., & Miller, J. 1985, AJ, 297, 621 [NASA ADS] [Google Scholar]
- Arakawa, N., Fabian, A., Ferland, G., & Ishibashi, W. 2022, MNRAS, 517, 5069 [NASA ADS] [CrossRef] [Google Scholar]
- Armillotta, L., Krumholz, M. R., & Di Teodoro, E. M. 2020, MNRAS, 493, 5273 [NASA ADS] [CrossRef] [Google Scholar]
- Asmus, D., Hönig, S., Gandhi, P., Smette, A., & Duschl, W. 2014, MNRAS, 439, 1648 [NASA ADS] [CrossRef] [Google Scholar]
- Athanassoula, E. 1992, MNRAS, 259, 345 [Google Scholar]
- Atlee, D. W., Martini, P., Assef, R. J., Kelson, D. D., & Mulchaey, J. S. 2011, ApJ, 729, 22 [NASA ADS] [CrossRef] [Google Scholar]
- Bally, J., Stark, A. A., Wilson, R. W., & Henkel, C. 1987, ApJS, 65, 13 [Google Scholar]
- Barbosa, F. K. B., Storchi-Bergmann, T., Fernandes, R. C., Winge, C., & Schmitt, H. 2006, MNRAS, 371, 170 [NASA ADS] [CrossRef] [Google Scholar]
- Bean, B., Bhatnagar, S., Castro, S., et al. 2022, PASP, 134, 114501 [NASA ADS] [CrossRef] [Google Scholar]
- Bewketu Belete, A., Andreani, P., Fernández-Ontiveros, J. A., et al. 2021, A&A, 654, A24 [NASA ADS] [CrossRef] [EDP Sciences] [Google Scholar]
- Bolatto, A. D., Wolfire, M., & Leroy, A. K. 2013, ARA&A, 51, 207 [CrossRef] [Google Scholar]
- Boquien, M., Burgarella, D., Roehlly, Y., et al. 2019, A&A, 622, A103 [NASA ADS] [CrossRef] [EDP Sciences] [Google Scholar]
- Bouquin, A. Y., de Paz, A. G., Muñoz-Mateos, J. C., et al. 2018, ApJS, 234, 18 [NASA ADS] [CrossRef] [Google Scholar]
- Brusa, M. 2017, Workshop sull’Astronomia Millimetrica in Italia, 24 [Google Scholar]
- Bruzual, G., & Charlot, S. 2003, MNRAS, 344, 1000 [NASA ADS] [CrossRef] [Google Scholar]
- Cackett, E. 2019, AAS/High Energy Astrophysics Division, 17, 106 [NASA ADS] [Google Scholar]
- Cackett, E. M., Chiang, C.-Y., McHardy, I., et al. 2018, ApJ, 857, 53 [NASA ADS] [CrossRef] [Google Scholar]
- Calzetti, D., Armus, L., Bohlin, R. C., et al. 2000, ApJ, 533, 682 [NASA ADS] [CrossRef] [Google Scholar]
- Cicone, C., Maiolino, R., Sturm, E., et al. 2014, A&A, 562, A21 [NASA ADS] [CrossRef] [EDP Sciences] [Google Scholar]
- Ciesla, L., Charmandaris, V., Georgakakis, A., et al. 2015, A&A, 576, A10 [NASA ADS] [CrossRef] [EDP Sciences] [Google Scholar]
- Combes, F. 2017, Front. Astron. Space Sci., 4, 10 [NASA ADS] [CrossRef] [Google Scholar]
- Contini, T., Considere, S., & Davoust, E. 1998, A&AS, 130, 285 [NASA ADS] [CrossRef] [EDP Sciences] [Google Scholar]
- Contursi, A., Poglitsch, A., Carpio, J. G., et al. 2013, A&A, 549, A118 [NASA ADS] [CrossRef] [EDP Sciences] [Google Scholar]
- Cutri, R., Wright, E., & Conrow, T. 2012, Explanatory Supplement to the WISE All-Sky Data Release Products, 1 [Google Scholar]
- Dale, D. A., Helou, G., Magdis, G. E., et al. 2014, ApJ, 784, 83 [Google Scholar]
- Davis, T. A., Alatalo, K., Bureau, M., et al. 2013, MNRAS, 429, 534 [Google Scholar]
- de Vaucouleurs, G., de Vaucouleurs, A., Corwin, J., et al. 1991, Third Reference Catalogue of Bright Galaxies (New York: Springer-Verlag) [Google Scholar]
- De Vaucouleurs, G., de Vaucouleurs, A., Harold, G., et al. 2013, Third Reference Catalogue of Bright Galaxies: Volume III (Springer Science& Business Media) [Google Scholar]
- den Brok, M., Carollo, C. M., Erroz-Ferrer, S., et al. 2020, MNRAS, 491, 4089 [NASA ADS] [Google Scholar]
- Denney, K. D., Bentz, M. C., Peterson, B. M., et al. 2006, ApJ, 653, 152 [NASA ADS] [CrossRef] [Google Scholar]
- Di Teodoro, E., & Fraternali, F. 2015, Astrophysics Source Code Library [record ascl:1507.001] [Google Scholar]
- Esposito, F., Vallini, L., Pozzi, F., et al. 2022, MNRAS, 512, 686 [NASA ADS] [CrossRef] [Google Scholar]
- Fabian, A. C. 2012, ARA&A, 50, 455 [Google Scholar]
- Fanidakis, N., Baugh, C., Benson, A., et al. 2012, MNRAS, 419, 2797 [NASA ADS] [CrossRef] [Google Scholar]
- Fernández-Ontiveros, J. A., Spinoglio, L., Pereira-Santaella, M., et al. 2016, ApJS, 226, 19 [CrossRef] [Google Scholar]
- Fernández-Ontiveros, J. A., Dasyra, K. M., Hatziminaoglou, E., et al. 2020, A&A, 633, A127 [Google Scholar]
- Feruglio, C., Maiolino, R., Piconcelli, E., et al. 2010, A&A, 518, L155 [NASA ADS] [CrossRef] [EDP Sciences] [Google Scholar]
- Fiore, F., Feruglio, C., Shankar, F., et al. 2017, A&A, 601, A143 [NASA ADS] [CrossRef] [EDP Sciences] [Google Scholar]
- Fluetsch, A., Maiolino, R., Carniani, S., et al. 2019, MNRAS, 483, 4586 [NASA ADS] [Google Scholar]
- Fraternali, F., van Moorsel, G., Sancisi, R., & Oosterloo, T. 2002, AJ, 123, 3124 [CrossRef] [Google Scholar]
- Gadotti, D. A. 2008, MNRAS, 384, 420 [Google Scholar]
- Gaspari, M., Tombesi, F., & Cappi, M. 2020, Nat. Astron., 4, 10 [Google Scholar]
- Girdhar, A., Harrison, C., Mainieri, V., et al. 2022, MNRAS, 512, 1608 [NASA ADS] [CrossRef] [Google Scholar]
- Gitti, M., Brighenti, F., & McNamara, B. R. 2012, Adv. Astron., 2012, 1 [CrossRef] [Google Scholar]
- Gutcke, T. A., Fanidakis, N., & Macciò, A. V. 2015, MNRAS, 451, 3759 [NASA ADS] [CrossRef] [Google Scholar]
- Harrison, C. 2013, IAU Proc., 9, 284 [CrossRef] [Google Scholar]
- Harrison, C. 2017, Nat. Astron., 1, 0165 [NASA ADS] [CrossRef] [Google Scholar]
- Hatchfield, H. P., Sormani, M. C., Tress, R. G., et al. 2021, ApJ, 922, 79 [NASA ADS] [CrossRef] [Google Scholar]
- Hatziminaoglou, E., Omont, A., Stevens, J., et al. 2010, A&A, 518, L33 [NASA ADS] [CrossRef] [EDP Sciences] [Google Scholar]
- Hatziminaoglou, E., Farrah, D., Humphreys, E., et al. 2018, MNRAS, 480, 4974 [Google Scholar]
- Heckman, T. M., Kauffmann, G., Brinchmann, J., et al. 2004, ApJ, 613, 109 [Google Scholar]
- Hensley, B. S., Ostriker, J. P., & Ciotti, L. 2014, ApJ, 789, 78 [NASA ADS] [CrossRef] [Google Scholar]
- Hickox, R. C., & Alexander, D. M. 2018, ARA&A, 56, 625 [Google Scholar]
- Hopkins, P. F., Hernquist, L., Cox, T. J., et al. 2005, ApJ, 630, 705 [NASA ADS] [CrossRef] [Google Scholar]
- Hopkins, P. F., Quataert, E., & Murray, N. 2012, MNRAS, 421, 3522 [Google Scholar]
- Horst, H., Smette, A., Gandhi, P., & Duschl, W. 2006, A&A, 457, L17 [NASA ADS] [CrossRef] [EDP Sciences] [Google Scholar]
- Horst, H., Gandhi, P., Smette, A., & Duschl, W. J. 2008, A&A, 479, 389 [NASA ADS] [CrossRef] [EDP Sciences] [Google Scholar]
- Horst, H., Duschl, W. J., Gandhi, P., & Smette, A. 2009, A&A, 495, 137 [NASA ADS] [CrossRef] [EDP Sciences] [Google Scholar]
- Hunt, L. K., Combes, F., García-Burillo, S., et al. 2008, A&A, 482, 133 [NASA ADS] [CrossRef] [EDP Sciences] [Google Scholar]
- Ishibashi, W., & Fabian, A. C. 2015, MNRAS, 451, 93 [NASA ADS] [CrossRef] [Google Scholar]
- Jarrett, T., Chester, T., Cutri, R., Schneider, S., & Huchra, J. 2003, AJ, 125, 525 [NASA ADS] [CrossRef] [Google Scholar]
- Just, D. W., Brandt, W., Shemmer, O., et al. 2007, ApJ, 665, 1004 [NASA ADS] [CrossRef] [Google Scholar]
- Kamenetzky, J., Rangwala, N., Glenn, J., Maloney, P., & Conley, A. 2016, ApJ, 829, 93 [NASA ADS] [CrossRef] [Google Scholar]
- Kamenetzky, J., Privon, G., & Narayanan, D. 2018, ApJ, 859, 9 [NASA ADS] [CrossRef] [Google Scholar]
- Kammoun, E., Papadakis, I., & Dovčiak, M. 2021, MNRAS, 503, 4163 [CrossRef] [Google Scholar]
- Karouzos, M., Im, M., Trichas, M., et al. 2014, ApJ, 784, 137 [NASA ADS] [CrossRef] [Google Scholar]
- Kauffmann, G., & Haehnelt, M. 2000, MNRAS, 311, 576 [Google Scholar]
- Kennicutt, R. C. 1998, ApJ, 498, 541 [NASA ADS] [CrossRef] [Google Scholar]
- Kormendy, J., Cornell, M. E., Block, D. L., Knapen, J. H., & Allard, E. L. 2006, ApJ, 642, 765 [NASA ADS] [CrossRef] [Google Scholar]
- Koss, M. J., Strittmatter, B., Lamperti, I., et al. 2021, ApJS, 252, 29 [CrossRef] [Google Scholar]
- Kumari, K., Dewangan, G., Papadakis, I., et al. 2023, MNRAS, 521, 4109 [NASA ADS] [CrossRef] [Google Scholar]
- Laine, S. 2001, Ap&SS, 276, 667 [NASA ADS] [CrossRef] [Google Scholar]
- Leitherer, C., Calzetti, D., & Martins, L. P. 2002, ApJ, 574, 114 [NASA ADS] [CrossRef] [Google Scholar]
- Li, A., Marasco, A., Fraternali, F., Trager, S., & Verheijen, M. A. 2021, MNRAS, 504, 3013 [NASA ADS] [CrossRef] [Google Scholar]
- Lutz, D., Sturm, E., Janssen, A., et al. 2020, A&A, 633, A134 [NASA ADS] [CrossRef] [EDP Sciences] [Google Scholar]
- Malkan, M. A., Gorjian, V., & Tam, R. 1998, ApJS, 117, 25 [Google Scholar]
- Marasco, A., Fraternali, F., Heald, G., et al. 2019, A&A, 631, A50 [NASA ADS] [CrossRef] [EDP Sciences] [Google Scholar]
- Marinova, I., & Jogee, S. 2007, ApJ, 659, 1176 [Google Scholar]
- McAlary, C. W., McLaren, R., McGonegal, R., & Maza, J. 1983, ApJS, 52, 341 [CrossRef] [Google Scholar]
- McNamara, B., & Nulsen, P. 2007, ARA&A, 45, 117 [NASA ADS] [CrossRef] [Google Scholar]
- Mordini, S., Spinoglio, L., & Fernández-Ontiveros, J. A. 2021, A&A, 653, A36 [NASA ADS] [CrossRef] [EDP Sciences] [Google Scholar]
- Morganti, R. 2017, Front. Astron. Space Sci., 4, 42 [CrossRef] [Google Scholar]
- Morris, M., Polish, N., Zuckerman, B., & Kaifu, N. 1983, AJ, 88, 1228 [NASA ADS] [CrossRef] [Google Scholar]
- Mountrichas, G., Buat, V., Georgantopoulos, I., et al. 2021, A&A, 653, A70 [NASA ADS] [CrossRef] [EDP Sciences] [Google Scholar]
- Mulchaey, J. S., & Regan, M. W. 1997, ApJ, 482, L135 [Google Scholar]
- Newman, S. F., Genzel, R., Förster-Schreiber, N. M., et al. 2012, ApJ, 761, 43 [Google Scholar]
- Papadopoulos, P. P., Van der Werf, P., Isaak, K., & Xilouris, E. M. 2010, ApJ, 715, 775 [NASA ADS] [CrossRef] [Google Scholar]
- Patra, N. N. 2020, A&A, 638, A66 [NASA ADS] [CrossRef] [EDP Sciences] [Google Scholar]
- Phookun, B., Vogel, S. N., & Mundy, L. G. 1993, ApJ, 418, 113 [NASA ADS] [CrossRef] [Google Scholar]
- Pier, E. A., & Krolik, J. H. 1992, ApJ, 401, 99 [Google Scholar]
- Pitchford, L., Hatziminaoglou, E., Feltre, A., et al. 2016, MNRAS, 462, 4067 [NASA ADS] [CrossRef] [Google Scholar]
- Ricci, C., Trakhtenbrot, B., Koss, M. J., et al. 2017a, Nature, 549, 488 [NASA ADS] [CrossRef] [Google Scholar]
- Ricci, C., Trakhtenbrot, B., Koss, M. J., et al. 2017b, ApJS, 233, 17 [Google Scholar]
- Ricci, C., Ananna, T. T., Temple, M. J., et al. 2022, ApJ, 938, 67 [NASA ADS] [CrossRef] [Google Scholar]
- Rosario, D., Santini, P., Lutz, D., et al. 2013, A&A, 560, A72 [NASA ADS] [CrossRef] [EDP Sciences] [Google Scholar]
- Rosario, D. J., Togi, A., Burtscher, L., et al. 2019, ApJ, 875, L8 [NASA ADS] [CrossRef] [Google Scholar]
- Rush, B., Malkan, M. A., & Spinoglio, L. 1993, ApJS, 89, 1 [NASA ADS] [CrossRef] [Google Scholar]
- Salomé, Q., Krongold, Y., Longinotti, A. L., et al. 2023, MNRAS, 524, 3130 [CrossRef] [Google Scholar]
- Sanders, J. L., Matsunaga, N., Kawata, D., et al. 2022, MNRAS, 517, 257 [CrossRef] [Google Scholar]
- Schawinski, K., Thomas, D., Sarzi, M., et al. 2007, MNRAS, 382, 1415 [Google Scholar]
- Schnorr-Müller, A., Storchi-Bergmann, T., Nagar, N. M., et al. 2014, MNRAS, 437, 1708 [Google Scholar]
- Schombert, J., McGaugh, S., & Lelli, F. 2019, MNRAS, 483, 1496 [NASA ADS] [Google Scholar]
- Shaw, M., Axon, D., Probst, R., & Gatley, I. 1995, MNRAS, 274, 369 [NASA ADS] [CrossRef] [Google Scholar]
- Silk, J., & Rees, M. J. 1998, A&A, 331, L1 [NASA ADS] [Google Scholar]
- Skrutskie, M., Cutri, R., Stiening, R., et al. 2006, AJ, 131, 1163 [Google Scholar]
- Smith, M. D., Bureau, M., Davis, T. A., et al. 2021, MNRAS, 500, 1933 [Google Scholar]
- Söding, L., Edenhofer, G., Enßlin, T. A., et al. 2024, A&A, submitted [Google Scholar]
- Solomon, P., & Vanden Bout, P. 2005, ARA&A, 43, 677 [Google Scholar]
- Sormani, M. C., & Barnes, A. T. 2019, MNRAS, 484, 1213 [NASA ADS] [CrossRef] [Google Scholar]
- Spekkens, K., & Sellwood, J. 2007, ApJ, 664, 204 [NASA ADS] [CrossRef] [Google Scholar]
- Spingola, C., McKean, J., Auger, M., et al. 2019, MNRAS, 482, 1247 [NASA ADS] [CrossRef] [Google Scholar]
- Spinoglio, L., Malkan, M. A., Rush, B., Carrasco, L., & Recillas-Cruz, E. 1995, ApJ, 453, 616 [NASA ADS] [CrossRef] [Google Scholar]
- Sriram, K., Agrawal, V., & Rao, A. 2009, ApJ, 700, 1042 [NASA ADS] [CrossRef] [Google Scholar]
- Stalevski, M., Ricci, C., Ueda, Y., et al. 2016, MNRAS, 458, 2288 [Google Scholar]
- Stuber, S. K., Saito, T., Schinnerer, E., et al. 2021, A&A, 653, A172 [NASA ADS] [CrossRef] [EDP Sciences] [Google Scholar]
- Sun, J., Leroy, A. K., Schruba, A., et al. 2018, ApJ, 860, 172 [NASA ADS] [CrossRef] [Google Scholar]
- Thakur, P., Ann, H., & Jiang, G. 2009, ApJ, 693, 586 [NASA ADS] [CrossRef] [Google Scholar]
- Tiley, A. L., Bureau, M., Saintonge, A., et al. 2016, MNRAS, 461, 3494 [NASA ADS] [CrossRef] [Google Scholar]
- Tombesi, F., Meléndez, M., Veilleux, S., et al. 2015, Nature, 519, 436 [NASA ADS] [CrossRef] [Google Scholar]
- Tommasin, S., Spinoglio, L., Malkan, M. A., & Fazio, G. 2010, ApJ, 709, 1257 [NASA ADS] [CrossRef] [Google Scholar]
- Torii, K., Enokiya, R., Fukui, Y., et al. 2013, IAU Proc., 9, 106 [CrossRef] [Google Scholar]
- Tress, R., Sormani, M., Girichidis, P., et al. 2024, A&A, in press, https://doi.org/10.1051/0004-6361/202450035 [Google Scholar]
- van der Werf, P. P., Isaak, K., Meijerink, R., et al. 2010, A&A, 518, L42 [NASA ADS] [CrossRef] [EDP Sciences] [Google Scholar]
- Veilleux, S., Maiolino, R., Bolatto, A. D., & Aalto, S. 2020, A&ARv, 28, 1 [NASA ADS] [CrossRef] [Google Scholar]
- Venanzi, M., Hönig, S., & Williamson, D. 2020, ApJ, 900, 174 [Google Scholar]
- Wang, Y., He, Z., Mao, J., et al. 2022, ApJ, 928, 7 [NASA ADS] [CrossRef] [Google Scholar]
- Weiß, A., Downes, D., Walter, F., & Henkel, C. 2005, A&A, 440, L45 [Google Scholar]
- Wu, Y.-T., Trejo, A., Espada, D., & Miyamoto, Y. 2021, MNRAS, 504, 3111 [NASA ADS] [CrossRef] [Google Scholar]
- Yang, G., Boquien, M., Buat, V., et al. 2020, MNRAS, 491, 740 [Google Scholar]
- Yang, G., Boquien, M., Brandt, W. N., et al. 2022, ApJ, 927, 192 [NASA ADS] [CrossRef] [Google Scholar]
- Zhuang, M.-Y., & Ho, L. C. 2023, ApJ, 945, 154 [NASA ADS] [CrossRef] [Google Scholar]
All Tables
All Figures
|
Fig. 1. Multi-wavelength observations of NGC 4593. Left: Background merged image from Hubble Space Telescope (HST) observations, combining data from the Wide Field Planetary Camera 2 (WFPC2) using the F606W filter and the F547M filter. The squared zoomed region highlights the inner galaxy, showing the AGN at its centre. Middle: Zoomed region of the HST image with contours from the ALMA CO (J = 2 − 1) emission line moment-0 map, illustrating the distribution and intensity of CO emission with contour levels of Contours = [0.25, 0.35, 0.4, 0.5, 1, 2, 4, 6]. Right: Digitized Sky Survey (DSS) image of the galaxy (Image credit: DSS, STScI). |
| In the text | |
|
Fig. 2. CO(2−1) moment maps from the ALMA Band 6 data cube of NGC 4593, created using CASA. Top left: Integrated intensity (moment-0 map) showing the spatial distribution of the line flux, with a total calculated flux of approximately 100 Jy km/s. The colour bar represents the intensity scale in Jy km/s per beam units. Top right: Intensity-weighted velocity (moment-1 map) with scale bar units in km/s, tracing gas velocities and kinematics within the galaxy. Bottom left: Intensity-weighted velocity dispersion (moment-2 map) with scale bar units in km/s. Bottom right: ALMA Band 6 continuum image (background) displaying the dust distribution, overlaid with CO(2−1) emission moment-0 map contours from ALMA observation Project ID: 2017.1.00236.S. |
| In the text | |
|
Fig. 4. Detailed intensity, velocity, and dispersion maps for the CO(2−1) emission in NGC 4593, developed using 3D-BAROLO software. The figure is divided into two panels: the left panel refers to the azimuthal normalised model, while the right one refers to the local normalised model. Each panel consists of a 3 × 3 grid of images (rows: intensity, velocity, dispersion; columns: data, model, residuals). The top row presents the CO(2−1) intensity maps across the field of view, with the colour bar representing the intensity scale in Jy km s−1 per beam units. The middle row shows the velocity maps, depicting the gas velocities across the field of view, with scale bar units in km/s. The bottom row displays the velocity dispersion of the CO(2−1) line across the field of view, also denoted in km/s. The left column in each panel shows the data, the middle column displays the model, and the right column provides the residuals. |
| In the text | |
|
Fig. 3. CO(2−1) channel maps from the ALMA B6 data cube, generated using 3D-BAROLO modelling, provide insight into the morphology and gas kinematics of NGC 4593. The channel maps display velocities ranging from −230 km/s (top left) to +156 km/s (bottom right), relative to the galaxy’s systemic velocity (vsys). This vsys is estimated as the central velocity in the global line profile, valued at 12.56 km/s. The velocities presented signify deviations from this systemic velocity. Maps are shown in increments of 10 km/s, and each square box covers an area of 8.58″. The top row displays selected channels in blue, while the middle and bottom rows depict maps normalised using the azimuthal and local normalisation methods, respectively, highlighting distinct patterns in the emission’s spatial distribution and intensity. A green cross in each panel marks the disc’s centre, and solid red lines represent the RMS noise level (σrms) of 0.7 mJy. |
| In the text | |
|
Fig. 5. Position-velocity (p − v) diagrams of the CO(2−1) emission in NGC 4593, extracted from the data and 3D-BAROLO model along the major (top panel) and minor (bottom panel) axes. Blue solid contours illustrate the p − v diagram derived from the data cube, while red solid contours depict the p − v diagram from the model cube. The contour levels for both data and model are set at [1, 2, 4, 8, 16, 32, 64]×l, with l = 0.0012. In the top panel, yellow solid dots represent the rotation velocity of each ring from the best-fit disc model. The dashed light green circle in the bottom panel highlights the region where a potential gas inflow or outflow is located. These p − v diagrams facilitate the investigation of the spatial and kinematic structure of the CO(2−1) emission in NGC 4593. |
| In the text | |
|
Fig. 6. CO(2−1) observed velocity field and corresponding residuals derived from DISCFIT modelling for NGC 4593. The left panel showcases the observed velocity field of the CO(2−1) emission, with the scale bar units given in km/s. The middle panel shows the residuals produced by subtracting the DISCFIT model from the observed data, with green contours representing levels of 5σrms. The bottom panel compares the rotation curve velocities (Vrot) obtained from both 3D-BAROLO and DISCFIT models, considering cases with and without radial velocity (Vrad). |
| In the text | |
|
Fig. 7. Comparison between the spiral arm widths and disc scale height as a function of radius in NGC 4593. The blue line represents the spiral arm widths, estimated from the observational data of CO(2−1) molecular gas. The red line shows the disc scale height, derived from 3D-BAROLO modelling. |
| In the text | |
|
Fig. 8. Kinematic and structural parameters of NGC 4593 as a function of radius. Top row, from left to right: Rotation Velocity (Vrot), Velocity Dispersion (σgas), and Surface Density (Σ). Bottom row, from left to right: Inclination Angle (i) showing the variation of inclination with radius, Position Angle (ϕ) illustrating the fluctuation of position angle with radius, and Radial Velocity (Vrad) displaying the radial velocity (km/s) versus radius, marked in grey. In each subplot, the observational data are represented by grey points with error bars. The fitted azimuthal normalisation with Vrad = 0 is depicted by an orange line with a dash-dot pattern, while the local normalisation series with Vrad = 0 is shown as a solid green line. The local normalisation with Vrad ≠ 0 is represented by a dashed red line, and the azimuthal normalisation with Vrad ≠ 0 is indicated by a dotted blue line. |
| In the text | |
|
Fig. 9. Analysis of molecular gas dynamics in NGC 4593. Top: Red-circled region (a) indicates potential non-circular motion due to the outflow of cold molecular gas, visible on the mean velocity map (background). The central dashed circle (region b) highlights the CMZ-like ring, which contains significant molecular gas. Bottom: Comparison between the CO(2−1) ALMA observations (green) and the 3D-BAROLO model (blue) for NGC 4593. The plot shows the average flux as a function of velocity, with residuals (orange) and possible outflowing gas from region (a) highlighted in red. |
| In the text | |
|
Fig. 10. SED of NGC 4593 derived using the CIGALE software. The plot shows the observed SED, indicated by red points, compared to the best-fit model represented by the solid black line. The constituent components of the model are illustrated as follows: dust emission (red line), AGN emission (orange line), and stellar emission, both attenuated (yellow dashed line) and unattenuated (blue dashed line). The vertical axis denotes the flux density Sν in mJy, while the horizontal axis represents the wavelength λ in μm. This SED plot provides a comprehensive view of the various emission components contributing to the observed radiation from NGC 4593. |
| In the text | |
Current usage metrics show cumulative count of Article Views (full-text article views including HTML views, PDF and ePub downloads, according to the available data) and Abstracts Views on Vision4Press platform.
Data correspond to usage on the plateform after 2015. The current usage metrics is available 48-96 hours after online publication and is updated daily on week days.
Initial download of the metrics may take a while.