| Issue |
A&A
Volume 690, October 2024
|
|
|---|---|---|
| Article Number | A277 | |
| Number of page(s) | 8 | |
| Section | Extragalactic astronomy | |
| DOI | https://doi.org/10.1051/0004-6361/202450076 | |
| Published online | 17 October 2024 | |
Gas flows in the central region of the Seyfert galaxy NGC 4593 with MUSE
1
Department of Physics, Technical University of Kenya, Nairobi, Kenya
2
Instituto de Astrofísica de Canarias, 38205 La Laguna, Tenerife, Spain
3
Departamento de Astrofísica, Universidad de La Laguna, 38206 Tenerife, Spain
4
Instituto de Física Fundamental, CSIC, Calle Serrano 123, 28006 Madrid, Spain
5
Department of Mathematical Sciences, University of South Africa, Cnr Christian de Wet Rd and Pioneer Avenue, Florida Park, 1709 Roodepoort, South Africa
Received:
22
March
2024
Accepted:
6
August
2024
Abstract
Context. Understanding how gas flows into galactic centres, fuels the active galactic nucleus (AGN), and is in turn expelled back through feedback processes is of great importance to appreciate the role AGN play in the growth and evolution of galaxies.
Aims. We use Multi Unit Spectroscopic Explorer-adaptive optics (MUSE-AO) optical spectra of the inner 7″.5 × 7″.5 (1.3 kpc × 1.3 kpc) of the nearby Seyfert 1 galaxy NGC 4593 to characterise its ionised gas kinematics.
Methods. We fitted single-Gaussian components to the [O III] λ5007 and [N II] λ6583 emission lines, and double-Gaussian components to Hα and Hβ to determine the main ionisation mechanism of the gas. To determine the kinematics of the ionised gas, we fit double-Gaussian components to the [O III] λ5007 line.
Results. The high angular resolution MUSE data (∼0″. 12 = 20 pc) capture structures of the circumnuclear region including the innermost spiral that feeds the nucleus. Based on the stellar kinematic maps, we confirm the presence of a rotating disc, whilst for the ionised gas, we find high-velocity dispersion values of up to 200 − 250 km s−1 that show that part of the gas is highly perturbed. The dominant ionisation mechanism of the gas is AGN photoionisation, which reaches the highest values within the innermost 4″ (680 pc) diameter of the galaxy. At larger radii, the emission line ratios correspond to values in the composite region of the Baldwin, Phillips and Terlevich (BPT) diagram.
Conclusions. The broad-component of [O III] λ5007 shows blue-shifted velocities on the east side of the central 2″ (340 pc), which spatially coincide with a region of high velocity-dispersion. This confirms the presence of outflowing gas. We estimate a mass outflow rate and kinetic power of Ṁ ≥ 0.048 M⊙ yr−1 and Ėkin ≥ 4.09 × 1039 erg s−1. The derived mass outflow rate is consistent with that expected from empirical relations between mass outflow rate and AGN luminosity for a low-luminosity AGN such as NGC 4593. High angular resolution integral field observations can enable multi-component analysis of the innermost regions of galaxies, allowing a detailed view of ionised gas flows.
Key words: galaxies: active / galaxies: individual: NGC 4593 / galaxies: kinematics and dynamics / galaxies: nuclei
Corresponding author; This email address is being protected from spambots. You need JavaScript enabled to view it.
© The Authors 2024
 Open Access article, published by EDP Sciences, under the terms of the Creative Commons Attribution License (https://creativecommons.org/licenses/by/4.0), which permits unrestricted use, distribution, and reproduction in any medium, provided the original work is properly cited.
This article is published in open access under the Subscribe to Open model. This email address is being protected from spambots. You need JavaScript enabled to view it. to support open access publication.
1. Introduction
Gas flows into the centres of galaxies are an important ingredient in the formation, growth and evolution of galaxies (Knapen et al. 2019; Storchi-Bergmann & Schnorr-Müller 2019). The process of gas falling into the central supermassive black hole (SMBH) can lead to high levels of non-stellar emission which results in an AGN. However, the details of how these gas flows reach the centre of a galaxy and how they in turn affect their surroundings through feedback is not well understood, despite ongoing research (Harrison & Ramos Almeida 2024).
Violent disturbances caused by major mergers can drive gas to the centre of galaxies and fuel starbursts (see Storchi-Bergmann & Schnorr-Müller 2019). Shocks and gravitational torques associated with bars also lead to inward gas transportation (Simkin et al. 1980; Sakamoto et al. 1999). However, in the presence of inner Lindblad resonances (ILRs), the gas does not flow further towards the galactic nucleus, but accumulates in rings near the ILRs because of positive gravitational torques (Knapen et al. 1995; Piner et al. 1995).
Once inside the inner kiloparsec, further inflow inwards on the scales of hundreds and tens of parsec is influenced by smaller non-axisymmetries (Begelman et al. 1984; Shlosman et al. 1989). The accumulation of gas in the central parts of the galaxy may lead to both starburst and AGN formation, and if the two occur simultaneously, such a galaxy is called ‘composite’ (see Knapen et al. 2019).
The supply of gaseous fuel feeding the AGN may regulate nuclear activity. There is a tight correlation between the SMBH mass and the main properties of its host galaxy, including its luminosity, mass and the velocity dispersion of the bulge (Ferrarese & Merritt 2000). This shows that there is co-evolution between the SMBH and its host galaxy (Kormendy & Ho 2013; Heckman & Best 2014). Feedback from the AGN in the form of jets, radiation, and accretion disc winds may regulate the growth of a galaxy by suppressing star formation due to gas that is ejected from the nuclear region, is heated, or is just disrupted (Harrison & Ramos Almeida 2024).
In order to understand the transport of gas in to the AGN and also how it affects its surroundings through feedback, we study the stellar kinematics and the emission line properties of the interstellar gas around the nucleus of NGC 4593. This study requires observations with a very high spatial resolution (e.g. Comerón et al. 2021; Bessiere & Ramos Almeida 2022; Ramos Almeida et al. 2022). With the advent of AO-supported integral field spectroscopy (IFS), the detailed study of the central tens of parsecs of many galaxies becomes possible. We used high angular resolution archival IFS data obtained with the AO narrow-field mode (NFM) of the MUSE; (Bacon et al. 2010) at the Very Large Telescope (VLT).
NGC 4593 is a nearby spiral galaxy that is also known as Mrk 1330. It is an active galaxy classified as Seyfert 1.3 of morphological type (R′)SB(rs) b at a distance of 35.4 ± 3.0 Mpc, with a diameter 39.3 kpc and an angular size of  (De Vaucouleurs et al. 1991). At this distance, one arcsecond corresponds to 170 pc. NGC 4593 hosts a SMBH at its centre, with a mass of MBH = (9.8 ± 2.1)×106 M⊙ (Bentz et al. 2006). Variability in the X-ray band emission was observed (Burnell & Culhane 1979) and far-infrared observations revealed a halo-like morphology that is slightly elongated along a position angle of 100° (McHardy et al. 2018). Delgado et al. (1997) noted the presence of dust and a blue nuclear ring with a radius of about 2″. Observations with Hubble Space Telescope/ Near Infrared Camera and Multi-Object Spectrometer 2(HST/NICMOS2) confirm that the central region is dominated by spiral dust lanes surrounding a pseudo-ring without evidence of an inner bar (Marín et al. 2007). Observations from Ruschel-Dutra et al. (2021) showed extended [O III] λ5007 emission whose peak is displaced by about
  (40 pc) to the north-eastern side of the nucleus. They also reported the tentative detection of an ionised outflow based on the higher velocity dispersion values of the [O III] λ5007 emission (
 ) and gas densities (
 ) that they measured in the east to south-eastern direction.
2. Observations and data processing
2.1. MUSE-AO observations
We used archival data from the MUSE IFS at the VLT UT4. MUSE contains 24 integral field units (IFUs) and uses the image-slicing technology to deliver very high quality spectroscopic data (Bacon et al. 2010). It is enhanced with a deformable secondary mirror (DSM) that implements all the VLT-required functionalities and has ground-layer AO wavefront sensing modules such as the ground atmospheric layer adaptive corrector for spectroscopic imaging (GALACSI). Attached to the main structure of the telescope is the four laser guide-star facility (4LGSF), which provides the hardware and software to launch the laser beams into the atmosphere (Stuik et al. 2006). In MUSE, the NFM has a wide wavelength range of 4750 Å − 9350 Å and a field of view (FOV) of  with a sampling of 0.0253 arcsec per pixel. The angular resolution, obtained from measuring the full width at half maximum (FWHM) of stars in the FOV, is ∼0
 12 (20 pc). The data used in this work were taken on August 24, 2019, within the programme ID.0103.B – 0908 (PI: K. Jahnke). The total exposure time was 2400 s in a single observation block. We used a fully reduced (Delmotte et al. 2016) science-ready data cube provided by European Southern Observatory’s (ESO) Phase 3 data products. This data cube has two extensions, one containing the signal and the other containing the error estimates. The fully reduced three-dimensional data cube has two spatial and one wavelength axes.
2.2. MUSE data processing
We used the galaxy IFU spectroscopic tool (GIST), version 3.1.0 to process the data cube. It is a comprehensive Python-based framework for the scientific analysis of fully reduced IFU spectroscopic data (Bittner et al. 2019). The input data cube was read using GIST and the wavelength range is shortened to 4750 Å − 7000 Å. This region contains the emission lines of interest, for instance to produce the BPT diagrams to we used to study the ionisation mechanisms of the central region of the galaxy. Above 7000 Å, there is contamination due to strong sky lines, and the range 5780 − 6050 Å, which is affected by the laser guide stars was, ignored. Spatial masking was performed to remove defunct spaxels and those with a signal-to-noise ratio (S/N) below the given threshold before we binned the data.
Our data contain both high and low S/N associated with line emission and stellar absorption respectively, we therefore used two binnings produced with the Voronoi binning code written by Cappellari & Copin (2003). For the stellar component we computed the median S/N from the rest-frame wavelength range 5580–5680 Å, which does not include any strong emission lines. We required an S/N = 50 per stellar bin and a total of 426 Voronoi bins were generated. For the emission line binning, we required an S/N = 100 and in this case, a total of 762 Voronoi bins were generated. The emission line or ionised gas binning was made based on a [O III] λ5007 continuum-subtracted image. We built the image by integrating the data cube flux in a 10 Å window centred on the [O III] λ5007 rest-frame wavelength of NGC 4593, and by subtracting the integrated flux in a window of equal width but 50 Å redwards. We considered spaxels with an S/N greater than 0.1 and 1.0 for the emission line and stellar binning, respectively. Inevitably, some isolated spaxels might have an S/N above the threshold due to random fluctuations. To avoid these spaxels from being accreted into Voronoi bins we modified GIST to consider clusters with a minimum of 50 contiguous spaxels for the binning. The number of 50 spaxels is arbitrary.
We used the penalized pixel-fitting (pPXF) method to extract the stellar velocity field and velocity dispersion. The code performs a full spectral fitting of each stellar emission bin with a linear combination of template spectral energy distributions widened to match the line-of-sight velocity distribution (LOSVD) of the spectral lines. We used the E-MILES library (Vazdekis et al. 2016) templates together with BaSTI isochrones (Pietrinferni et al. 2004), a Kroupa universal stellar initial mass function (Kroupa 2001), and solar abundances. The initial guess for the velocity dispersion was 50 km s−1 and the stellar continuum was modelled with an eighth-degree additive Legendre polynomial. Very strong sky and emission lines were masked with windows of various widths: [N I] λλ 5198, 5200, [He I] λ5875, [O I] λλ6300,6363, [N II] λλ6547,6583, and [S II] λλ6716,6730 were masked with a 30 Å width; Hβ with 75 Å; [O III] λ4958 with 20 Å; [O III] λ5007 with 40 Å; Hα with 130 Å; and the sky line at λ5577 with 20 Å. We also excluded a 280 Å window centred on 5914 Å to avoid being affected by the laser guide stars.
To study the ionised gas, we used the Gas and Absorption Line Fitting PyGandALF module (Sarzi et al. 2006; Falcón-Barroso et al. 2006) from the GIST pipeline, which was run on the bin level to perform the emission line analysis. Since NGC 4593 is a Seyfert 1.3 galaxy showing broad-components associated with the broad line region (BLR) in the permitted lines (e.g. Hα and Hβ), a narrow-component from the narrow-line region (NLR), and a broad-component associated with the ionised gas outflow (Ruschel-Dutra et al. 2021), we focused on the [O III] λ5007 line to study the properties of the outflowing gas, since it is a strong forbidden transition that is not in the vicinity of other strong emission lines with a BLR component, such as Hα. Hence, any broadening of the [O III] line profiles will be associated with kinematically disrupted gas, and not with the BLR. Therefore we only performed a two-Gaussian component fitting for the [O III] line when we tried to characterise the outflow kinematics (see Section 3.3). For [N II] were unable to do this because they are blended with Hα and fully immersed in the broad-component from the BLR. We therefore just a single Gaussian-component to fit the [O III] and [N II] lines in Section 3.4. The initial guess for the velocity and velocity dispersion is 0 and 100 km s−1 for the narrow-component, while for the broad outflow and BLR components, the initial guess is −500 and 500 km s−1 respectively.
We reduced the number of degrees of freedom in the fits by fixing the flux ratios of several doublets to their theoretically estimated values (Storey & Zeippen 2000), which are listed in Table 1. We also tied the kinematics of all the lines considered here to those of [O III], since otherwise it would be impossible to successfully fit the Hα+[N II] blend. Due to the strong AGN emission, the stellar contribution to the emission lines is minimal compared to that from the emission lines throughout the whole FOV. In any case, we used the stellar fit from pPXF as input to PyGandALF, multiplied by a second-order Legendre polynomial. This component accounts for the underlying stellar and AGN continuum.
Fixed emission line flux ratios.
2.3. DESI, HST, and ALMA data
The left panel in Fig. 1 shows an archival DESI image of the galaxy. To display the area covered by MUSE-NFM (7 5×7
5×7 5), we overlay a square in the centre. With an angular resolution of approximately
  and a pixel size of
  , the archival HST image in the right panel of Fig. 1 was captured using the F550M filter of the ACS in the high-resolution channel (HRC) mode (Grogin et al. 2011). The green contours in the right panel of Fig. 1 correspond to the CO(1–0) emission detected with the Atacama Large Millimeter/sub-millimeter Array (ALMA). These data were obtained on November 3, 2021, as part of project 2021.1.00812.S (PI: C. Ricci) with a resolution of
  . Since the astrometry of HST is not accurate, we applied a shift between the HST image and the ALMA CO map so that the dust lanes coincide with the molecular gas, which is normally the case in spiral galaxies (Bolatto et al. 2017; Ramos Almeida et al. 2022). Khianfar et al. (in prep.) study the CO emission from NGC 4593 in more detail on the basis of CO(2–1) ALMA data from project 2017.1.00236.S (PI: M. Malkan).
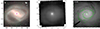 |
Fig. 1. NGC 4593. Left panel: Archival Dark Energy Spectroscopic Instrument (DESI) legacy survey image of the galaxy (Dey et al. 2019). The purple square at the centre shows the FOV of the MUSE-NFM observations ( |

3. Results
3.1. Morphology
In the middle panel of Fig. 1, the MUSE image of NGC 4593 collapsed in the spectral range 5300–5750 Å shows a bright nucleus dominated by AGN emission and an inner spiral arm extending right into the centre of the galaxy. This coincides with what Eskridge et al. (2002) reported for NGC 4593 in their study of the near-infrared and optical morphology of spiral galaxies. From the similarity of the morphology of the images, it is clear that the spatial resolution of the MUSE data (0 12) is comparable to that of the HST image (0
 05). The ALMA CO(1–0) contours shown in the right panel of Fig. 1, which probe cold molecular gas with an angular resolution similar to that of the MUSE data, trace the dusty spiral arms of the galaxy, which were reported by Kormendy et al. (2006).
3.2. Stellar kinematics
The stellar velocity and velocity dispersion maps are similar to those of the ionised gas disc (see Sect. 3.3) and show that the circumnuclear stellar population is supported by rotation with a velocity amplitude of ±110 km s−1 (see Fig. 2), which matches the findings by Barbosa et al. (2006). It has a kinematic major axis of PA ∼ 100°, and the east side is blue-shifted and the west side red-shifted, which roughly corresponds to the photometric axis of the inner parts of the galaxy in Kormendy et al. (2006). We were unable to accurately fit the stellar kinematics in the central  (120 pc) of the galaxy for any of the maps because the line and continuum emission from the AGN are so strong that the stellar absorption lines are completely diluted. This is shown on the right panel of Fig. 2 as a region with unrealistically high velocity dispersion values. For the region outside
  , we find a typical velocity dispersion of σ = 83 ± 4.8 km s−1 which is lower than the value of σ = 139 ± 5 km s−1 found by Caglar et al. (2020) for the innermost
  . The reason for the discrepancy is probably a combination of us missing regions with a presumably higher velocity dispersion regions within the inner
  and the beam smearing induced by the relatively large aperture in Caglar et al. (2020).
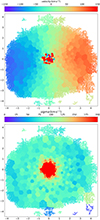 |
Fig. 2. Stellar kinematics maps of NGC 4593. Top panel: Velocity map of the stellar component, where zero velocity corresponds to z = 0.0084 (cz = 2518 km s−1). Bottom panel: Velocity dispersion map of the stellar component. The colour scale and units are as shown in the bar above each map. North is up and east is to the left, and the scale of each panel is in arcseconds. |
3.3. Emission lines
As explained in Section 2.2, to study the properties of the ionised gas kinematics, we focused on [O III] λ5007 because any broadening of the line profiles will be associated with kinematically disrupted gas and not with the BLR. Therefore, we performed two Gaussian fits, narrow and broad, which correspond to the narrow and outflow components, respectively.
Fig. 3 shows the [O III] λ5007 gas flux and kinematics maps of the narrow-component, which traces the ionised gas disc. The flux map shows a strong nuclear peak at the position of the AGN. The flux gradually decreases with increasing radius. In the velocity map shown in the middle panel of Fig. 3 positive velocities are seen to the west and negative velocities to the east. It has a major-axis PA similar to that of the stellar velocity map (PA ≈ 100°), although with a smaller velocity amplitude of ∼90 km s−1.
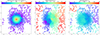 |
Fig. 3. From left to right: Flux, velocity, and velocity dispersion maps of the [O III] λ5007 narrow-component emission. The colour scale and units are as shown in the colour bar above each map and are the same as in Fig. 4 to facilitate comparison. North is up and east is to the left, and the scale for each panel is in arcseconds. |
Fig. 4 shows the [O III] λ5007 gas flux and kinematics maps for the broad-component, which corresponds to kinetically disrupted gas. The flux maps also show a strong nuclear peak, the intensity of which decreases with increasing radius. The kinematic maps show blue-shifted velocities of up to −200 km s−1 on the east side of the galaxy, within a radius of ∼2″ (340 pc). This coincides with a region of high velocity dispersion (up to 250 km s−1), confirming the presence of outflowing gas, as first tentatively reported by Ruschel-Dutra et al. (2021). Considering the almost face-on orientation of NGC 4593, we most likely see the approaching side of the outflow, and its potentially red-shifted counterpart is hidden by the galaxy disc.
3.4. Resolved BPT diagrams: Ionisation mechanisms
To study the mechanism(s) that ionise the central region of NGC 4593, we fitted the [O III] λ5007 and [N II] λ6583 lines with a narrow Gaussian component, and Hα and Hβ with two (narrow and broad) Gaussians. The broad-component fitted to Hα and Hβ corresponds to emission from the BLR, and the narrow Gaussian includes the disc and outflow components. We did not consider the latter as two separate kinematic components as we did in previous sections because the BLR component makes it impossible to achieve a good separation into three components for the Hα and Hβ lines. We then used the BPT diagnostic diagram (Baldwin et al. 1981) to produce resolved ionisation diagnostic maps. The maps used the [N II] λ6583/Hα and [O III] λ5007/Hβ narrow line flux ratios. The solid curve in the left panel of Fig. 5 indicates the theoretical upper limit to pure star formation from Kewley et al. (2001), and the empirical limit to this from Kauffmann et al. (2003) is indicated with the dashed curve. We used the parameter η defined by Erroz-Ferrer et al. (2019) as an indicator of the strength of the ionisation mechanism, given by the distance of a given point to the curves. The region below the dashed line is considered to be ionised by star formation (η < −0.5), and the region above the solid line is ionised by the AGN (η > 0.5). The region between the two lines is considered to be composite and is ionised by a mix of the two mechanisms.
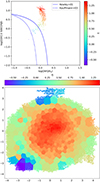 |
Fig. 5. BPT diagram (top panel) of the regions shown in the bottom panel. The colour scale is shown, colour-coded by η, in the colour bar on the side and at the top of each map, respectively. The scale of the axes in the right panel is arcsec. North is up and east is to the left. |
The BPT diagram shown in the left panel of Fig. 5 indicates that the bulk of the narrow-line emission measured from the MUSE data is gas that is photoionised by the AGN, with a few spaxels lying in the composite region of the diagram. The right panel of Fig. 5 shows the spatial distribution of η. It reveals higher ionisation parameter values in the central ∼4″(680 pc) in diameter of the galaxy (η > 1), as well as values of 0.75 < η < 1 towards the west. The spaxels lying in the composite region of the diagram (−0.5 < η < 0.5) are found at radii larger than ∼2″(340 pc).
3.5. Physical properties of the outflowing gas
From the [O III] λ5007 emission line flux and the kinematics presented in Section 3.3, we can measure various physical properties of the outflowing gas. For all the calculations in this Section, we used the measurements corresponding to the [O III] λ5007 broad-components shown in Fig. 4. To estimate the total mass of the outflow Mout, we used Eq. (1) in Rose et al. (2018),
 (1)
(1)
where L(Hβ) is the Hβ luminosity corrected for extinction, αHβ is the effective Case B coefficient (we adopted 3.03 × 10⁻¹⁴ cm3 s−1), which corresponds to an electron temperature Te = 104 K (Osterbrock & Ferland 2006), mp is the mass of the proton, hνHβ is the energy of an Hβ photon, and ne is the electron density.
To measure the Hβ line flux and hence obtain its luminosity, we first tied its kinematics to those of [O III] λ5007 to reduce the uncertainties. We then fitted the emission line profile leaving the intensity as the only free parameter, as shown in Fig. 6, where the blue-shifted component representing the outflow is buried below the broad-component of FWHM ∼ 1600 km s−1. L(Hβ) in Eq. (1) should be corrected for extinction, but from the data we could not determine the extinction using the Hβ and Hα lines because the emission from the BLR is present everywhere in the field due to point-spread function (PSF) smearing. As a result, the Hβ luminosity that we measure, 4.7 × 1039 erg s−1, and all the derived quantities are lower limits.
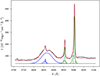 |
Fig. 6. Hβ and [O III] λ5007 emission lines and corresponding fits of the nuclear spectrum. The solid black and red lines correspond to the MUSE data and fit. The latter is the sum of three components in the case of Hβ: A broad-component with an FWHM = 1600 km s−1 associated with the BLR, a blue-shifted broad-component with an FWHM = 400 km s−1 representing the outflow, and a narrow-component of FWHM = 100 km s−1 corresponding to the gas disc. In the case of the [O III] λ5007 lines, only the two latter components were fitted. |
To estimate the electron density, we first attempted to create a map of the ratio [S II] λ6716/[S II] λ6731, but the S/N of the data was not high enough. We thus constructed an integrated [S II] spectrum within a diameter of 2″, centred on the galaxy nucleus (see Fig. 7) as shown in Sanders et al. (2015). Using this spectrum and the flux of the broad-components that we fitted, we obtained an electron density of ne = 400 cm3. Using this electron density, we measure a total mass of the outflow of Mout ≥ 1.589 × 1035 kg which corresponds to 0.799 × 10⁵ M⊙.
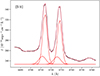 |
Fig. 7. Same as in Fig. 6, but for the [S II] doublet, integrated in a circle of 2″, centred on the nucleus. |
To obtain the mass-loss rate Ṁ, we used Eq. (2),
 (2)
(2)
where Vout is the outflow velocity, which we estimated as the maximum velocity that we measured for the outflowing gas. In this case it is ∼200 km s−1, derived from the blue-shifted broad-components shown in the middle panel of Fig. 4. The outflow radius, Rout, was estimated to be 2″ (340 pc) from the nucleus, as measured from the right panel of Fig. 4. We adopted a model of an expanding spherical shell assumed to be accelerated at the nucleus (Kraemer et al. 2020). Based on this we calculated that the mass-loss rate per year is Ṁ ≥ 0.048 M⊙.
To estimate the kinetic power  of the outflow, we used Eq. (4) in Rose et al. (2018),
 (3)
(3)
where σ is the average velocity dispersion of the outflow measured from the right panel of Fig. 4, of ∼250 km s−1. The resulting value of the kinetic power is  . To estimate the coupling efficiency, we divided the outflow kinetic energy by the bolometric luminosity of the AGN, 5 × 1043 erg s−1, obtained from 2–10 keV X-ray observations of the galaxy (Vasudevan & Fabian 2009). Ruschel-Dutra et al. (2021) reported an AGN luminosity of 1 × 1044 erg s−1 based on more recent hard X-ray observations. Considering these two values we thus derive a coupling efficiency of ≥8.18 × 10⁻⁵.
4. Discussion
The superb spatial resolution of the MUSE-NFM data set used in this work is demonstrated by the MUSE image of NGC 4593 collapsed in the spectral range 5300–5750 Å shown in Fig. 1, where almost all the structures seen in an HST image are detected in the circumnuclear region. We can clearly distinguish the innermost spiral arm originating in the south, which surrounds the nucleus in anti-clockwise direction, until it reaches the nucleus through the north. Dust lanes are present in the spiral arms, and they mostly coincide with the CO(1–0) line emission detected with ALMA. The central region of the galaxy is most likely accumulating gas that will eventually fuel future episodes of nuclear activity and/or star formation.
From the stellar velocity maps derived from the MUSE data, we confirm the presence of a rapidly rotating disc. The MUSE data allowed us to study the kinematics and energetics of the ionised outflow previously reported by Ruschel-Dutra et al. (2021) using optical IFU data from the Gemini Multi-Object Spectrograph (GMOS). These authors tentatively reported the presence of extended [O III] λ5007 emission along the photometric major axis whose emission peak is displaced about 40 pc north-east of the nucleus. They measured the highest velocity dispersion and density values to the east and south-east, with the later reaching maximum values of ∼500–600 cm−3. In the MUSE data we detect blue-shifted gas, with velocities of up to 200 km s−1, in a region with a high velocity dispersion of up to 250 km s−1 towards the east side of the galaxy. We measure an outflow radius of 2″ (340 pc) from the broad-component of the [O III] λ5007 line. Considering the almost face-on orientation of NGC 4593, we most likely detect the approaching side of the outflow, and its potentially receding counterpart would be hidden by the galaxy disc.
Since we cannot constrain the outflow extinction, we derived lower limits to the outflow mass, mass-loss rate, kinetic energy, and coupling efficiency. At the bolometric luminosity of NGC 4593, a mass-loss rate of ∼0.1 M⊙ yr−1 is expected from the Fiore et al. (2017) empirical relation at z < 0.5 between outflow mass rate and AGN luminosity (see Fig. 8). The value that we estimate from the MUSE observations is Ṁ ≥ 0.048 M⊙ yr−1, which is consistent with the empirical relation. Figure 8 also includes the type 2 quasars from the QSOFEED sample reported by Speranza et al. (2024). These ionised outflows are below the scaling relation due to their large radii (between 3 and 12 kpc) and high electron densities (300 − 1000 cm−3), measured also from the [SII] emission lines. The same is true for most of the Seyfert galaxies with ionised outflow measurements reported by Davies et al. (2020), which are also shown in Fig. 8 and have accurate measurements of the electron density. The galaxies compiled by Fiore et al. (2017), were all assumed to have the same density and radius (200 cm−3 and 1 kpc), resulting in higher outflow mass rates. In the case of NGC 4593, the values of the outflow radius and the electron density are ∼340 pc and 400 cm−3, respectively, and they also contribute to boosting the ionised mass outflow rate.
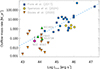 |
Fig. 8. Ionised mass outflow rate as a function of AGN luminosity. Blue squares show the ionised outflows of ULIRGs and AGN at z < 0.5 compiled by Fiore et al. (2017), and the dashed blue line is the corresponding linear fit. Yellow circles and orange triangles show the ionised outflows of the QSOFEED type 2 quasars at z ∼ 0.1 from Speranza et al. (2024) and of the nearby Seyfert galaxies from Davies et al. (2020). The pink diamond shows the lower limit on the outflow rate in NGC 4593 derived in this work, and the green triangles show the values reported for NGC 2992 (Zanchettin et al. 2023), for NGC 5643 (García-Bernete et al. 2021), and for NGC 5728 (Shimizu et al. 2019). The outflow mass rates from Fiore et al. (2017), Zanchettin et al. (2023), and Speranza et al. (2024) have been divided by three to match our outflow geometry (see Eq. (2)). |
5. Conclusions
We presented a detailed analysis of the circumnuclear region of NGC 4593, a Seyfert 1.3 galaxy located at a distance of 35.35 ± 2.95 Mpc. We used archival optical IFS data from the AO-assisted MUSE-NFM instrument at the VLT. Dust lanes are present in the spiral arms and most of them coincide with the CO(1–0) line emission detected in ALMA data (see Fig. 1). The stellar velocity and velocity dispersion maps are similar to those of the ionised gas disc (see Sect. 3.3) and show that the circumnuclear stellar population is supported by rotation with a velocity amplitude of ±110 km s−1, which matches the findings by Barbosa et al. (2006). Kinematic maps from two-component Gaussian fits of the [O III] λ5007 line show blue-shifted velocities of up to −200 km s−1 on the east side of the galaxy, within a radius of ∼2″. This coincides with a region with a high velocity dispersion (up to 250 km s−1), confirming the presence of outflowing gas, as first tentatively reported by Ruschel-Dutra et al. (2021).
We measured some of the properties of the outflowing gas; a mass-loss rate of Ṁ ≥ 0.048 M⊙ yr−1, a kinetic power of  and a coupling efficiency of of ≥8.18 × 10⁻⁵. The derived mass-loss rate is consistent with that predicted from the empirical relation of Fiore et al. (2017),
  at the bolometric luminosity of NGC 4593. As constrained from our BPT diagrams, the bulk of the line-emitting gas associated with the disc and the outflow that we detect with MUSE is photoionised by the AGN, with a few spaxels at radii larger than ∼2″ lying in the composite region of the diagram.
Our study has proven the extraordinary quality of MUSE data once again. Although an ionised outflow in this galaxy has been tentatively reported before by Ruschel-Dutra et al. (2021), the MUSE data only allow us two-component fits at high spatial resolution, which can be used to study the kinematics of the ionised gas in this galaxy. Most studies have not been able to resolve ionised outflows for low-luminosity AGN such as NGC 4593, but the high angular resolution of MUSE-AO, now allow us to constrain the outflow radius to be ∼340 pc. It is expected that further high angular resolution IFU observations will provide more measurements of ionised outflows in low-luminosity AGN such as NGC 4593.
Acknowledgments
Part of the results in this work are based on the public data released from MUSE NFM-AO under the programme ID. NO.3-0908, operated by ESO. We also used data from ALMA, as part of project 2021.1.00812.S (PI: C. Ricci). This research was also supported by a grant from the European Astronomical Society thanks to the generous support of the MERAC Foundation and Springer Verlag. DM thanks the Instituto de Astrofísica de Canarias (IAC) for allowing us to use their super-computers remotely to process the data used in this work Co-funded by the European Union. Views and opinions expressed are however those of the author(s) only and do not necessarily reflect those of the European Union. Neither the European Union nor the granting authority can be held responsible for them. JHK acknowledges support from the Agencia Estatal de Investigación del Ministerio de Ciencia, Innovación y Universidades (MCIU/AEI) under the grant “The structure and evolution of galaxies and their outer regions” and the European Regional Development Fund (ERDF) with reference PID2022-136505NB-I00/10.13039/501100011033. SC acknowledges funding from the State Research Agency (AEI-MCINN) of the Spanish Ministry of Science and Innovation under the grant “Thick discs, relics of the infancy of galaxies” with reference PID2020-113213GA-I00. CRA acknowledges funding from the State Research Agency (AEI-MCINN) of the Spanish Ministry of Science and Innovation under the grant “Tracking active galactic nuclei feedback from parsec to kiloparsec scales”, with reference PID2022-141105NB-I00. CRA thanks Maria Vittoria Zanchettin for helpful suggestions.
References
- Bacon, R., Accardo, M., Adjali, L., et al. 2010, SPIE, 7735, 131 [Google Scholar]
- Baldwin, J. A., Phillips, M. M., & Terlevich, R. 1981, PASP, 93, 5 [Google Scholar]
- Barbosa, F. K. B., Storchi-Bergmann, T., Fernandes, R. C., Winge, C., & Schmitt, H. 2006, MNRAS, 371, 170 [NASA ADS] [CrossRef] [Google Scholar]
- Begelman, M. C., Blandford, R. D., & Rees, M. J. 1984, RMP, 56, 255 [CrossRef] [Google Scholar]
- Bentz, M. C., Denney, K. D., Cackett, E. M., et al. 2006, ApJ, 651, 775 [NASA ADS] [CrossRef] [Google Scholar]
- Bessiere, P. S., & Ramos Almeida, C. 2022, MNRAS, 512, L54 [NASA ADS] [CrossRef] [Google Scholar]
- Bittner, A., Falcón-Barroso, J., Nedelchev, B., et al. 2019, A&A, 628, A117 [NASA ADS] [CrossRef] [EDP Sciences] [Google Scholar]
- Bolatto, A. D., Wong, T., Utomo, D., et al. 2017, ApJ, 846, 159 [Google Scholar]
- Burnell, S. B., & Culhane, J. 1979, MNRAS, 188, 1P [NASA ADS] [CrossRef] [Google Scholar]
- Caglar, T., Burtscher, L., Brandl, B., et al. 2020, A&A, 634, A114 [NASA ADS] [CrossRef] [EDP Sciences] [Google Scholar]
- Cappellari, M., & Copin, Y. 2003, MNRAS, 342, 345 [Google Scholar]
- Comerón, S., Knapen, J., Almeida, C. R., & Watkins, A. 2021, A&A, 645, A130 [NASA ADS] [CrossRef] [EDP Sciences] [Google Scholar]
- Davies, R., Baron, D., Shimizu, T., et al. 2020, MNRAS, 498, 4150 [Google Scholar]
- De Vaucouleurs, G., de Vaucouleurs, A., & Harold, Jr., G. 1991, Third Reference Catalogue of Bright Galaxies: Volume III (Springer Science& Business Media), 3 [Google Scholar]
- Delgado, R. M. G., Pérez, E., Tadhunter, C., Vilchez, J. M., & Rodríguez-Espinosa, J. M. 1997, ApJS, 108, 155 [NASA ADS] [CrossRef] [Google Scholar]
- Delmotte, N., Arnaboldi, M., Mascetti, L., Micol, A., & Retzlaff, J. 2016, SPIE, 9910, 61 [Google Scholar]
- Dey, A., Schlegel, D. J., Lang, D., et al. 2019, ApJ, 157, 168 [CrossRef] [Google Scholar]
- Erroz-Ferrer, S., Carollo, C. M., Den Brok, M., et al. 2019, MNRAS, 484, 5009 [NASA ADS] [CrossRef] [Google Scholar]
- Eskridge, P. B., Frogel, J. A., Pogge, R. W., et al. 2002, ApJ, 143, 73 [NASA ADS] [Google Scholar]
- Falcón-Barroso, J., Bacon, R., Bureau, M., et al. 2006, MNRAS, 369, 529 [Google Scholar]
- Ferrarese, L., & Merritt, D. 2000, ApJ, 539, L9 [Google Scholar]
- Fiore, F., Feruglio, C., Shankar, F., et al. 2017, A&A, 601, A143 [NASA ADS] [CrossRef] [EDP Sciences] [Google Scholar]
- García-Bernete, I., Alonso-Herrero, A., García-Burillo, S., et al. 2021, A&A, 645, A21 [EDP Sciences] [Google Scholar]
- Grogin, N. A., Kocevski, D. D., Faber, S., et al. 2011, ApJ, 197, 35 [NASA ADS] [Google Scholar]
- Harrison, C. M., & Ramos Almeida, C. 2024, Galaxies, 12, 17 [NASA ADS] [CrossRef] [Google Scholar]
- Heckman, T. M., & Best, P. N. 2014, A&A, 52, 589 [NASA ADS] [CrossRef] [Google Scholar]
- Kauffmann, G., Heckman, T. M., Tremonti, C., et al. 2003, MNRAS, 346, 1055 [Google Scholar]
- Kewley, L. J., Dopita, M., Sutherland, R., Heisler, C., & Trevena, J. 2001, ApJ, 556, 121 [NASA ADS] [CrossRef] [Google Scholar]
- Knapen, J., Comerón, S., & Seidel, M. 2019, A&A, 621, L5 [NASA ADS] [CrossRef] [EDP Sciences] [Google Scholar]
- Knapen, J. H., Beckman, J. E., Heller, C. H., Shlosman, I., & de Jong, R. S. 1995, ApJ, 454, 623 [NASA ADS] [CrossRef] [Google Scholar]
- Kormendy, J., & Ho, L. C. 2013, A&A, 51, 511 [NASA ADS] [CrossRef] [Google Scholar]
- Kormendy, J., Cornell, M. E., Block, D. L., Knapen, J. H., & Allard, E. L. 2006, ApJ, 642, 765 [NASA ADS] [CrossRef] [Google Scholar]
- Kraemer, S., Turner, T., Couto, J., et al. 2020, MNRAS, 493, 3893 [CrossRef] [Google Scholar]
- Kroupa, P. 2001, MNRAS, 322, 231 [NASA ADS] [CrossRef] [Google Scholar]
- Marín, V. M. M., Delgado, R. M. G., Schmitt, H. R., et al. 2007, ApJ, 134, 648 [CrossRef] [Google Scholar]
- McHardy, I., Connolly, S., Horne, K., et al. 2018, MNRAS, 480, 2881 [NASA ADS] [CrossRef] [Google Scholar]
- Osterbrock, D. E., & Ferland, G. J. 2006, Astrophysics of gaseous nebulae and active galactic nuclei (University Science Books, Sausalito) [Google Scholar]
- Pietrinferni, A., Cassisi, S., Salaris, M., & Castelli, F. 2004, ApJ, 612, 168 [Google Scholar]
- Piner, B. G., Stone, J. M., & Teuben, P. J. 1995, ApJ, 449, 508 [NASA ADS] [CrossRef] [Google Scholar]
- Ramos Almeida, C., Bischetti, M., García-Burillo, S., et al. 2022, A&A, 658, A155 [NASA ADS] [CrossRef] [EDP Sciences] [Google Scholar]
- Rose, M., Tadhunter, C., Ramos Almeida, C., et al. 2018, MNRAS, 474, 128 [Google Scholar]
- Ruschel-Dutra, D., Storchi-Bergmann, T., Schnorr-Müller, A., et al. 2021, MNRAS, 507, 74 [NASA ADS] [CrossRef] [Google Scholar]
- Sakamoto, K., Okumura, S., Ishizuki, S., & Scoville, N. 1999, ApJ, 525, 691 [NASA ADS] [CrossRef] [Google Scholar]
- Sanders, R. L., Shapley, A. E., Kriek, M., et al. 2015, ApJ, 816, 23 [NASA ADS] [CrossRef] [Google Scholar]
- Sarzi, M., Falcón-Barroso, J., Davies, R. L., et al. 2006, MNRAS, 366, 1151 [Google Scholar]
- Shimizu, T. T., Davies, R. I., Lutz, D., et al. 2019, MNRAS, 490, 5860 [Google Scholar]
- Shlosman, I., Frank, J., & Begelman, M. C. 1989, Nature, 338, 45 [Google Scholar]
- Simkin, S., Su, H., & Schwarz, M. 1980, ApJ, 237, 404 [NASA ADS] [CrossRef] [Google Scholar]
- Speranza, G., Ramos Almeida, C., Acosta-Pulido, J. A., et al. 2024, A&A, 681, A63 [NASA ADS] [CrossRef] [EDP Sciences] [Google Scholar]
- Storchi-Bergmann, T., & Schnorr-Müller, A. 2019, New A, 3, 48 [Google Scholar]
- Storey, P., & Zeippen, C. 2000, MNRAS, 312, 813 [NASA ADS] [CrossRef] [Google Scholar]
- Stuik, R., Bacon, R., Conzelmann, R., et al. 2006, NAR, 49, 618 [Google Scholar]
- Vasudevan, R., & Fabian, A. 2009, MNRAS, 392, 1124 [CrossRef] [Google Scholar]
- Vazdekis, A., Koleva, M., Ricciardelli, E., Röck, B., & Falcón-Barroso, J. 2016, MNRAS, 463, 3409 [Google Scholar]
- Zanchettin, M. V., Feruglio, C., Massardi, M., et al. 2023, A&A, 679, A88 [NASA ADS] [CrossRef] [EDP Sciences] [Google Scholar]
All Tables
All Figures
|
Fig. 1. NGC 4593. Left panel: Archival Dark Energy Spectroscopic Instrument (DESI) legacy survey image of the galaxy (Dey et al. 2019). The purple square at the centre shows the FOV of the MUSE-NFM observations ( |
| In the text | |
|
Fig. 2. Stellar kinematics maps of NGC 4593. Top panel: Velocity map of the stellar component, where zero velocity corresponds to z = 0.0084 (cz = 2518 km s−1). Bottom panel: Velocity dispersion map of the stellar component. The colour scale and units are as shown in the bar above each map. North is up and east is to the left, and the scale of each panel is in arcseconds. |
| In the text | |
|
Fig. 3. From left to right: Flux, velocity, and velocity dispersion maps of the [O III] λ5007 narrow-component emission. The colour scale and units are as shown in the colour bar above each map and are the same as in Fig. 4 to facilitate comparison. North is up and east is to the left, and the scale for each panel is in arcseconds. |
| In the text | |
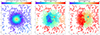 |
Fig. 4. As Fig. 3, now for the broad-component emission. |
| In the text | |
|
Fig. 5. BPT diagram (top panel) of the regions shown in the bottom panel. The colour scale is shown, colour-coded by η, in the colour bar on the side and at the top of each map, respectively. The scale of the axes in the right panel is arcsec. North is up and east is to the left. |
| In the text | |
|
Fig. 6. Hβ and [O III] λ5007 emission lines and corresponding fits of the nuclear spectrum. The solid black and red lines correspond to the MUSE data and fit. The latter is the sum of three components in the case of Hβ: A broad-component with an FWHM = 1600 km s−1 associated with the BLR, a blue-shifted broad-component with an FWHM = 400 km s−1 representing the outflow, and a narrow-component of FWHM = 100 km s−1 corresponding to the gas disc. In the case of the [O III] λ5007 lines, only the two latter components were fitted. |
| In the text | |
|
Fig. 7. Same as in Fig. 6, but for the [S II] doublet, integrated in a circle of 2″, centred on the nucleus. |
| In the text | |
|
Fig. 8. Ionised mass outflow rate as a function of AGN luminosity. Blue squares show the ionised outflows of ULIRGs and AGN at z < 0.5 compiled by Fiore et al. (2017), and the dashed blue line is the corresponding linear fit. Yellow circles and orange triangles show the ionised outflows of the QSOFEED type 2 quasars at z ∼ 0.1 from Speranza et al. (2024) and of the nearby Seyfert galaxies from Davies et al. (2020). The pink diamond shows the lower limit on the outflow rate in NGC 4593 derived in this work, and the green triangles show the values reported for NGC 2992 (Zanchettin et al. 2023), for NGC 5643 (García-Bernete et al. 2021), and for NGC 5728 (Shimizu et al. 2019). The outflow mass rates from Fiore et al. (2017), Zanchettin et al. (2023), and Speranza et al. (2024) have been divided by three to match our outflow geometry (see Eq. (2)). |
| In the text | |
Current usage metrics show cumulative count of Article Views (full-text article views including HTML views, PDF and ePub downloads, according to the available data) and Abstracts Views on Vision4Press platform.
Data correspond to usage on the plateform after 2015. The current usage metrics is available 48-96 hours after online publication and is updated daily on week days.
Initial download of the metrics may take a while.