Fig. 8.
Download original image
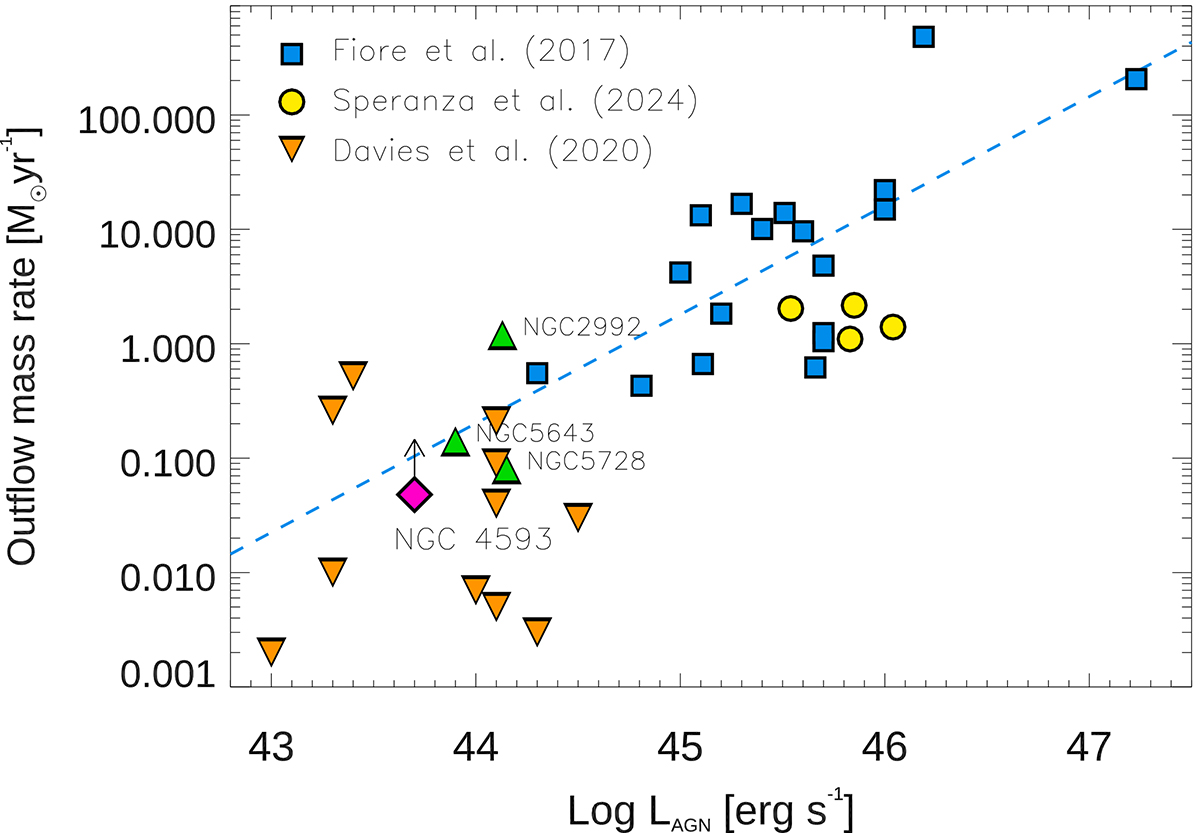
Ionised mass outflow rate as a function of AGN luminosity. Blue squares show the ionised outflows of ULIRGs and AGN at z < 0.5 compiled by Fiore et al. (2017), and the dashed blue line is the corresponding linear fit. Yellow circles and orange triangles show the ionised outflows of the QSOFEED type 2 quasars at z ∼ 0.1 from Speranza et al. (2024) and of the nearby Seyfert galaxies from Davies et al. (2020). The pink diamond shows the lower limit on the outflow rate in NGC 4593 derived in this work, and the green triangles show the values reported for NGC 2992 (Zanchettin et al. 2023), for NGC 5643 (García-Bernete et al. 2021), and for NGC 5728 (Shimizu et al. 2019). The outflow mass rates from Fiore et al. (2017), Zanchettin et al. (2023), and Speranza et al. (2024) have been divided by three to match our outflow geometry (see Eq. (2)).
Current usage metrics show cumulative count of Article Views (full-text article views including HTML views, PDF and ePub downloads, according to the available data) and Abstracts Views on Vision4Press platform.
Data correspond to usage on the plateform after 2015. The current usage metrics is available 48-96 hours after online publication and is updated daily on week days.
Initial download of the metrics may take a while.