Open Access
Fig. 3.
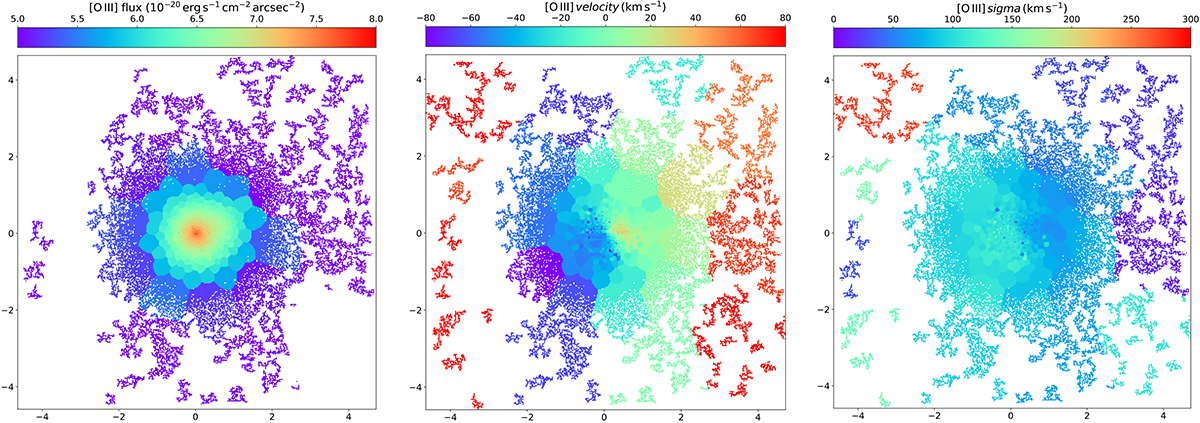
Download original image
From left to right: Flux, velocity, and velocity dispersion maps of the [O III] λ5007 narrow-component emission. The colour scale and units are as shown in the colour bar above each map and are the same as in Fig. 4 to facilitate comparison. North is up and east is to the left, and the scale for each panel is in arcseconds.
Current usage metrics show cumulative count of Article Views (full-text article views including HTML views, PDF and ePub downloads, according to the available data) and Abstracts Views on Vision4Press platform.
Data correspond to usage on the plateform after 2015. The current usage metrics is available 48-96 hours after online publication and is updated daily on week days.
Initial download of the metrics may take a while.