Fig. 1.
Download original image
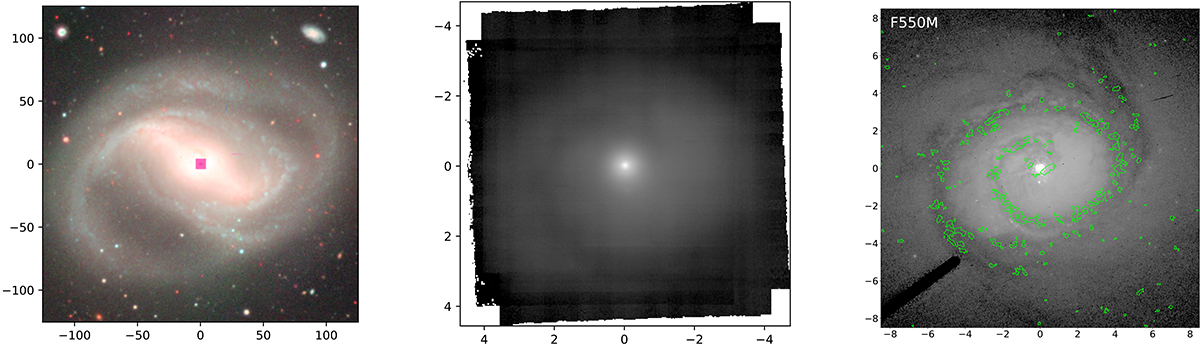
NGC 4593. Left panel: Archival Dark Energy Spectroscopic Instrument (DESI) legacy survey image of the galaxy (Dey et al. 2019). The purple square at the centre shows the FOV of the MUSE-NFM observations (![]() ). Middle panel: MUSE image of the galaxy collapsed in the spectral range 5300–5750 Å. Right panel: HST/ACS image of the galaxy in the F550M filter. The green contours correspond to the CO(1–0) line emission from ALMA. The molecular gas distribution spatially coincides with the spiral dust lanes. All images show a bright nucleus and a single spiral arm extending right into the centre of the galaxy. North is up, east to the left and the scale of each panel is in arcseconds.
). Middle panel: MUSE image of the galaxy collapsed in the spectral range 5300–5750 Å. Right panel: HST/ACS image of the galaxy in the F550M filter. The green contours correspond to the CO(1–0) line emission from ALMA. The molecular gas distribution spatially coincides with the spiral dust lanes. All images show a bright nucleus and a single spiral arm extending right into the centre of the galaxy. North is up, east to the left and the scale of each panel is in arcseconds.
Current usage metrics show cumulative count of Article Views (full-text article views including HTML views, PDF and ePub downloads, according to the available data) and Abstracts Views on Vision4Press platform.
Data correspond to usage on the plateform after 2015. The current usage metrics is available 48-96 hours after online publication and is updated daily on week days.
Initial download of the metrics may take a while.