Open Access
Fig. 5.
Download original image
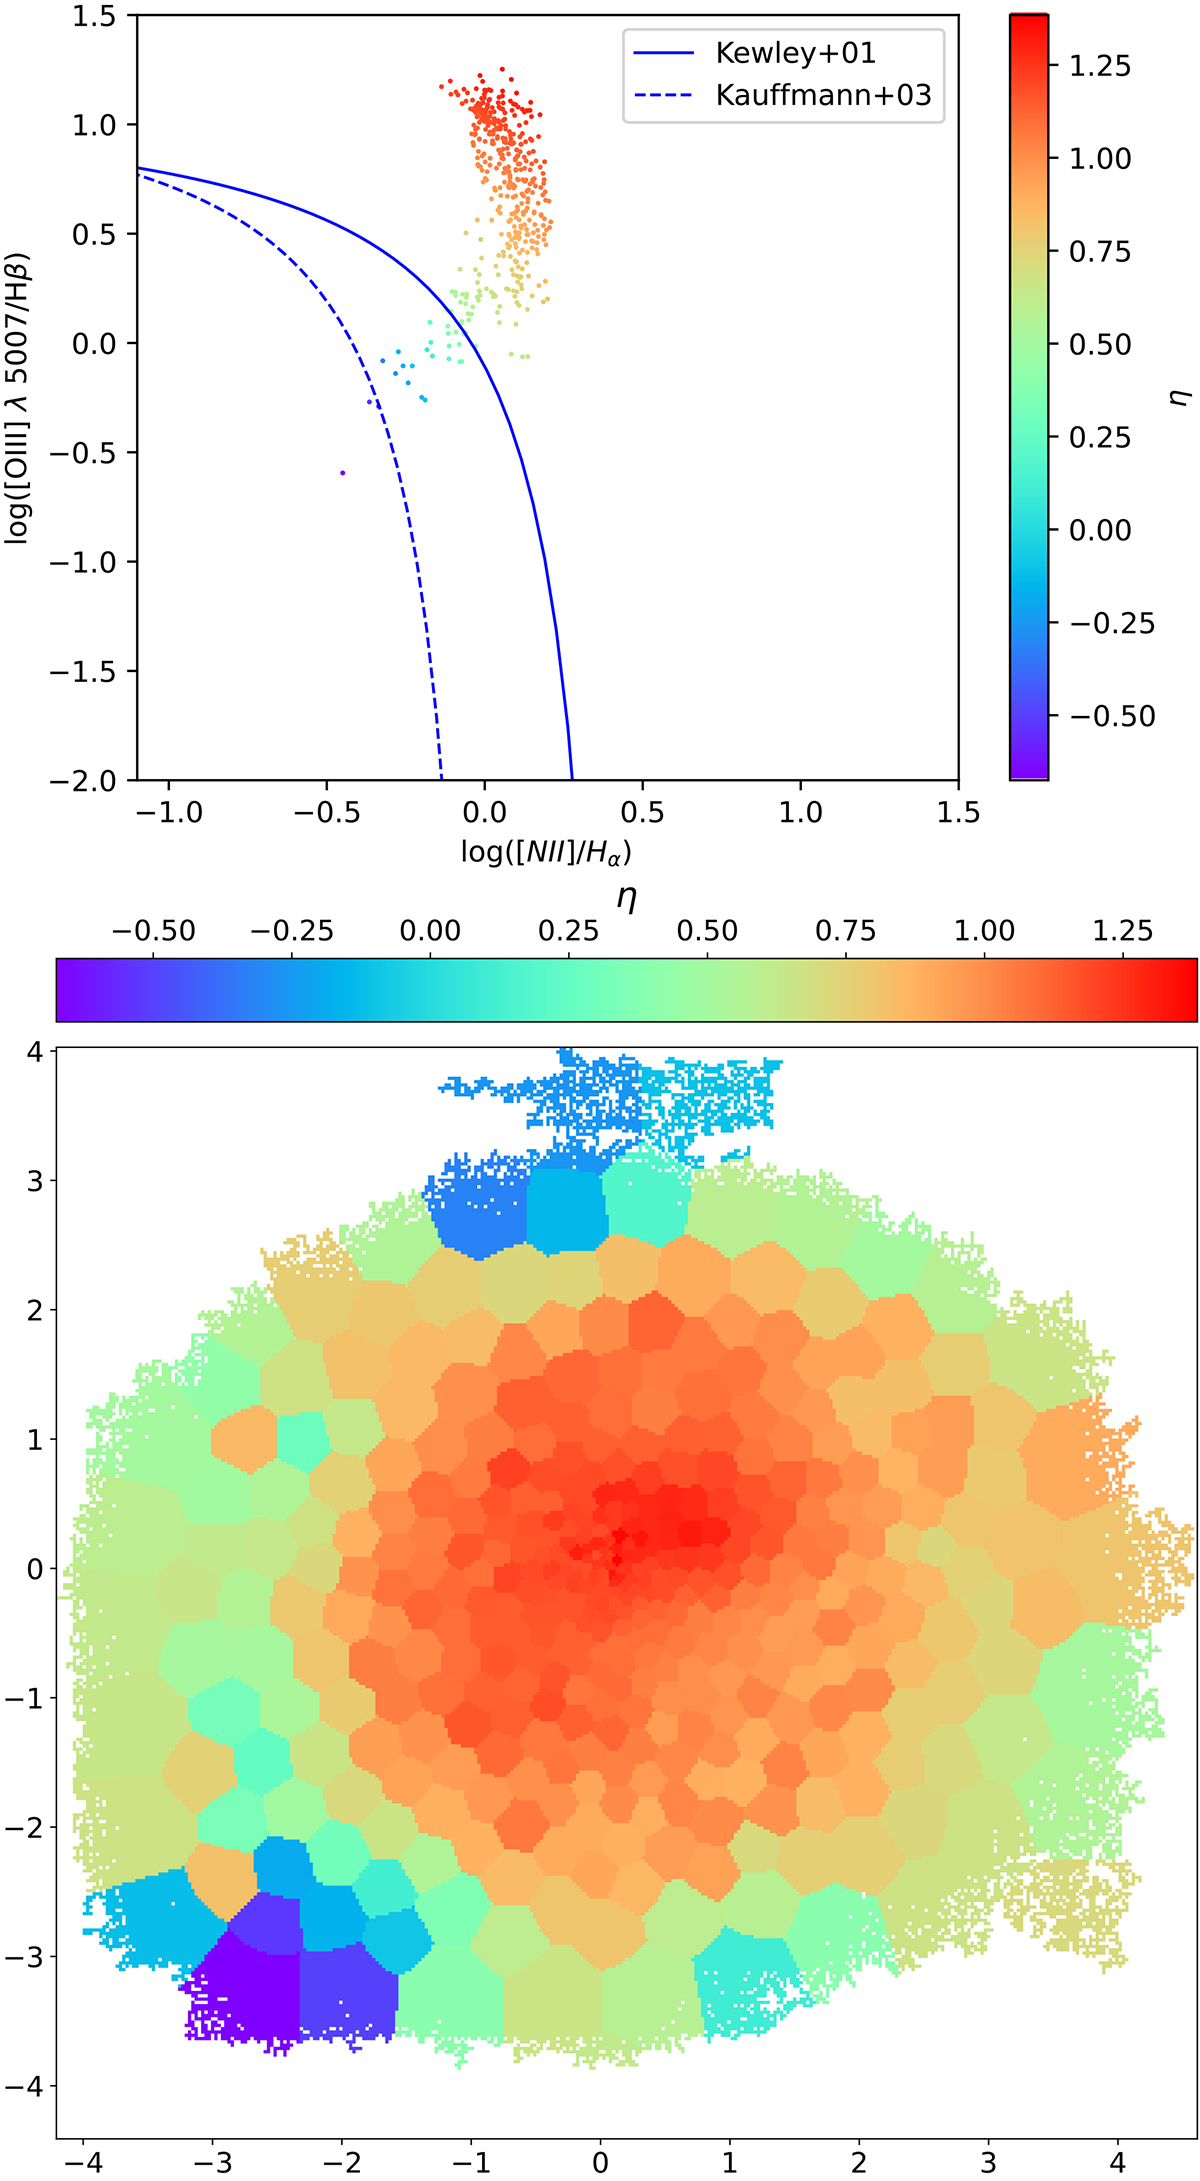
BPT diagram (top panel) of the regions shown in the bottom panel. The colour scale is shown, colour-coded by η, in the colour bar on the side and at the top of each map, respectively. The scale of the axes in the right panel is arcsec. North is up and east is to the left.
Current usage metrics show cumulative count of Article Views (full-text article views including HTML views, PDF and ePub downloads, according to the available data) and Abstracts Views on Vision4Press platform.
Data correspond to usage on the plateform after 2015. The current usage metrics is available 48-96 hours after online publication and is updated daily on week days.
Initial download of the metrics may take a while.