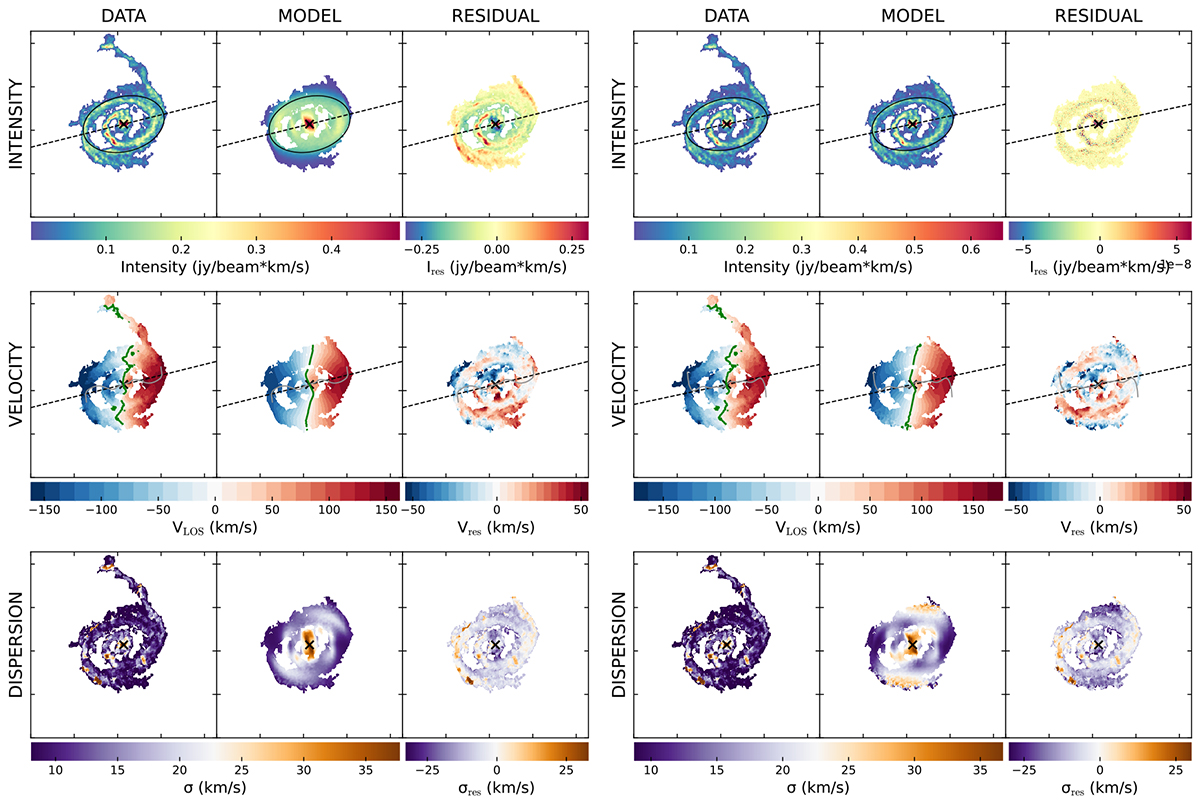
Fig. 4.
Download original image
Detailed intensity, velocity, and dispersion maps for the CO(2−1) emission in NGC 4593, developed using 3D-BAROLO software. The figure is divided into two panels: the left panel refers to the azimuthal normalised model, while the right one refers to the local normalised model. Each panel consists of a 3 × 3 grid of images (rows: intensity, velocity, dispersion; columns: data, model, residuals). The top row presents the CO(2−1) intensity maps across the field of view, with the colour bar representing the intensity scale in Jy km s−1 per beam units. The middle row shows the velocity maps, depicting the gas velocities across the field of view, with scale bar units in km/s. The bottom row displays the velocity dispersion of the CO(2−1) line across the field of view, also denoted in km/s. The left column in each panel shows the data, the middle column displays the model, and the right column provides the residuals.
Current usage metrics show cumulative count of Article Views (full-text article views including HTML views, PDF and ePub downloads, according to the available data) and Abstracts Views on Vision4Press platform.
Data correspond to usage on the plateform after 2015. The current usage metrics is available 48-96 hours after online publication and is updated daily on week days.
Initial download of the metrics may take a while.