Fig. 5.
Download original image
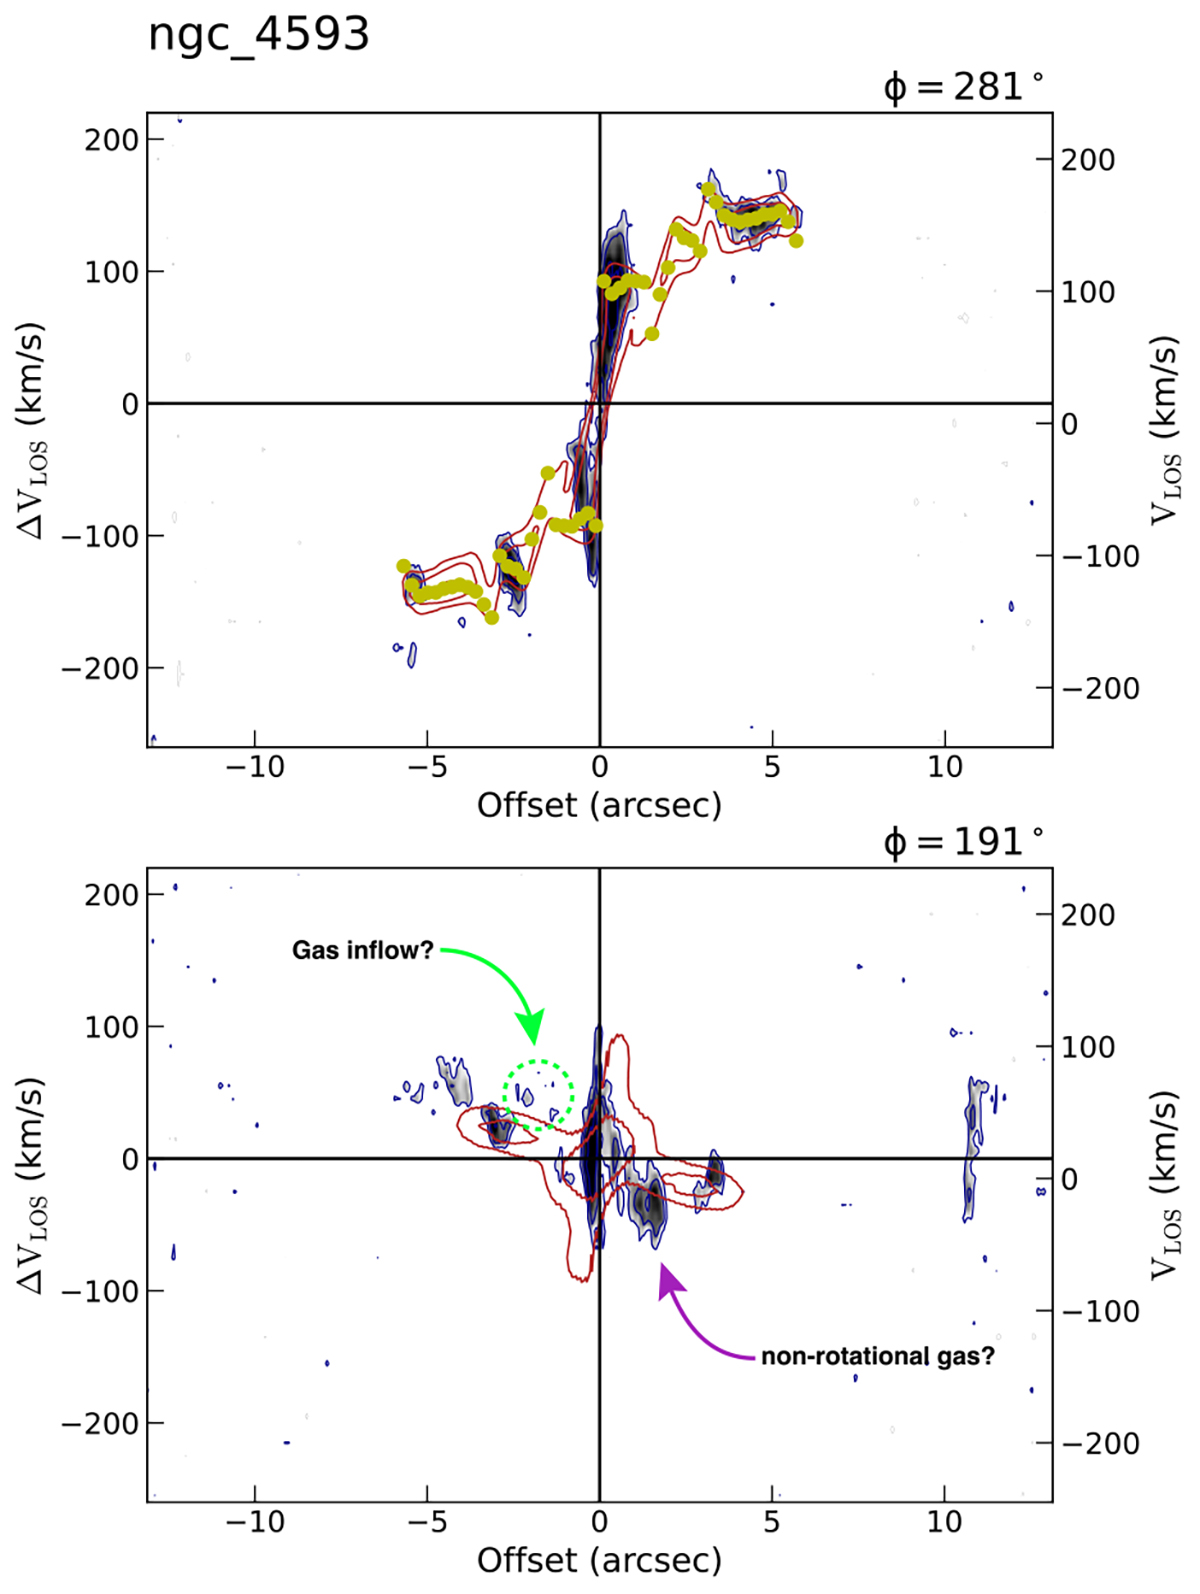
Position-velocity (p − v) diagrams of the CO(2−1) emission in NGC 4593, extracted from the data and 3D-BAROLO model along the major (top panel) and minor (bottom panel) axes. Blue solid contours illustrate the p − v diagram derived from the data cube, while red solid contours depict the p − v diagram from the model cube. The contour levels for both data and model are set at [1, 2, 4, 8, 16, 32, 64]×l, with l = 0.0012. In the top panel, yellow solid dots represent the rotation velocity of each ring from the best-fit disc model. The dashed light green circle in the bottom panel highlights the region where a potential gas inflow or outflow is located. These p − v diagrams facilitate the investigation of the spatial and kinematic structure of the CO(2−1) emission in NGC 4593.
Current usage metrics show cumulative count of Article Views (full-text article views including HTML views, PDF and ePub downloads, according to the available data) and Abstracts Views on Vision4Press platform.
Data correspond to usage on the plateform after 2015. The current usage metrics is available 48-96 hours after online publication and is updated daily on week days.
Initial download of the metrics may take a while.