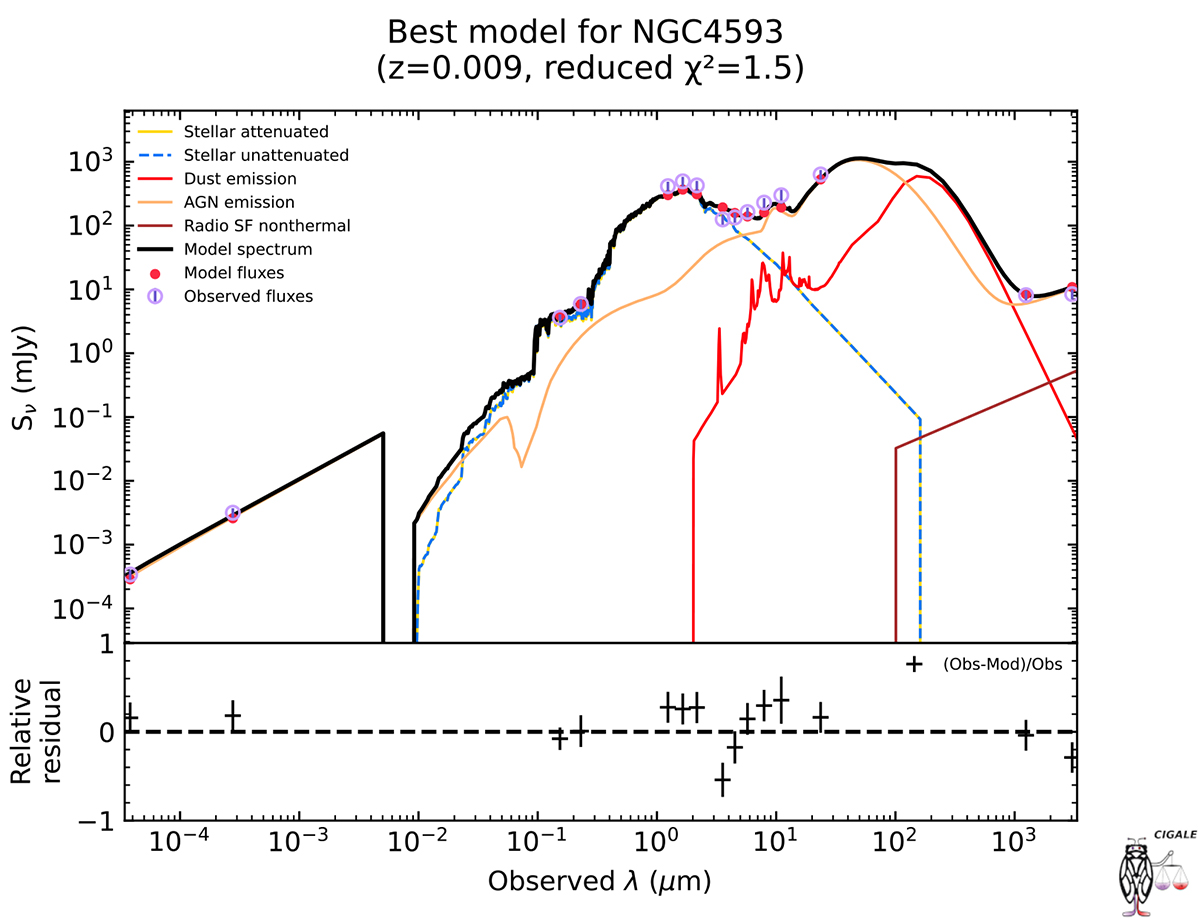
Fig. 10.
Download original image
SED of NGC 4593 derived using the CIGALE software. The plot shows the observed SED, indicated by red points, compared to the best-fit model represented by the solid black line. The constituent components of the model are illustrated as follows: dust emission (red line), AGN emission (orange line), and stellar emission, both attenuated (yellow dashed line) and unattenuated (blue dashed line). The vertical axis denotes the flux density Sν in mJy, while the horizontal axis represents the wavelength λ in μm. This SED plot provides a comprehensive view of the various emission components contributing to the observed radiation from NGC 4593.
Current usage metrics show cumulative count of Article Views (full-text article views including HTML views, PDF and ePub downloads, according to the available data) and Abstracts Views on Vision4Press platform.
Data correspond to usage on the plateform after 2015. The current usage metrics is available 48-96 hours after online publication and is updated daily on week days.
Initial download of the metrics may take a while.