| Issue |
A&A
Volume 691, November 2024
|
|
|---|---|---|
| Article Number | A352 | |
| Number of page(s) | 19 | |
| Section | Catalogs and data | |
| DOI | https://doi.org/10.1051/0004-6361/202450509 | |
| Published online | 27 November 2024 | |
PEWDD: A database of white dwarfs enriched by exo-planetary material
1
Department of Physics, University of Warwick,
Coventry
CV4 7AL,
UK
2
Centre for exo-planets and Habitability, University of Warwick,
Coventry
CV4 7AL,
UK
3
Center for Astrophysics | Harvard & Smithsonian,
60 Garden St.,
Cambridge,
MA
02138,
USA
★ Corresponding author; This email address is being protected from spambots. You need JavaScript enabled to view it.
Received:
25
April
2024
Accepted:
23
September
2024
Abstract
We present the Planetary Enriched White Dwarf Database (PEWDD), a collection of published photospheric abundances of white dwarfs accreting planetary debris alongside additional information relevant to metal-enrichment and the presence of infrared excesses, emission lines, and binary companions. At the time of publishing, PEWDD contains information on 1739 white dwarfs and will be kept up to date with information from new publications. A total of 24 photospheric metals are recorded and are linked to accretion of exo-planetary material. The overall properties of metal-enriched white dwarfs are severely affected by observational selection effects. In particular, we find that the metals that are detectable strongly correlate with the effective temperature. By considering metal-enriched white dwarfs that have abundances measured by different methods, we find a spread that is comparable with the often-quoted ad hoc estimated abundance uncertainties, namely ≃0.1−0.2 dex. We draw attention to a dichotomy in the median accretion rates for metal-enriched H- and He-dominated white dwarfs, with Ṁacc,H = 7.7 × 10⁷g s−1 and Ṁacc,He = 8.7 × 10⁸g s−1, when extrapolating bulk compositions from bulk Earth Ca abundance. We identified 40 metal-enriched white dwarfs in binary systems and find evidence that enrichment is suppressed by binary companions within 200 au.
Key words: planets and satellites: composition / stars: abundances / white dwarfs
NASA Hubble Fellow.
© The Authors 2024
 Open Access article, published by EDP Sciences, under the terms of the Creative Commons Attribution License (https://creativecommons.org/licenses/by/4.0), which permits unrestricted use, distribution, and reproduction in any medium, provided the original work is properly cited.
This article is published in open access under the Subscribe to Open model. This email address is being protected from spambots. You need JavaScript enabled to view it. to support open access publication.
1 Introduction
The final evolutionary stage of 97% of main-sequence stars is a white dwarf, an electron degenerate star with such high surface gravity that all elements heavier than He (from now on metals) rapidly diffuse downwards, leaving a purely H- or He-dominated atmosphere (Fontaine & Michaud 1979). However, many white dwarfs are enriched with traces of photospheric metals in their atmosphere (van Maanen 1917; Zuckerman et al. 2003, 2010; Koester et al. 2014a; Hollands et al. 2017). This metal enrichment posed a serious puzzle since the abundances of metals were too high to be explained by accretion from the interstellar medium (Koester 1976; Wesemael 1979; Dupuis et al. 1993) or radiative levitation alone (Chayer et al. 1995). An infrared excess discovered at the white dwarf G 29-38 (Zuckerman & Becklin 1987) led to the realisation that the metal enrichment arises from the disruption and subsequent accretion of asteroids (Jura 2003). The identification of many additional circumstellar debris discs around other metal-enriched white dwarfs corroborated this scenario (Becklin et al. 2005; Kilic & Redfield 2007; Jura et al. 2007; Farihi et al. 2009).
Exo-planets, or exo-asteroids, can survive the red giant branch phase of stellar evolution if located far enough away from the star, and there are dynamical pathways through which they can be scattered towards the white dwarf (Antoniadou & Veras 2016; Mustill et al. 2018; Veras et al. 2022). Once within the Roche radius, the asteroids are disrupted by tidal forces, forming a circumstellar disc, and material is then accreted by the white dwarf (Bochkarev & Rafikov 2011). Material impacting the white dwarf surface has been directly observed using X-rays (Cunningham et al. 2022). Metal enrichment indicating planetary accretion implies that the discovery of photospheric Ca in the spectrum of the white dwarf van Maanen 2 in 1917 was the first trace of an exo-planetary system (Zuckerman 2015).
Analysis of metal-enriched white dwarfs can provide detailed information on the bulk composition of exo-planets that is unobtainable by any other method. Measuring parent body compositions was first pioneered in Zuckerman et al. (2007), where state-of-the-art atmospheric models (e.g. Koester 2009; Dufour et al. 2010; Blouin et al. 2018a) are used to measure the photospheric metal abundances from the analysis of optical or UV spectroscopy. By considering the equilibrium between the downward diffusion flux and the accretion rate into the white dwarf atmosphere, the chemical composition of accreted material can be determined (Koester 2009). A large diversity of exo-planetary material has been identified, ranging from material resembling bulk Earth or chondrites (e.g. Izquierdo et al. 2021; Doyle et al. 2023; Trierweiler et al. 2023); material rich in core-like (e.g. Melis et al. 2011; Wilson et al. 2015), mantle-like (e.g. Zuckerman et al. 2011; Melis & Dufour 2017), or crust-like material (e.g. Hollands et al. 2021); hydrated asteroids (e.g. Farihi et al. 2013; Gentile Fusillo et al. 2017; Hoskin et al. 2020); icy objects (e.g. Xu et al. 2017; Klein et al. 2021; Doyle et al. 2021); and even the atmosphere from an evaporating giant planet (e.g. Gänsicke et al. 2019).
In this paper, we introduce the Planetary Enriched White Dwarf Database (PEWDD), which gathers information about white dwarfs that were identified to be metal enriched by planetary material from the literature. Unlike previous large-scale studies of metal-enriched white dwarfs that were focused either on a single element (e.g. Ca in Coutu et al. 2019) or very specific samples of white dwarfs (e.g. Koester et al. 2014a; Hollands et al. 2017, 2018a), PEWDD contains the published information on all detected metals across the entire range where the accretion of planetary debris is the currently preferred interpretation for a given system. This is a heterogeneous sample biased towards brighter white dwarfs and where observations with higher spectral resolution and a greater S/N facilitate the detection of multiple elements. Nevertheless, this collection of the abundances of exo-planetary material already enables powerful statistical analyses, and its scientific potential will grow as additional systems are discovered and analysed.
The information available in PEWDD and a discussion on how to make use of it are given in Sect. 2. Properties of metal-enriched white dwarfs and potential observational biases are explored in Sect. 3. We provide code to create number abundance and mass fraction diagrams using PEWDD, and examples are given in Sect. 4. The spread in number abundances stemming from the use of different methods and observational data is investigated in Sect. 5. In Sect. 6, we discuss the accretion rate dichotomy, the mass of accreted material, and discs. In Sect. 7, we discuss magnetic metal-enriched white dwarfs, and in Sect. 8, we examine binaries. Conclusions are provided in Sect. 9.
2 Database structure
To be included in PEWDD, a white dwarf needs to have published photospheric abundances1, which are most likely the result of ongoing or recent accretion of planetary material2. At the time of publication, PEWDD contains 3501 unique abundance measurements of 1739 individual white dwarfs. There are more entries than white dwarfs due to cases where multiple papers study the same white dwarf, or papers that contain multiple abundance measurements using different parameters for a single white dwarf. Where available, we include additional physical parameters, such as the white dwarf effective temperature (Teff), surface gravity (log ɡ), dominant atmospheric element, mass (MWD), parallax, mixing zone (MZ) mass (MMZ), magnetic field (BWD) and their respective errors. Information relevant to the accretion process, such as metal accretion rates, sinking timescales and mass fractions is also provided, as are labels that indicate the presence of dusty or gaseous discs and the presence of binary companions.
To maximise portability, we distribute PEWDD as a .csv file and we provide PYTHON functions to convert that file into a PANDAS dataframe, which we recommend as the format for use. The PYTHON package3 also contains functions to generate a variety of diagrams exploring the content of PEWDD, examples of which are shown in Sect. 4. These functions can be called to include only a subset of the white dwarfs contained in PEWDD.
A description of each column in PEWDD is provided in Table 1. We store the information retrieved for a given star from a given publication as a .json file, transcribing the published data directly as stated in the literature. These files are converted into a PANDAS data-frame, with the only manipulation of data being a conversion of all parameters into common units. Individual stars are often referred to by multiple names, and although this means they are easily identifiable in the text of papers, we suggest that Gaia DR3 source_id values are also included when listing white dwarf parameters, as these are unique to each white dwarf. The Identifier column is unique to each entry. Some objects do not have a Gaia DR3 source_id, so right ascension and declination coordinates may be required to differentiate white dwarfs. We note that a number of well-studied white dwarfs have multiple published studies included in PEWDD, which may result in multiple abundance measurements for some elements, or abundances for different subsets of elements. Hence, investigating all entries for a given white dwarf will provide the most exhaustive overview of the properties of the planetary debris for any individual white dwarf. PEWDD can be cross-matched with other catalogues such as Gentile Fusillo et al. (2021b, hereafter GF21), using the Gaia DR3 IDs provided.
For white dwarfs that have multiple sets of abundances in a given paper, for example comparing different modelling assumptions (e.g. Xu et al. 2017), we create multiple .json files, and include a reference to the specific model in the star column. Published upper limits on abundances are indicated by ‘−1’ in the associated uncertainty, which implies that the inferred accretion rates also must be interpreted as upper limits. The comment column provides notes on the spectra, origin of information, and highlighted mistakes.
In this paper we investigate the observed trends and systematic errors associated with analyses of metal-enriched white dwarfs, and we expect that PEWDD will be a useful tool for the community. It can be used for future comparisons of newly published number abundances, since these can be compared to PEWDD to find similar white dwarfs or accreted bodies to identify the class of material or any outliers. PEWDD will be very useful for detailed investigations into the nature of the accreted material that use number abundances of large samples of metal-enriched white dwarfs (e.g. Bonsor et al. 2020; Harrison et al. 2021; Buchan et al. 2022). The exclusion of any paper that contains photospheric number abundances is not intentional.
PEWDD will be updated in the future as more abundances are published for metal-enriched white dwarfs. We urge that these abundances are presented in a clear way in a table with associated uncertainties. If accretion rates are provided, sinking timescales should be included. The convective zone (CVZ) mass is an important property that should be quoted if it is used in calculations. We recommend that in future abundance studies upper limits for quantities are provided wherever possible to help constrain the nature of the accreted material. The increasing and decreasing accretion rates might be included if sinking timescales are sufficiently long that they are a likely accretion phase, such as in He-dominated atmospheres.
For comparison, the Montreal White Dwarf Database (MWDD, Dufour et al. 2017) contains data and parameters for over 70 000 white dwarfs of all spectral types, with parameters and spectra publicly accessible. However, MWDD aims to contain information on all white dwarfs, which naturally means it is less complete. Many detailed debris abundance studies focus on a single or a small number of white dwarfs, which are not included within MWDD at the time of writing (e.g. Kawka & Vennes 2012; Raddi et al. 2015; Farihi et al. 2016; Xu et al. 2017; Gentile Fusillo et al. 2017; Hollands et al. 2021; Izquierdo et al. 2021; Klein et al. 2021; Johnson et al. 2022). In contrast, PEWDD aims to be complete with respect to studies of planetary enrichment of white dwarfs, which is possible to manage as there are much fewer objects. As such, we believe that PEWDD and MWDD are complementary to each other.
Format of PEWDD we present in this work.
Example of a database entry.
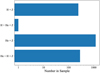 |
Fig. 1 Atmospheric composition of the white dwarfs in PEWDD. “H + Z” and “He + Z” have atmospheres dominated by H and He, respectively, with traces of metals. The white dwarfs with “H + He + Z” and “He + H + Z” have H- or He-dominated atmospheres with traces of both metals and He or H, respectively. |
3 Trends in metal-enriched white dwarf properties
3.1 Atmospheric composition
Metal-enriched He-dominated white dwarfs outnumber their H-dominated counterparts in PEWDD (Fig. 1), even though H-atmosphere white dwarfs are much more common than their He-atmosphere counterparts (O’Brien et al. 2024). The reduced opacity of He compared to that of H allows for much lower pho-tospheric metal abundances to be detected in He-atmospheres.
Conversely, the diffusion timescales on which metals sink out are much longer in He-dominated white dwarfs (≃104–106yr) than in H-dominated white dwarfs (≃days to years; Koester 2009), implying that metals from past accretion episodes can still be detected in He-dominated white dwarfs, whereas metal-enrichment in H-dominated white dwarfs usually implies ongoing accretion. Both effects are responsible for boosting the number of metal-enriched He-dominated white dwarfs4. Detections of H in He-dominated atmospheres could be due to accretion of water-rich material (e.g. Wolff et al. 2000; Gentile Fusillo et al. 2017) or white dwarf spectral evolution (Koester & Kepler 2015; Bédard 2024). Vice versa, in rare instances, He may be accreted from a giant planet into the atmosphere of an H-dominated white dwarf.
3.2 Statistics of metal detection
3.2.1 Geochemical properties
A total of 24 different metals have been detected in white dwarf photospheres, and the number of published detections per element is illustrated as a periodic table in Fig. 2. The coloured boxes in Fig. 2 represent the Goldschmidt geochemical classes of metals (Goldschmidt 1937), and can indicate the type of material that has been accreted. Lithophiles (silicate-loving) such as Mg, Si and Ca tend to form silicate rocky material, and can be used to trace exo-planetary mantles and crusts. Siderophiles (iron-loving) like Co or Ni interact with Fe and sink towards the centre of bodies, so can be used to identify core material. Some metals such as P, Cr and Mn can show both lithophilic and siderophilic characteristics since they can exist bonded to both iron and silicates. Chalcophiles (sulfur-loving) react with S and do not sink into the core, so are tracers of mantle material. The relative abundance of these types of metals in accreted material can determine whether the body is core-, mantle-, or crust-rich and hence if the body is differentiated or primitive (Bonsor et al. 2020). Atmophiles (gas-loving) are volatile metals and are often in a gaseous state, leading to depletion of this type in rocky material. This explains the low number of white dwarfs that show atmophile species enrichment. Additionally, weaker absorption features along with interstellar line contamination mean that these detections are often more difficult (Wilson et al. 2016).
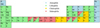 |
Fig. 2 Periodic table highlighting the frequency of metal detection in metal-enriched white dwarfs. The number in each box represents how many white dwarfs have detections of that photospheric metal. The colours represent the Goldschmidt classification (Goldschmidt 1937), which groups metals into their geochemical preferences with atmophiles (gas-loving; blue), lithophiles (silicate-loving; green), chalcophiles (sulfur-loving; yellow) and siderophiles (iron-loving; red). Metals that have two colours within their box exhibit both siderophilic and lithophilic characteristics. The box containing H indicates the number of He-atmosphere white dwarfs with trace-H detections and vice versa for the box with He. |
3.2.2 Correlations with effective temperature
From Fig. 2, it is apparent that the number of detections varies greatly between the individual elements. The detection of an element depends on its abundance in the white dwarf atmosphere and the strength of its spectral features in the observed wavelength range. In turn, the latter strongly depends on the ionisation and excitation balance within the atmosphere and hence on the temperature of the star. We note that, with a few exceptions (e.g. Xu et al. 2017; Gänsicke et al. 2019), bulk abundances across various metal-enriched white dwarfs do not vary greatly, analogous to the small spread of stellar abundances (Payne 1925). Instead, the differences in the detectability of a given metal reflect the conditions in the white dwarf atmosphere.
The distribution of detections of the individual elements is shown as a function of Teff in Fig. 3. As the Ca II H/K resonance lines are the strongest features in the optical spectra of white dwarfs with Teff ≲ 18 000K, Ca is the most common element found in PEWDD. It is detected in 94.5% of all metal-enriched white dwarfs – even though the mass fraction of Ca is only ≃1.7% in the bulk Earth (McDonough 2000). Therefore, with the exception of the hottest white dwarfs, the distribution of Ca detections as a function of white dwarf temperature is nearly identical to that of all metals. The next most frequently detected metals are Mg (≃15.5% of the bulk Earth) and Fe (≃31.9% of the bulk Earth), both of which have strong lines at optical wavelengths. Other common elements such as O (≃29.7% of the Bulk Earth) and Si (≃16.1% of the bulk Earth) have weak or no lines in the optical spectra of cool white dwarfs (Teff ≲ 13 000 K), and they are therefore only rarely detected but are more commonly found in UV observations of hotter white dwarfs. The same is true for volatile elements (C, N, S, P). For hotter white dwarfs, the far-UV is generally much better suited than the optical, as it provides a plethora of strong transitions of most elements. However, the Hubble Space Telescope (HST) is currently the only facility providing access to far-UV spectroscopy, hence limiting the number of white dwarfs observed in that wavelength range. The detectability of metals is strongly correlated to Teff, as the temperature at which the resonance transitions can be ionised gives the highest chance of that metal being observed.
The upper and lower bounds on the measured photospheric abundances of the various metals detected in white dwarfs are shown in Fig. 4. The volatiles N, P and S have high lower bounds, suggesting that they require a substantial photospheric abundance to be observed. In contrast, Li, Be and K are detected only in a small number of stars, and always at low abundances, implying that their mass fractions in the accreted material are small. Some metals vary over many orders of magnitude, implying that these can be detected over almost all accretion rates. The metal with the largest detected abundance is O in WD 1536+520 at log(O/He) = −3.40 ± 0.20, which is likely accreting a water-rich body (Farihi et al. 2016). The ultra-cool WDJ2147–4035 holds the record for the lowest observed number abundance in PEWDD, with log(Ca/He) = −13.96 ± 0.2 (Elms et al. 2022). Thus, the metal abundances within PEWDD span over ten orders of magnitude.
The number of metals observed in a white dwarf atmosphere is often limited by the resolution of the spectra. Due to the strength of the Ca II line as a powerful tracer of metal-enrichment, even low resolution spectra can determine whether a white dwarf is accreting. The larger number of low-resolution spectra contributes to fewer metals being observed in many white dwarfs, often only Ca5. These factors largely explain the strong bias towards the large number of only Ca detections evidenced in Figs. 2 and 5. Most of these white dwarfs are very likely accreting material containing dozens of further metals.
Only 25% of the stars within PEWWD have more than one element detected, among which we note a deficiency in metal-enriched white dwarfs with only two detected photospheric metals (Fig. 5). This is a consequence of better quality data revealing usually several additional species beyond Ca, particularly Mg and Fe (e.g. Hollands et al. 2017; Blouin 2020). For white dwarfs with four or five unique species, Na, Si and Cr become more common. Larger numbers of elements are found in white dwarfs that are strongly enriched (e.g. Raddi et al. 2015; Farihi et al. 2016; Gentile Fusillo et al. 2017), have high resolution spectra (e.g. Klein et al. 2010; Zuckerman et al. 2011) or cool He-dominated stars with moderately large amount of metals detectable at low resolution (e.g. Hollands et al. 2017).
As shown above, metal-enriched white dwarfs exhibit a large variety with respect to how many, and which elements can be detected, and their individual abundances. The most diversely metal-enriched white dwarf is GD 362 with 16 metals in its atmosphere (Zuckerman et al. 2007; Xu et al. 2013), with the accreted material resembling bulk Earth in terms of its composition. Photospheric Zn is only detected in the hot white dwarf HS 0209+0832 (Wolff et al. 2000, Williams et al. in prep). Be is the most recently discovered photospheric metal (Klein et al. 2021). The next metals that may be detected considering the strength of their absorption features and bulk Earth abundance are B, Ga and Ge.
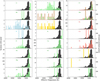 |
Fig. 3 Number of detections of individual elements as a function of Teff. The colours are related to the Goldschmidt classification, as described in Fig. 2. The black histograms show the temperature distribution for all metal detections, normalised to match that of the individual elements. |
 |
Fig. 4 Upper and lower abundance bounds for all metals detected in H- (blue) and He- (orange) dominated white dwarf atmospheres. The absence of a bound means that the metal has not been observed (Be and Co in a H-dominated white dwarf atmosphere). The single dashes represent metals that have only been detected in a single white dwarf of a certain atmosphere composition. |
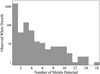 |
Fig. 5 Frequency of metal-enriched white dwarfs as a function of detected photospheric metals. White dwarfs with multiple abundance analyses are combined to find the total number of metals for each object. H and He are not counted. |
3.2.3 Metals in hot white dwarfs
Our knowledge regarding planetary enrichment in hot (Teſſ ≳ 25 000 K) and young white dwarfs is so far limited. Most hot white dwarf exhibit photospheric metals (Barstow et al. 2003) including exotic elements such as Xe and Kr (Werner et al. 2012), Br and Sb (Werner et al. 2018) and Cs (Chayer et al. 2023). However, the origin of these elements remains debated: historically, radiative levitation counteracting the downward diffusion of metals (e.g. Chayer et al. 1995) has been the favourite model to explain the detection of photospheric metals in hot white dwarfs, even though it was recognised early on that the predicted abundances of individual elements did not agree with the observations (Chayer et al. 1994; Wolff et al. 2000). At very high temperatures (Teff ≳ 75 000 K) gravitational settling is very likely incomplete (Werner et al. 2015, 2018), preventing the study of planetary enrichment in these youngest (≲ 5 Myr) white dwarfs. For intermediate temperatures, Teff ≃ 25 000-75 000 K), Barstow et al. (2014) demonstrated that external enrichment plays an important role for the photospheric abundances of white dwarfs. However, the effect of radiative levitation has to be taken into account when establishing the abundances of accreted material (Chayer & Dupuis 2010; Koester et al. 2014a).
In addition to the physical complications within the atmospheres of hot white dwarfs, the origin of material enriching them (where an unambiguous case can be made) is not well established. The distance from the white dwarf at which dust particles will sublimate increases with Teff. Depending on the sublimation temperature of the dust (Rafikov & Garmilla 2012), the location of the sublimation radius moves beyond the tidal disruption radius for Teff ≃ 25 000–30 000 K (von Hippel et al. 2007), and it is thought that hotter stars cannot host a dusty disc that could feed material onto the white dwarf over extended periods of time. However, hot white dwarfs may photo-evaporate close-in giant planets (Schreiber et al. 2019; Gallo et al. 2024). WD J091405.30+191412.25 (Gänsicke et al. 2019) is currently the only confirmed system, but several other hot stars show unusual photospheric enrichment (e.g. GD394, Wilson et al. 2019a; HS 0209+0832, Wolff et al. 2000).
4 Relative abundances
Discussing the nature of the accreted material often involves inspecting diagrams involving two different abundance ratios, comparing the measurements obtained from modelling the spectroscopy of white dwarfs to those of a reference composition (e.g. Fig. 7 in Gänsicke et al. 2012; Fig. 3 in Swan et al. 2019; Fig. 9 in Izquierdo et al. 2021; Fig. 2 in Hollands et al. 2021; Fig. 11 in Klein et al. 2021). In this section, we refer to “abundance” as the parent body composition, which is calculated by correcting the photospheric abundances by the relative diffusion timescales. These diagrams often, but not always involve the same denominator of the ratios on both axes. Using meteorite abundance data (bulk Earth and bulk Silicate Earth, McDonough 2000; solar abundances and CI chondrites, Lodders 2003 and various meteorite classes, Nittler et al. 2004) as abundance references, the type of the accreted planetary material can hence be constrained. With measured accretion rates, Eq. (1) gives an example of calculating the abundance ratios with respect to Si, where A is the atomic mass, though other reference metals such as Mg or Fe are also frequently used. We provide code and a guide to use the functions in order to quickly construct this type of diagram with a set of white dwarfs and reference compositions6 chosen by the user (Allègre et al. 2001; McDonough 2000; Lodders 2003; Nittler et al. 2004; Asplund et al. 2005):
 (1)
(1)
An example of an abundance ratio diagram comparing O/Si to Fe/Si is shown in Fig. 6. Comparing these two ratios is useful since all three are major rock-forming elements and Fe may also occur in metallic form in the differentiated cores of larger planetary bodies.
It is evident from inspection of Fig. 2 that although O is a major building block of terrestrial planets, it is difficult to detect in white dwarf atmospheres. GD 362 only has an upper limit on O which is represented by an arrow pointing along a O-poor direction. SDSS J095645.14+591240.6 is located far from the region occupied by Solar System objects, since it is observed in the decreasing phase (Swan et al. 2023). Even though the uncertainties on the abundance ratios measured from the analysis of white dwarfs are much larger than those of the solar-system reference compositions, these types of diagrams are useful to infer the types of parent bodies accreted by white dwarfs, and the work carried out so far clearly demonstrates that many white dwarfs disrupted planetary objects with compositions similar to what is common within the inner Solar System.
For white dwarfs with He-dominated atmospheres, the phase of accretion must be considered. In a simplistic model assuming that an accretion event starts instantaneously, provides a constant accretion rate for a specific amount of time, and then switches off instantaneously, there are three well-defined phases (Koester 2009): the increasing (build-up) phase, steady-state phase and the decreasing phase (a brief description is provided in Table 1 and a more detailed discussion in Farihi 2016). In the decreasing phase, the abundance ratio measured at a time t is related to that at time time that accretion stopped, t0 via
 (2)
(2)
Metals with short (long) sinking timescales would have had larger (smaller) abundances in the accreted material compared to the measured photospheric abundances, since heavier metals would have sunk out of the bottom of the convection zone faster (slower). If the sinking timescales of a white dwarf are comparable to the estimated disc life times (≃104−106yr, Girven et al. 2012; Cunningham et al. 2021), the possibility of the system being in one of these three phases should be explored, as illustrated by the tracks in Fig. 6. Each small point on these tracks represents the abundances of the parent body if accretion had ceased one Si sinking timescale ago, using the time-dependent corrections from Eq. (2). In the case of WD J2047–1259, where τFe = 2.6 × 10³ yr and τSi = 4.7 × 10³ yr, more Fe than Si has sunk out of the atmosphere in the time elapsed since accretion turned off, so tracking the abundances back in time leads to larger Fe abundance in the parent body than the photospheric measurements suggest. The opposite is seen for log(O/Si), where τO = 7.0 × 10³ yr. Less O has sunk than Si, so the accreted body appears more O rich in the present-day measurement than it actually is (Hoskin et al. 2020). The length and direction of these tracks depends on the ratio of the sinking times. For example, the track of Ton 345 is nearly perpendicular to that of WD J2047–1259 since its sinking timescales are τ0 = 9.7 × 10³ yr, τSі = 12 × 103 yr and τFe = 8.7 × 10³ yr, meaning that the body will be more O rich than the photospheric measurement if accretion has stopped some time ago. Before claiming that a white dwarf accretes a planetesimal with an exotic composition, it is advisable to investigate if the system could be in the decreasing phase, and whether accretion ending a few diffusion timescales ago would bring it closer to counterparts in the Solar System - to date, the majority of white dwarfs with detailed analyses fall within these reference compositions (Jura & Young 2014; Trierweiler et al. 2023). Whereas the inspection of abundance ratio diagrams is a visual and intuitive diagnostic, more sophisticated methods employ Bayesian models to infer both the most likely accretion phase and abundances (e.g. Harrison et al. 2021, Swan et al. 2023).
If the abundances of the most common elements that make up rocky material have been measured7 (e.g. O, Si, Fe, Mg), the total accretion rate can be computed, as well as the mass fractions of the individual elements:
 (3)
(3)
These mass fractions can be instructive if displayed either as bar or pie charts, and Fig. 7 demonstrates that planetary bodies accreted by white dwarfs represent, just as meteorites in the Solar System, a large diversity in their compositions. GD 424 (assuming it is in the steady-state) is likely accreting material consistent with bulk Earth composition (Izquierdo et al. 2021). The material enriching PG 0843+516 (in the steady-state phase since sinking timescales in H-dominated atmospheres such as this white dwarf are so low) is enhanced in Fe compared to the bulk Earth material and has likely undergone partial melting and differentiation, with a core fragment being now accreted by the white dwarf (Gänsicke et al. 2012). In contrast, SDSS J104341.54+085558.1 is depleted in Fe with respect to the bulk Earth and is hence accreting a mantle fragment (Melis & Dufour 2017). G 238-44 has one of the most unusual compositions, rich in O, Mg and Fe, speculated to be the simultaneous accretion of an iron-Mercury-like object and an icy Kuiper Beltlike object (Johnson et al. 2022). WD J2047 – 1259 (also known as EC 20444 – 1310; Hoskin et al. 2020) has likely accreted a carbonaceous chondrite, particularly rich in O, suggesting the presence of water, but depleted in Fe and Ni, so likely an object that has not undergone differentiation. Finally, WD 1425+540 (Xu et al. 2017) is one of the very few white dwarfs displaying large abundances of volatiles, such as C, N, and O, and observed to have an N abundance similar to that of comets. These mass fraction diagrams can be produced using the code we provide.
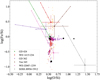 |
Fig. 6 Abundance ratio diagram comparing O and Fe with the reference metal Si. The coloured dots are different classes of meteorites (Nittler et al. 2004) and the black symbols are large Solar System objects (McDonough 2000; Lodders 2003, CI = chondrites and BSE = bulk silicate Earth). Six metal-enriched white dwarfs with diverse abundances are shown as examples (GD 424, Izquierdo et al. 2021; WD 1415+234, Doyle et al. 2023; GD 362, Xu et al. 2013; Ton 345, Wilson et al. 2015; EC 20444−1310 also known as WD 2047−1259, Hoskin et al. 2020, and SDSS J095645.14+591240.6, Hollands et al. 2022). The diagonal lines track the abundances back through time, assuming the star is observed in the decreasing phase. Each small point on the diagonal line represents the corrected abundance of the accreted body if accretion had ceased one Si sinking timescale ago. Diagrams like this can be created with any combination of metals available within PEWDD and the PYTHON code that we provide. The evolutionary lines require that the sinking timescales were published as well. |
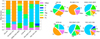 |
Fig. 7 Mass fractions for six parent bodies accreted onto white dwarfs. The white dwarfs shown as bar charts on the left and pie charts on the right, illustrate the diversity in compositions: bulk Earth for GD 424 (Izquierdo et al. 2021); core-rich material for PG 0843+516 (Gänsicke et al. 2012); mantle- and crust-rich material for SDSS J104341.54+085558.1 (Melis & Dufour 2017); an unusual composition for G 238-44 – likely a combination of an iron-rich and icy object (Johnson et al. 2022); a hydrated carbonaceous chondrite for EC 20444 – 1310 (also known as WD J2047 – 1259; Hoskin et al. 2020); and a comet for WD 1425+540 (Xu et al. 2017). These diagrams were created using PEWDD and the PYTHON code that we provide. |
5 Variations in the photospheric abundances
The photospheric abundances are determined by fitting a synthetic spectrum generated by an atmospheric model to an observed spectrum. Applying this method to different data sets of the same star, or using different models may lead to different results, for a number of underlying reasons: (1) fitting spectroscopy or photometry plus astrometry provides the fundamental atmospheric parameters of a white dwarf, Teff and log 𝑔, and changes in these parameters directly affect the resulting abundances (Izquierdo et al. 2023). However, as long as the changes in Teff and log 𝑔 are sufficiently small, the relative abundances (i.e. element ratios) remain largely unaltered. (2) Different input physics within the model atmosphere code can affect both Teff and log 𝑔, as well as the derived abundances (e.g. Koester 2010; Blouin 2020). Great care has to be taken specifically in the case of heavily enriched white dwarfs to account appropriately for the blanketing effect of spectral lines across the entire wavelength range of the model. (3) The observations used to measure the abundances that are included in PEWDD cover different wavelength ranges, spectral resolutions, instruments and S/Ns. As such, PEWDD is a heterogeneous database that provides the opportunity to investigate the impact that different models and data sets have on the photospheric abundances.
Another important aspect where authors use different approaches is the estimation of the uncertainties of the measured abundances. An ad-hoc method is to vary the fit until it is clearly incompatible with the data that typically results in uncertainties of ≃0.1–0.3 dex (e.g. Gänsicke et al. 2012; Koester et al. 2014a). Alternatively, the differences in the abundances arising from fitting to different spectral lines (e.g. Dufour et al. 2010; Xu et al. 2019) can be investigated, or statistical errors can be determined (e.g. Tremblay et al. 2020), typically leading to uncertainties of ≃0.01–0.05 dex. Finally, some authors will attempt to propagate the uncertainties in Teff and log 𝑔 into the abundance errors. There is, as of now, no agreement on the “best practice” to determine abundance errors.
Here, we use PEWDD to investigate both the variations in abundances as well as the uncertainties provided in the literature. For that purpose, we define the spread of the abundances as follows: for a white dwarf with multiple measurements within PEWDD, we calculate the standard deviation for all abundances for each metal. Then we compute, for a given element, the median of these standard deviations across all white dwarfs for which that element has multiple measurements to find the spread. We also compute, for each element, the median of all published uncertainties. Figure 8 compares the spread of the abundances with the median errors. For most metals, the spread varies between 0.1–0.3 dex, generally consistent with the quoted ad-hoc errors, but substantially larger than the statistically determined errors. Some metals (e.g. Li, Co, Sr) have a very large spread, which is a reflection of the small number of white dwarfs where these elements have been detected, and/or that these metals have comparatively weak spectral lines. The three most frequently detected metals are Mg, Ca and Fe, all three have relatively low spreads, <0.3 dex, similar to the quoted errors.
We pick four well-studied metal-enriched white dwarfs to illustrate the relatively minor spread of the abundances measured by up to five different works. The sets of Si and Fe abundances measured for the DAZ white dwarf GALEX J193156.8+011745 are in fairly good agreement (Fig. 9, upper left). The DBAZ white dwarf GD 378 (Fig. 9, upper right) illustrates the improvement in the determination of abundances, where Desharnais et al. (2008) and Klein et al. (2021) detect Fe whereas the data of the earlier study Wolff et al. (2002) was not of sufficient quality. The abundances for Ca vary by a large amount, although they also have large associated errors. Advancements in atmospheric modelling may also contribute to these differences. PG 1015+161 is an example where the published abundances agree well within quoted errors (Fig. 9, bottom left). Finally, the DBZ white dwarf GD 40 (Fig. 9, bottom right) was subject to analyses over multiple decades, with improvements in observations and modelling leading to abundances converging to an agreed value.
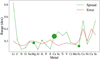 |
Fig. 8 Spread of abundances for each metal detected in a white dwarf atmosphere (green) compared to the median of the quoted errors (red). The size of each point represents the number of measurements that were used to calculate each spread on the metal, with larger points representing more measurements. |
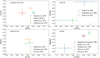 |
Fig. 9 Comparison of abundances taken from different studies of the same white dwarfs. The figure illustrates the range of measurements obtained due to using different observations and models. Each axis is 2 dex wide. The upper-left panel shows Si and Fe photospheric abundances for GALEX J193156.8+011745 (Vennes et al. 2010; Melis et al. 2011; Vennes et al. 2011; Gänsicke et al. 2012). The upper-right panel shows Ca and Fe photospheric abundances for GD 378 (Dupuis et al. 1993; Wolff et al. 2002; Desharnais et al. 2008; Klein et al. 2021). The bottom-left panel presents photospheric Ca and Mg abundances for PG 1015+161 (Kawka et al. 2011; Gänsicke et al. 2012; Xu et al. 2019). The bottom-right panel contains photospheric abundances of Fe and Mg for GD 40 (Shipman & Greenstein 1983; Dupuis et al. 1993; Friedrich et al. 1999; Klein et al. 2010; Jura et al. 2012). |
6 Accretion rates
6.1 Total accretion rate dichotomy
Many white dwarfs accrete material with approximately bulk Earth composition (Trierweiler et al. 2023) and almost every metal-enriched white dwarf has a detection of Ca (see Fig. 2). Often the total accretion rate is calculated by scaling from the Ca accretion rate, considering the mass fraction of Ca in bulk Earth of 1.71% (McDonough 2000). Using published total accretion rates or extrapolating from bulk Earth mass fractions of Ca or Si (16.1%), we investigate the relationship between Teff and total accretion rate, similar to Blouin & Xu (2022).
To assess the validity of the total accretion rates computed from a single detected element, we compare in the right panel of Fig. 10 two methods of calculating the total accretion rate. The first, represented by the hexagons, scales the accretion rate using Ca, and the second sums the accretion rates of O, Si, Mg, and Fe, which compose 95% of the mass of bulk Earth (McDonough 2000). Assuming bulk Earth composition for the parent body and steady-state accretion, we expect these accretion rates to agree. Discrepancies are explained by enhancements or depletions with respect to bulk Earth composition. There is a greater disagreement between the two methods for He-dominated white dwarfs (〈Ṁacc,total – Ṁacc,scaied〉He = 0.38 dex) compared to H-dominated white dwarfs 〈Ṁacc,total – Ṁacc,scaied〉He = 0.33 dex) due to the former more likely being observed in the decreasing phase, where differential sinking results in an apparent enhancement of slow-sinking heavier metals relative to lighter metals. This reduces the usefulness of accretion rates measured from cool He-dominated white dwarfs.
The current understanding of the origin of the accreted material is that a planetary body is scattered towards the white dwarf, then disrupted when entering the Roche radius forming an eccentric ring of debris which eventually circularises and finally forms a circumstellar disc (Jura 2003; Veras et al. 2014b, 2015; Malamud et al. 2021). Material is then gradually accreted onto the white dwarf, driven by Poynting-Robertson (PR) drag and/or viscous forces in the disc (Rafikov 2011; Metzger et al. 2012). The physical processes involved in the initial disruption and subsequent accretion should be independent of the white dwarf atmospheric composition, and so it is expected that the total accretion rates should be equal for all spectral types. Nevertheless, the left panel of Fig. 10 reveals a dichotomy of accretion rates onto H- and He-atmosphere white dwarfs, with median accretion rates of Ṁacc, H = 7.7 × 10⁷ g s−1 and Ṁacc, He = 8.7 × 10⁸ g s−1, respectively. This discrepancy has been noted previously (Farihi et al. 2012; Bergfors et al. 2014), but there is currently no consensus on its physical origin. For hot white dwarfs (Teff ≳ 17 000 K), Ca loses its efficacy as a tracer of enrichment since its strength decreases with increasing temperature as Ca II is ionised to Ca III (Gänsicke et al. 2012).
Considering PR drag being the primary mechanism fortransporting material from the circumstellar disc to the surface of the white dwarf, the maximum accretion rate is Ṁacc ≃ 108–109 g s−1 (Rafikov 2011; Brouwers et al. 2022) – consistent with the rates onto H-atmospheres, but much lower than those onto He-atmospheres. Either some aspect of the entire disruption or accretion process onto the white dwarf is not fully understood or the method of calculating accretion rates is flawed. Since accretion rates are equal to the diffusion rate in the steady-state phase, the accuracy of sinking timescales and the mass of the CVZ could lead to inaccurate results.
Periods of intense accretion could explain the accretion rate dichotomy (Farihi et al. 2012). Because of the short sinking timescales of H-atmospheres (days to ≃ 103 yr, Koester 2009), short (~ 1–100 yr) but intense bursts during which accretion rate increases by orders of magnitude would be difficult to be detected. For He-atmospheres, the measured accretion rates are time-averages over the sinking timescales of ≃104–106 yr, preserving the signature of intense accretion bursts in the form of higher photospheric abundances. At least two possible physical models for burst-like accretion have been put forward. Brouwers et al. (2022) argued that the disruption of large asteroids creates more fragments, leading to more collisions and a rapid grind-down producing dust, causing accretion to occur at a high rate over a short amount of time. Smaller asteroids produce fewer fragments, leading to fewer collisions producing dust, so accretion occurs over a longer times but at a lower rate. Therefore, they postulate that we observe the ongoing accretion of small asteroids onto H-dominated white dwarfs but can detect the traces of intense accretion events from large asteroids in the atmospheres of He-dominated white dwarfs. Alternatively, Rafikov (2011); Metzger et al. (2012) discussed a scenario in which the accretion rate is initially driven by PR, but as dust particles sublimate, gas drag begins to enhance the accretion rate, resulting in a runaway accretion event; Okuya et al. (2023) presents an alternative discussion of the dust-gas interactions resulting in enhanced accretion rates with respect to PR drag. Whether high-accretion-rate bursts are actually happening is unknown, and the above discussion highlights one fundamental shortcoming in the current interpretation of atmospheric abundances, namely, the accretion rate onto the white dwarf is constant during the accretion episode.
Another explanation for the dichotomy in the accretion rates is that some of the physics relevant to diffusion and convection within the white dwarf atmospheres and envelopes are not fully understood, and a number of possible extensions to the standard framework have been published. Convective overshoot in DAZs (Cunningham et al. 2019) increases the total accretion rate by up to an order of magnitude for white dwarfs with Teff < 18 000 K. The X-ray observations of the prototypical metal-enriched G29-38 appear to confirm the predictions of the overshoot model (Cunningham et al. 2022), thus potentially bringing the accretion rates for H-dominated white dwarfs closer but not quite up to those of He-dominated white dwarfs. Another, even more extreme enhancement of the accretion rates in H-atmosphere white dwarfs is predicted for the case of thermohaline convection (Deal et al. 2013; Wachlin et al. 2022; Dwomoh & Bauer 2023). However, whether this type of convection is physically possible remains debated (Koester 2015). A final note concerning the analysis of H-dominated atmospheres is that radiative levitation becomes increasingly important for Teff ≳ 18 000 K, adding another systematic uncertainty in the determination of the accretion rates (Koester et al. 2014a). In conclusion, measuring the absolute values and the time-dependence of the accretion rates onto metal-enriched white dwarfs remains a difficult endeavour.
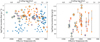 |
Fig. 10 Total accretion rates onto white dwarfs with H- (blue hexagons) and He- (orange pentagons) dominated atmospheres as a function of temperature. The left panel shows total accretion rates extrapolated from that of ṀCa (or ṀSi if Ca was not detected), assuming that the accreted material has bulk Earth abundance (McDonough 2000) with a Ca (Si) mass fraction of 1.71% (16%). The red rings and green diamonds highlight the systems where infrared excesses and gas emission have been detected respectively, implying the presence of a circumstellar disc. The right panel compares the extrapolated total accretion rate to the sum of the accretion rates of O, Mg, Si and Fe, which make up approximately 95% of the bulk Earth, represented by stars. |
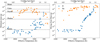 |
Fig. 11 Minimum masses of accreted material within white dwarf atmospheres as a function of temperature. The left panel shows the minimum mass of planetary material in the mixing zones of H- and He-dominated white dwarfs, represented by blue hexagons and orange pentagons, respectively. For He-dominated white dwarfs, the mixing zone is defined as the convection zone, whereas for warmer H-dominated white dwarfs, it is defined as the region above optical depth τR ≲ 5. Examples of a variety of Solar System objects are included for comparison. The right panel expresses the evolution of the mixing zone mass with decreasing Teff and increasing cooling age. The much lower mixing zone masses of the two He-dominated white dwarfs with Teff > 15 000 K (WD1536+520 (Farihi et al. 2016) and WD J2047–1259 (Hoskin et al. 2020)) arise from the large amounts of trace H (log(H/He) ≃−1 to −2) in their atmospheres. |
6.2 Minimum mass of accreted bodies
Accreted material rapidly sinks towards the core of a white dwarf and becomes unobservable, making the mass of an accreted object very difficult to constrain. The absolute minimum mass can be calculated by considering material within the mixing zone of the white dwarf atmosphere. The mixing zone is defined as either the convection zone in cooler white dwarfs or the region above optical depth τR ≲ 5 in the radiative atmosphere of warmer H-atmosphere white dwarfs. The minimum mass, Mmin, can be calculated using Eq. (4):
 (4)
(4)
which is adapted from equations in Izquierdo et al. (2021) and independent of the accretion phase. The minimum mass can be computed using knowledge of the photospheric abundance for each metal, Z/H(e), as well as the atomic weight of the element, A. Mmin can also be calculated by using the accretion rate, Ṁz, and sinking timescale, τz, of each metal.
The amount of material that has sunk towards the core cannot be determined in any direct way. Efforts have been made to use the measured photospheric number abundances in conjunction with geochemical models to constrain the mass of the accreted body (Buchan et al. 2022), although this method cannot be applied widely as it requires abundances of Ni, Cr, and Si, which are rarely detected together (Fig. 3).
The minimum masses computed from the data within PEWDD are shown in Fig. 11, and are consistent with the general assumption that white dwarfs typically accrete asteroid-sized objects (Jura & Young 2014). It is interesting to note that a few He-atmosphere white dwarfs have accreted planetary debris corresponding to the mass of the minor planet Ceres, which alone makes up 25% of the mass of the Asteroid Belt. Given that the accretion events onto He-atmosphere white dwarfs are only detectable for ≃104–106 yr, a very small fraction of their cooling ages, this suggests that the reservoir of planetary bodies feeding white dwarfs is much larger than the Asteroid Belt in the Solar System (Debes et al. 2012). No white dwarf mixing zone contains metals exceeding a Moon mass, suggesting that no rapid accretion (e.g. via direct impact) of moon or planet-sized objects has been detected so far.
The growth of the mixing zone masses with decreasing Teff is illustrated in the right panel of Fig. 11. The very low minimum masses for H-dominated white dwarfs with Teff ≳ 10 000 K arises from the fact that these stars have only shallow convection zones or radiative atmospheres, and provides little physical insight into the architectures of evolved planetary systems. A similar, albeit much weaker trend is seen among the hotter He-dominated white dwarfs.
Comparing the evolution of the minimum accreted masses and mixing zone masses in metal-enriched He-atmospheres reveals an interesting trend: whereas the mixing zone masses gently increase between 20 000 K and 5000 K, the minimum accreted masses peak around Teff ≃ 12 500 K. This may suggest that there is a finite reservoir of large planetary bodies available that becomes depleted within the first ≃0.5–1.0 Gyr, but future work calculating parent body masses is required to investigate this. The large mixing zone masses, and low opacities of cooler He-atmosphere white dwarfs increases the sensitivity of optical spectra to the presence of photospheric metals, ruling out that the above trend is an observational selection effect. Conversely, at temperatures > 10000 K, the sensitivity of He-atmospheres for the detection of accretion of small bodies, M ≲ 1019 g drops, and it is thus not clear whether the accretion of such small bodies is common at shorter cooling ages.
6.3 Discs
Compact (~ Roche-lobe sized) circumstellar discs are detected either by an infrared excess related to the thermal emission of dust (Zuckerman & Becklin 1987; Kilic et al. 2006; Farihi et al. 2009) or by metallic emission lines from photo-ionised gas (Gänsicke et al. 2006, 2007, 2008; Wilson et al. 2014; Melis et al. 2020). To date, all white dwarfs hosting a gas disc also exhibit infrared excess. The detection of a dust or gas disc is a strong indication of ongoing accretion.
All metal-enriched H-dominated white dwarfs are very likely to be in the steady-state accretion phase (because of their short sinking timescales), yet not all show an infrared excess, suggesting that some discs have so far escaped detection. Although as many as 25–50% of white dwarfs show metal-enrichment (Koester et al. 2014a; Zuckerman et al. 2003, 2010), only 1–3% show signs of hosting a dusty disc (Farihi et al. 2009; Rocchetto et al. 2015; Wilson et al. 2019b). Even rarer are discs showing gaseous emission, with only 21 such systems reported so far (Gentile Fusillo et al. 2021a), at a rate of just  (Manser et al. 2020). A clear question therefore emerges as to whether there is any intrinsic difference between these three types of systems.
The canonical model of a dust disc is a flat, optically thick and passive disc that extends from the sublimation radius of Tdisc ≈ 1200 K to the Roche radius (Jura 2003), set by the temperature and mass of the white dwarf respectively. The disc consists of micron-sized grains that eventually accrete onto the white dwarf surface via PR drag (Bochkarev & Rafikov 2011). The population is more diverse than this simple model, with previous observations finding discs that are cool and truncated (Farihi et al. 2008), potentially optically thin (Bonsor et al. 2017), located beyond the Roche limit (Farihi et al. 2017), or too bright to be accounted for by the canonical model (Gentile Fusillo et al. 2021a).
The distribution of white dwarfs with detected infrared excesses, as a function of the accretion rate onto the white dwarf, is displayed in Fig. 10. Generally, infrared excesses are detected at systems with higher accretion rates (Jura et al. 2007). However, it is important to note that this plot is biased, as systems with large accretion rates and metal-enrichment have been favoured as targets for infrared observations. Nevertheless, Wilson et al. (2019b) did carry out a double-blind HST and Spitzer survey for metal-enrichment and infrared excess, and again found that only  of the stars had a dust detection, whereas 45 ± 4% showed traces of metals. The main hypothesis for the non-detection of discs around metal-enriched H-dominated white dwarfs is that the discs may be optically thin, and/or contain a significant fraction of their mass in larger grains, resulting in an overall weaker infrared excess.
There is a notable drop-off in detected infrared excesses at Teff < 10 000 K even for white dwarfs with large accretion rates, likely due to detection limits of previous observatories such as Spitzer and WISE. An unbiased mid-infrared survey observing H-dominated metal-enriched white dwarfs making use of the much improved sensitivity of JWST, compared to previous facilities, would likely reveal the true population of discs. In addition, infrared spectroscopy can identify the mineralogy of discs, with silicates having been detected using Spitzer and JWST (Jura et al. 2007; Swan et al. 2024).
The green diamonds in Fig. 10 represent systems where gaseous emission has been detected. There is an absence of gaseous emission around white dwarfs with Teff < 12 000 K, which is consistent with the hypothesis that the gas is heated via photo-ionisation – cooler white dwarfs have insufficient UV photons to photo-ionise the largely metallic gas (Kinnear 2009; Melis et al. 2010; Gentile Fusillo et al. 2021a). Gas emission suggests a recent production of gas or a mechanism that generates a constant supply of gas. A puzzling aspect is the location of the gas. Whereas irradiation from the white dwarf will result in the total sublimation of the dust in the inner disc, the detected gaseous discs largely overlap with the dust discs. That is, they cover regions where sublimation cannot explain the formation of gas (Manser et al. 2016). Hence, another mechanism is required to generate the detected gas discs. The highest levels of infrared variability are found among systems that also exhibit gaseous emission (Swan et al. 2021), suggesting that collisions are capable of generating detectable amounts of gas. Such collisions may arise if sufficiently large, solid bodies are orbiting within the dust disc, perhaps on a somewhat eccentric orbit (Manser et al. 2019). Gas generated by collisions beyond the sublimation radius will re-condense on short timescales (Metzger et al. 2012; Okuya et al. 2023). Most gaseous discs have relatively steady emission line fluxes, suggesting ongoing collisions (Manser et al. 2016; Dennihy et al. 2018; Manser et al. 2021). However, in some cases the gas emission lines have been seen fading away within a decade (Wilson et al. 2014). Finally, there is another class of purely gaseous discs, first identified in Gänsicke et al. (2019) with no dusty component. Rich in volatiles (H, S, O), this disc has been explained by the photo-evaporation of a giant planet atmosphere.
7 Magnetic fields
Magnetic white dwarfs exhibit Zeeman-split metal lines, which can be used to estimate the strength of the magnetic field (e.g. Angel & Landstreet 1974; Jordan et al. 1998). These effects must be included when measuring the photospheric abundances of magnetic white dwarfs (e.g. Farihi et al. 2011b; Kawka et al. 2021; Hollands et al. 2023). However, for white dwarfs with very strong magnetic fields, B ≳ 100 MG (e.g. Vennes et al. 2024), synthetic spectra including metals cannot be calculated due to the complex behaviour of atoms in extremely strong fields. For very low magnetic fields, flux spectra do not resolve the Zeeman splitting, and thus spectropolarimetry must be used (e.g. Schmidt & Smith 1995; Landstreet & Bagnulo 2019). Here, we investigate whether magnetic metal-enriched white dwarfs differ in any of their properties from their non-magnetic counterparts.
In general, H-dominated white dwarfs have weaker magnetic fields compared to He-dominated white dwarfs, with median magnetic field strengths of BH = 0.12 MG and BHe = 2.14 MG respectively, as shown in Fig. 12. Even for white dwarfs with similar cooling ages, there is a clear dichotomy between magnetic fields strength for H-atmosphere and He-atmosphere white dwarfs. Magnetism often only appears in white dwarfs at τcool ≃ 1–2 Gyr (Bagnulo & Landstreet 2022; O’Brien et al. 2024), and the very low fraction of younger magnetic metal-enriched white dwarfs (only WD 2105–820; Swan et al. 2019 and WD 1350–090 Schmidt & Smith 1994; Zuckerman et al. 2003 are magnetic and have τcool < 1 Gyr) corroborates this. The onset of magnetism at this cooling age could be caused by the interaction of the growing CVZ with core crystallisation (Isern et al. 2017; Schreiber et al. 2021). This hypothesis might also explain metal-enriched H-atmospheres having lower magnetic fields than metal-enriched He-atmospheres, since they generally have smaller CVZs. The origin of weak magnetism in the two young metal-enriched white dwarfs could be remnants of magnetic fields from previous evolutionary stages (Bagnulo & Landstreet 2022).
As the cooling age increases, there appears to be an increase in the fraction of metal-enriched white dwarfs that have a detectable magnetic field (Kawka & Vennes 2014; Kawka et al. 2019, 2021). There is a gradual increase in the occurrence of magnetism up to τcool = 4.5 Gyr before a dearth of magnetic white dwarfs in the range 4.5 < τcool < 6.5 Gyr. Finally, magnetic white dwarfs make up a large fraction of the metal-enriched sample for τcool > 6.5 Gyr, although there are much fewer metal-enriched white dwarfs in this range, so the distributions here subject to low number statistics. There is a weak correlation between magnetic field strength and cooling age for He-atmospheres, but this is much more pronounced for H-atmospheres.
It is not well established how magnetic fields affect the likelihood of detecting photospheric metals: sufficiently strong fields will suppress convection in the white dwarf, leading to a radiative atmosphere instead (Wickramasinghe & Martin 1986; Valyavin et al. 2014; Tremblay et al. 2015; Gentile Fusillo et al. 2018). Given that the sinking timescales of radiative atmospheres are significantly shorter than those for their convective counterparts, metals remain detectable for a much shorter period of time. Hence, strong fields may reduce the amount of time for which metal-enrichment can be detected. Finally, for extremely large magnetic fields, metal lines are so smeared that the spectra of these stars become featureless continua (Hollands et al. 2015).
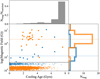 |
Fig. 12 Magnetic field strength as a function of cooling age for metal-enriched H- and He-dominated white dwarfs from PEWDD. The black horizontal dashed line illustrates the threshold for detecting Zeeman splitting in flux spectra. The coloured horizontal dotted lines show the median values of magnetic field strength for H- (blue pentagons) and He- (orange hexagons) dominated atmospheres. The upper histogram shows the fraction of magnetic white dwarfs compared to the total number of metal-enriched white dwarfs in PEWDD. The right histogram illustrates the distribution of magnetic field strengths for H- and He-dominated white dwarfs. The points below the detection threshold are white dwarfs where no magnetic field has been detected, scattered to show the cooling age distribution compared to their magnetic counterparts. |
8 Binaries
Zuckerman (2014) investigated the projected separation of metal-enriched white dwarfs in binaries. They found that for separations less than 1000 au, metal-enrichment is less common, implying that closer companions reduce the formation or long-term stability of planetary systems (Roell et al. 2012; Coleman & Haworth 2022; Cuello et al. 2023), resulting in less planetary material to be accreted by the white dwarf. For separations greater than 1000 au, binaries with metal-enriched and non-enriched white dwarfs are equally common, although this study only contained six metal-enriched white dwarfs. Noor et al. (2024) studied the frequency of DAZ and DZ white dwarfs with wide binary companions compared to field white dwarfs and concludes that the presence of metals in white dwarfs are not the result of planetary system instabilities caused by stellar companions. Their study only made use of the samples of Dufour et al. (2007), Hollands et al. (2017) and Wilson et al. (2019b), and they find a discrepancy between wide binary fractions for DAZ and DZ white dwarfs.
To enlarge the sample of metal-enriched white dwarfs with a wide binary companion, we made use of the astrometric data from Gaia in a systematic search for common proper motion companions to all stars in PEWDD using the methods described in Hollands et al. (2018b) and McCleery et al. (2020). For each metal-enriched white dwarf with a Gaia ID that passes the cuts of parallax_over_error > 1 and astrometric_excess_noise < 1, we search for objects within a projected separation8 of 1 pc and within a radial distance of 1 pc. To consider whether the objects share a common proper motion, we calculate the tangential velocity difference using the difference in proper motion. We then apply a cut in projected separation and tangential velocity for objects that could not be gravitationally bound in a binary to remove contaminants.
We identify 40 metal-enriched white dwarfs that fulfil these criteria9, including 8 new systems, shown in Table A.1. Four of these wide binaries have hydrogen-dominated atmosphere white dwarf companions, and the remainder have main-sequence star companions. These 34 white dwarfs with main-sequence star companions are candidates for studies comparing the composition of planetary bodies to stellar abundances, such as in the pilot study of Bonsor et al. (2021).
Stars experience mass loss during the red giant phase, which causes the semi-major axis between the two binary companions to increase. A full consideration of this process requires knowledge of the initial and final eccentricities of the systems (e.g. Veras et al. 2014a; Veras 2016), which we do not have. For simplicity, we assumed adiabatic expansion and that the eccen-tricity remains constant during the mass-loss phase so we could approximate the initial binary semi-major axis, a0, using Eq. (10) from Shappee & Thompson (2013) while knowing the final semi-major axis, af, and the initial and final total binary mass, M0 and Mf respectively:
 (5)
(5)
The white dwarf mass is taken from GF21, and the IFMR from Cummings et al. (2018) was used to calculate the initial mass. If the binary companion is a white dwarf, we calculated the initial separation when both stars were on the main sequence. We estimate main-sequence star masses by considering the luminos-ity L, calculated from the G-band magnitude, G, and parallax, p, taken from Gaia DR3 and the Sun’s absolute bolometric magnitude, Mbol, ⊙ = 4.74 (Gaia Collaboration 2016, 2018):
 (6)
(6)
The results of this computation is displayed in the top panel of Fig. 13, showing the initial projected separation distribution of the binary systems, that is, when both stars were on the main sequence. Many metal-enriched white dwarfs had wide binary companions when on the main sequence. Recent studies of wide binary companions to planet-hosting main-sequence stars sug-gest that the formation of planetary systems are only significantly suppressed by companions within 50 au (Kraus et al. 2016), with binary companions at distances greater than 200 au having neg-ligible effect on planet formation (Moe & Kratter 2021). Our results agree with the formation of planetary systems suppres-sion within 200 au, with only two metal-enriched white dwarfs with binary companions interior to 200 au when considering the estimated initial separation. The bottom panel of Fig. 13 demonstrates that 11 metal-enriched white dwarfs have binary companions within 1000 au, a substantial increase compared to previous work (Zuckerman 2014). In our larger sample, the fre-quency of metal white dwarf metal enrichment decreases at a smaller final separation of ≃500 au.
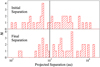 |
Fig. 13 Distribution of metal-enriched white dwarfs in wide binaries from Table A.1 as a function of projected separation. The top panel shows the estimated initial projected separation been when both stars in the binary were on the main sequence, whereas the bottom panel shows the observed projected separation. The vertical line corresponds to a separation of 1000 au, which Zuckerman (2014) identified as a thresh-old below which the frequency of metal-enrichment decreases. |
9 Conclusions
Metal-enriched white dwarfs allow for the most accurate mea-surements of exo-planetary bulk compositions. PEWDD is a homogeneous database of 1739 systems with traces of photo-spheric metals, and it is designed for statistical studies of the abundances of exo-planetary bodies.
Current studies of metal-enriched white dwarfs are largely limited by observational biases. Metals such as Ca, Cr, and Na are much more commonly detected compared to what would be expected assuming bulk Earth abundances. The white dwarf effective temperature plays a major role in which metals can be detected as well as the wavelength range of observations.
We made use of PEWDD to discuss a range of aspects related to metal-enriched white dwarfs. This includes statistics on the detection of individual elements as a function of Teff; the dichotomy of H-atmosphere and He-atmosphere white dwarf accretion rates; uncertainties in photospheric abundances; the frequency of magnetism among metal-enriched white dwarfs, and the distribution of their field strengths; and statistics on metal-enrichment among white dwarfs in wide binaries.
PEWDD will be continually updated as the photospheric abundances for more white dwarfs are published. With upcom-ing large spectroscopic surveys such as DESI, SDSS-V, 4MOST, and WEAVE, many more white dwarfs will be inspected for metal enrichment. As well as further identification of metal-enriched white dwarfs, we emphasise the importance of more detailed studies of suitable white dwarfs with large numbers of detected elements, as these are the most valuable for gaining insight into the composition of the accreted planetary bodies and therefore for our understanding of the formation and evolution of exo-planets.
Data availability
A copy of the catalogue is available at the CDS via anonymous ftp to cdsarc.cds.unistra.fr (130.79.128.5) or via https://cdsarc.cds.unistra.fr/viz-bin/cat/J/A+A/691/A352
Acknowledgements
This research received funding from the European Research Council under the European Union’s Horizon 2020 research and innovation programme numbers 101020057 (JTW, BTG, AS, PI) and 101002408 (MOB). AMC is supported by grant project reference 2590460 from the Science and Technology Facilities Council (STFC). TC is supported by NASA through the NASA Hubble Fellowship grant HST-HF2-51527.001-A awarded by the Space Telescope Science Institute, which is operated by the Association of Universities for Research in Astronomy, Inc., for NASA, under contract NAS5-26555. This research has made use of NASA’s Astrophysics Data System; the SIMBAD database, operated at CDS, Strasbourg, France; the Montreal White Dwarf Database (MWDD; Dufour et al. 2017) and the VizieR service. This work has made use of data from the European Space Agency (ESA) mission Gaia (https://www.cosmos.esa.int/gaia), processed by the Gaia Data Processing and Analysis Consortium (DPAC, https://www.cosmos.esa.int/web/gaia/dpac/consortium). Funding for the DPAC has been provided by national institutions, in particular the institutions participating in the Gaia Multilateral Agreement. We thank the anonymous referee for a constructive report.
Appendix A Additional tables
Metal-enriched white dwarfs in wide binaries with properties of their companion star.
References for all white dwarfs with entries in PEWDD at the time of publication.
References
- Allègre, C., Manhès, G., & Lewin, É. 2001, Earth Planet. Sci. Lett., 185, 49 [CrossRef] [Google Scholar]
- Andrews, J. J., Agüeros, M. A., Gianninas, A., et al. 2015, ApJ, 815, 63 [NASA ADS] [CrossRef] [Google Scholar]
- Angel, J. R. P., & Landstreet, J. D. 1974, ApJ, 191, 457 [NASA ADS] [CrossRef] [Google Scholar]
- Antoniadou, K. I., & Veras, D. 2016, MNRAS, 463, 4108 [NASA ADS] [CrossRef] [Google Scholar]
- Asplund, M., Grevesse, N., & Sauval, A. J. 2005, in Astronomical Society of the Pacific Conference Series, 336, Cosmic Abundances as Records of Stellar Evolution and Nucleosynthesis, eds. I. Barnes, Thomas G., & F. N. Bash, 25 [Google Scholar]
- Badenas-Agusti, M., Vanderburg, A., Blouin, S., et al. 2024, MNRAS, 527, 4515 [Google Scholar]
- Bagnulo, S., & Landstreet, J. D. 2022, ApJ, 935, L12 [NASA ADS] [CrossRef] [Google Scholar]
- Barney, I. 1949, Trans. Astron. Observ. Yale Univ., 20, 1 [NASA ADS] [Google Scholar]
- Barstow, M. A., Good, S. A., Holberg, J. B., et al. 2003, MNRAS, 341, 870 [NASA ADS] [CrossRef] [Google Scholar]
- Barstow, M. A., Barstow, J. K., Casewell, S. L., Holberg, J. B., & Hubeny, I. 2014, MNRAS, 440, 1607 [Google Scholar]
- Becklin, E. E., Farihi, J., Jura, M., et al. 2005, ApJ, 632, L119 [NASA ADS] [CrossRef] [Google Scholar]
- Bédard, A. 2024, Ap&SS, 369, 43 [CrossRef] [Google Scholar]
- Bédard, A., Bergeron, P., & Brassard, P. 2022, ApJ, 930, 8 [CrossRef] [Google Scholar]
- Berger, L., Koester, D., Napiwotzki, R., Reid, I. N., & Zuckerman, B. 2005, A&A, 444, 565 [NASA ADS] [CrossRef] [EDP Sciences] [Google Scholar]
- Bergeron, P., Wesemael, F., Dufour, P., et al. 2011, ApJ, 737, 28 [Google Scholar]
- Bergfors, C., Farihi, J., Dufour, P., & Rocchetto, M. 2014, MNRAS, 444, 2147 [CrossRef] [Google Scholar]
- Birky, J., Hogg, D. W., Mann, A. W., & Burgasser, A. 2020, ApJ, 892, 31 [Google Scholar]
- Blouin, S. 2020, MNRAS, 496, 1881 [CrossRef] [Google Scholar]
- Blouin, S., & Xu, S. 2022, MNRAS, 510, 1059 [Google Scholar]
- Blouin, S., Dufour, P., & Allard, N. F. 2018a, ApJ, 863, 184 [Google Scholar]
- Blouin, S., Dufour, P., Allard, N. F., & Kilic, M. 2018b, ApJ, 867, 161 [NASA ADS] [CrossRef] [Google Scholar]
- Blouin, S., Dufour, P., Allard, N. F., et al. 2019, ApJ, 872, 188 [NASA ADS] [CrossRef] [Google Scholar]
- Bochkarev, K. V., & Rafikov, R. R. 2011, ApJ, 741, 36 [NASA ADS] [CrossRef] [Google Scholar]
- Bonsor, A., Farihi, J., Wyatt, M. C., & van Lieshout, R. 2017, MNRAS, 468, 154 [NASA ADS] [CrossRef] [Google Scholar]
- Bonsor, A., Carter, P. J., Hollands, M., et al. 2020, MNRAS, 492, 2683 [NASA ADS] [CrossRef] [Google Scholar]
- Bonsor, A., Jofré, P., Shorttle, O., et al. 2021, MNRAS, 503, 1877 [NASA ADS] [CrossRef] [Google Scholar]
- Brouwers, M. G., Bonsor, A., & Malamud, U. 2022, MNRAS, 509, 2404 [NASA ADS] [Google Scholar]
- Buchan, A. M., Bonsor, A., Shorttle, O., et al. 2022, MNRAS, 510, 3512 [NASA ADS] [CrossRef] [Google Scholar]
- Cannon, A. J., & Pickering, E. C. 1993, VizieR Online Data Catalog; III/135A [Google Scholar]
- Chayer, P. 2014, MNRAS, 437, L95 [Google Scholar]
- Chayer, P., & Dupuis, J. 2010, in American Institute of Physics Conference Series, 1273, 17th European White Dwarf Workshop, eds. K. Werner & T. Rauch, 394 [Google Scholar]
- Chayer, P., LeBlanc, F., Fontaine, G., et al. 1994, ApJ, 436, L161 [NASA ADS] [CrossRef] [Google Scholar]
- Chayer, P., Vennes, S., Pradhan, A. K., et al. 1995, ApJ, 454, 429 [NASA ADS] [CrossRef] [Google Scholar]
- Chayer, P., Mendoza, C., Meléndez, M., Deprince, J., & Dupuis, J. 2023, MNRAS, 518, 368 [Google Scholar]
- Coleman, G. A. L., & Haworth, T. J. 2022, MNRAS, 514, 2315 [NASA ADS] [CrossRef] [Google Scholar]
- Cottrell, P. L., & Greenstein, J. L. 1980, ApJ, 238, 941 [NASA ADS] [CrossRef] [Google Scholar]
- Coutu, S., Dufour, P., Bergeron, P., et al. 2019, ApJ, 885, 74 [NASA ADS] [CrossRef] [Google Scholar]
- Cuello, N., Ménard, F., & Price, D. J. 2023, Eur. Phys. J. Plus, 138, 11 [NASA ADS] [CrossRef] [Google Scholar]
- Cummings, J. D., Kalirai, J. S., Tremblay, P. E., Ramirez-Ruiz, E., & Choi, J. 2018, ApJ, 866, 21 [NASA ADS] [CrossRef] [Google Scholar]
- Cunningham, T., Tremblay, P.-E., Freytag, B., Ludwig, H.-G., & Koester, D. 2019, MNRAS, 488, 2503 [NASA ADS] [CrossRef] [Google Scholar]
- Cunningham, T., Tremblay, P.-E., Bauer, E. B., et al. 2021, MNRAS, 503, 1646 [NASA ADS] [CrossRef] [Google Scholar]
- Cunningham, T., Wheatley, P. J., Tremblay, P.-E., et al. 2022, Nature, 602, 219 [NASA ADS] [CrossRef] [Google Scholar]
- Davison, C. L., White, R. J., Henry, T. J., et al. 2015, AJ, 149, 106 [Google Scholar]
- Deal, M., Deheuvels, S., Vauclair, G., Vauclair, S., & Wachlin, F. C. 2013, A&A, 557, L12 [NASA ADS] [CrossRef] [EDP Sciences] [Google Scholar]
- Debes, J. H. 2006, ApJ, 652, 636 [NASA ADS] [CrossRef] [Google Scholar]
- Debes, J. H., Walsh, K. J., & Stark, C. 2012, ApJ, 747, 148 [NASA ADS] [CrossRef] [Google Scholar]
- Dennihy, E., Debes, J. H., Dunlap, B. H., et al. 2016, ApJ, 831, 31 [NASA ADS] [CrossRef] [Google Scholar]
- Dennihy, E., Clemens, J. C., Dunlap, B. H., et al. 2018, ApJ, 854, 40 [NASA ADS] [CrossRef] [Google Scholar]
- Desharnais, S., Wesemael, F., Chayer, P., Kruk, J. W., & Saffer, R. A. 2008, ApJ, 672, 540 [NASA ADS] [CrossRef] [Google Scholar]
- Dobbie, P. D., Barstow, M. A., Hubeny, I., et al. 2005, MNRAS, 363, 763 [NASA ADS] [CrossRef] [Google Scholar]
- Doyle, A. E., Desch, S. J., & Young, E. D. 2021, ApJ, 907, L35 [NASA ADS] [CrossRef] [Google Scholar]
- Doyle, A. E., Klein, B. L., Dufour, P., et al. 2023, ApJ, 950, 93 [NASA ADS] [CrossRef] [Google Scholar]
- Dufour, P., Bergeron, P., Liebert, J., et al. 2007, ApJ, 663, 1291 [NASA ADS] [CrossRef] [Google Scholar]
- Dufour, P., Kilic, M., Fontaine, G., et al. 2010, ApJ, 719, 803 [NASA ADS] [CrossRef] [Google Scholar]
- Dufour, P., Kilic, M., Fontaine, G., et al. 2012, ApJ, 749, 6 [NASA ADS] [CrossRef] [Google Scholar]
- Dufour, P., Blouin, S., Coutu, S., et al. 2017, in Astronomical Society of the Pacific Conference Series, 509, 20th European White Dwarf Workshop, eds. P. E. Tremblay, B. Gaensicke, & T. Marsh, 3 [Google Scholar]
- Dupuis, J., Fontaine, G., & Wesemael, F. 1993, ApJS, 87, 345 [NASA ADS] [CrossRef] [Google Scholar]
- Dwomoh, A. M., & Bauer, E. B. 2023, ApJ, 952, 95 [NASA ADS] [CrossRef] [Google Scholar]
- Eggen, O. J., & Greenstein, J. L. 1965, ApJ, 142, 925 [NASA ADS] [CrossRef] [Google Scholar]
- Elms, A. K., Tremblay, P.-E., Gänsicke, B. T., et al. 2022, MNRAS, 517, 4557 [NASA ADS] [CrossRef] [Google Scholar]
- Farihi, J. 2016, New A Rev., 71, 9 [NASA ADS] [CrossRef] [Google Scholar]
- Farihi, J., Becklin, E. E., & Zuckerman, B. 2008, ApJ, 681, 1470 [NASA ADS] [CrossRef] [Google Scholar]
- Farihi, J., Jura, M., & Zuckerman, B. 2009, ApJ, 694, 805 [CrossRef] [Google Scholar]
- Farihi, J., Jura, M., Lee, J. E., & Zuckerman, B. 2010, ApJ, 714, 1386 [NASA ADS] [CrossRef] [Google Scholar]
- Farihi, J., Brinkworth, C. S., Gänsicke, B. T., et al. 2011a, ApJ, 728, L8 [NASA ADS] [CrossRef] [Google Scholar]
- Farihi, J., Dufour, P., Napiwotzki, R., & Koester, D. 2011b, MNRAS, 413, 2559 [NASA ADS] [CrossRef] [Google Scholar]
- Farihi, J., Gänsicke, B. T., Wyatt, M. C., et al. 2012, MNRAS, 424, 464 [NASA ADS] [CrossRef] [Google Scholar]
- Farihi, J., Gänsicke, B. T., & Koester, D. 2013, Science, 342, 218 [NASA ADS] [CrossRef] [Google Scholar]
- Farihi, J., Koester, D., Zuckerman, B., et al. 2016, MNRAS, 463, 3186 [NASA ADS] [CrossRef] [Google Scholar]
- Farihi, J., Parsons, S. G., & Gänsicke, B. T. 2017, Nat. Astron., 1, 0032 [NASA ADS] [CrossRef] [Google Scholar]
- Fontaine, G., & Michaud, G. 1979, ApJ, 231, 826 [Google Scholar]
- Fortin-Archambault, M., Dufour, P., & Xu, S. 2020, ApJ, 888, 47 [NASA ADS] [CrossRef] [Google Scholar]
- Friedrich, S., Koester, D., Heber, U., Jeffery, C. S., & Reimers, D. 1999, A&A, 350, 865 [NASA ADS] [Google Scholar]
- Friedrich, S., Koester, D., Christlieb, N., Reimers, D., & Wisotzki, L. 2000, A&A, 363, 1040 [NASA ADS] [Google Scholar]
- Gaia Collaboration (Prusti, T., et al.) 2016, A&A, 595, A1 [NASA ADS] [CrossRef] [EDP Sciences] [Google Scholar]
- Gaia Collaboration (Brown, A. G. A., et al.) 2018, A&A, 616, A1 [NASA ADS] [CrossRef] [EDP Sciences] [Google Scholar]
- Gaia Collaboration (Vallenari, A., et al.) 2023, A&A, 674, A1 [NASA ADS] [CrossRef] [EDP Sciences] [Google Scholar]
- Gaidos, E., Mann, A. W., Kraus, A. L., & Ireland, M. 2016, MNRAS, 457, 2877 [Google Scholar]
- Gallo, E., Caldiroli, A., Spinelli, R., et al. 2024, arXiv e-prints [arXiv:2401.05540] [Google Scholar]
- Gänsicke, B. T., Marsh, T. R., Southworth, J., & Rebassa-Mansergas, A. 2006, Science, 314, 1908 [Google Scholar]
- Gänsicke, B. T., Marsh, T. R., & Southworth, J. 2007, MNRAS, 380, L35 [NASA ADS] [CrossRef] [Google Scholar]
- Gänsicke, B. T., Marsh, T. R., Southworth, J., & Rebassa-Mansergas, A. 2008, in Astronomical Society of the Pacific Conference Series, 398, Extreme Solar Systems, eds. D. Fischer, F. A. Rasio, S. E. Thorsett, & A. Wolszczan, 149 [Google Scholar]
- Gänsicke, B. T., Koester, D., Farihi, J., et al. 2012, MNRAS, 424, 333 [CrossRef] [Google Scholar]
- Gänsicke, B. T., Schreiber, M. R., Toloza, O., et al. 2019, Nature, 576, 61 [Google Scholar]
- Gänsicke, B. T., Koester, D., Raddi, R., Toloza, O., & Kepler, S. O. 2020, MNRAS, 496, 4079 [CrossRef] [Google Scholar]
- Genest-Beaulieu, C., & Bergeron, P. 2019, ApJ, 882, 106 [NASA ADS] [CrossRef] [Google Scholar]
- Gentile Fusillo, N. P., Gänsicke, B. T., Farihi, J., et al. 2017, MNRAS, 468, 971 [NASA ADS] [CrossRef] [Google Scholar]
- Gentile Fusillo, N. P., Tremblay, P. E., Jordan, S., et al. 2018, MNRAS, 473, 3693 [NASA ADS] [CrossRef] [Google Scholar]
- Gentile Fusillo, N. P., Manser, C. J., Gänsicke, B. T., et al. 2021a, MNRAS, 504, 2707 [Google Scholar]
- Gentile Fusillo, N. P., Tremblay, P. E., Cukanovaite, E., et al. 2021b, MNRAS, 508, 3877 [NASA ADS] [CrossRef] [Google Scholar]
- Gianninas, A., Bergeron, P., & Ruiz, M. T. 2011, ApJ, 743, 138 [Google Scholar]
- Girven, J., Brinkworth, C. S., Farihi, J., et al. 2012, ApJ, 749, 154 [NASA ADS] [CrossRef] [Google Scholar]
- Goldschmidt, V. M. 1937, J. Chem. Soc., 655 [Google Scholar]
- González Egea, E., Raddi, R., Koester, D., et al. 2021, MNRAS, 501, 3916 [CrossRef] [Google Scholar]
- Grenfell, T. C. 1974, A&A, 31, 303 [NASA ADS] [Google Scholar]
- Harrison, J. H. D., Bonsor, A., Kama, M., et al. 2021, MNRAS, 504, 2853 [NASA ADS] [CrossRef] [Google Scholar]
- Holberg, J. B., Barstow, M. A., Bruhweiler, F. C., & Collins, J. 1996, AJ, 111, 2361 [NASA ADS] [CrossRef] [Google Scholar]
- Hollands, M. A., Gänsicke, B. T., & Koester, D. 2015, MNRAS, 450, 681 [NASA ADS] [CrossRef] [Google Scholar]
- Hollands, M. A., Koester, D., Alekseev, V., Herbert, E. L., & Gänsicke, B. T. 2017, MNRAS, 467, 4970 [NASA ADS] [Google Scholar]
- Hollands, M. A., Gänsicke, B. T., & Koester, D. 2018a, MNRAS, 477, 93 [NASA ADS] [CrossRef] [Google Scholar]
- Hollands, M. A., Tremblay, P. E., Gänsicke, B. T., Gentile-Fusillo, N. P., & Toonen, S. 2018b, MNRAS, 480, 3942 [NASA ADS] [CrossRef] [Google Scholar]
- Hollands, M. A., Tremblay, P.-E., Gänsicke, B. T., Koester, D., & Gentile-Fusillo, N. P. 2021, Nat. Astron., 5, 451 [NASA ADS] [CrossRef] [Google Scholar]
- Hollands, M. A., Tremblay, P. E., Gänsicke, B. T., & Koester, D. 2022, MNRAS, 511, 71 [CrossRef] [Google Scholar]
- Hollands, M. A., Stopkowicz, S., Kitsaras, M. P., et al. 2023, MNRAS, 520, 3560 [NASA ADS] [CrossRef] [Google Scholar]
- Homeier, D., Koester, D., Hagen, H. J., et al. 1998, A&A, 338, 563 [NASA ADS] [Google Scholar]
- Hoskin, M. J., Toloza, O., Gänsicke, B. T., et al. 2020, MNRAS, 499, 171 [NASA ADS] [CrossRef] [Google Scholar]
- Isern, J., García-Berro, E., Külebi, B., & Lorén-Aguilar, P. 2017, ApJ, 836, L28 [NASA ADS] [CrossRef] [Google Scholar]
- Izquierdo, P., Toloza, O., Gänsicke, B. T., et al. 2021, MNRAS, 501, 4276 [NASA ADS] [CrossRef] [Google Scholar]
- Izquierdo, P., Gänsicke, B. T., Rodríguez-Gil, P., et al. 2023, MNRAS, 520, 2843 [NASA ADS] [CrossRef] [Google Scholar]
- Johnson, T. M., Klein, B. L., Koester, D., et al. 2022, ApJ, 941, 113 [NASA ADS] [CrossRef] [Google Scholar]
- Jordan, S., Schmelcher, P., Becken, W., & Schweizer, W. 1998, A&A, 336, L33 [Google Scholar]
- Jura, M. 2003, ApJ, 584, L91 [Google Scholar]
- Jura, M., & Xu, S. 2010, AJ, 140, 1129 [NASA ADS] [CrossRef] [Google Scholar]
- Jura, M., & Young, E. D. 2014, Annu. Rev. Earth Planet. Sci., 42, 45 [CrossRef] [Google Scholar]
- Jura, M., Farihi, J., Zuckerman, B., & Becklin, E. E. 2007, AJ, 133, 1927 [NASA ADS] [CrossRef] [Google Scholar]
- Jura, M., Muno, M. P., Farihi, J., & Zuckerman, B. 2009, ApJ, 699, 1473 [CrossRef] [Google Scholar]
- Jura, M., Xu, S., Klein, B., Koester, D., & Zuckerman, B. 2012, ApJ, 750, 69 [NASA ADS] [CrossRef] [Google Scholar]
- Jura, M., Dufour, P., Xu, S., et al. 2015, ApJ, 799, 109 [CrossRef] [Google Scholar]
- Kaiser, B. C., Clemens, J. C., Blouin, S., et al. 2021, Science, 371, 168 [NASA ADS] [CrossRef] [Google Scholar]
- Kawka, A., & Vennes, S. 2011, A&A, 532, A7 [NASA ADS] [CrossRef] [EDP Sciences] [Google Scholar]
- Kawka, A., & Vennes, S. 2012, A&A, 538, A13 [NASA ADS] [CrossRef] [EDP Sciences] [Google Scholar]
- Kawka, A., & Vennes, S. 2014, MNRAS, 439, L90 [CrossRef] [Google Scholar]
- Kawka, A., Vennes, S., Dinnbier, F., Cibulková, H., & Németh, P. 2011, in American Institute of Physics Conference Series, 1331, Planetary Systems Beyond the Main Sequence, eds. S. Schuh, H. Drechsel, & U. Heber, 238 [Google Scholar]
- Kawka, A., Vennes, S., Ferrario, L., & Paunzen, E. 2019, MNRAS, 482, 5201 [NASA ADS] [CrossRef] [Google Scholar]
- Kawka, A., Vennes, S., Allard, N. F., Leininger, T., & Gadéa, F. X. 2021, MNRAS, 500, 2732 [Google Scholar]
- Kenyon, S. J., Shipman, H. L., Sion, E. M., & Aannestad, P. A. 1988, ApJ, 328, L65 [NASA ADS] [CrossRef] [Google Scholar]
- Kepler, S. O., Pelisoli, I., Koester, D., et al. 2015, MNRAS, 446, 4078 [Google Scholar]
- Kepler, S. O., Pelisoli, I., Koester, D., et al. 2016, MNRAS, 455, 3413 [NASA ADS] [CrossRef] [Google Scholar]
- Kepler, S. O., Koester, D., Pelisoli, I., Romero, A. D., & Ourique, G. 2021, MNRAS, 507, 4646 [NASA ADS] [CrossRef] [Google Scholar]
- Kilic, M., & Redfield, S. 2007, ApJ, 660, 641 [NASA ADS] [CrossRef] [Google Scholar]
- Kilic, M., von Hippel, T., Leggett, S. K., & Winget, D. E. 2006, ApJ, 646, 474 [NASA ADS] [CrossRef] [Google Scholar]
- Kilic, M., Bergeron, P., Kosakowski, A., et al. 2020, ApJ, 898, 84 [Google Scholar]
- Kinnear, T. 2009, PhD thesis, University of Warwick, UK [Google Scholar]
- Klein, B., Jura, M., Koester, D., Zuckerman, B., & Melis, C. 2010, ApJ, 709, 950 [NASA ADS] [CrossRef] [Google Scholar]
- Klein, B., Jura, M., Koester, D., & Zuckerman, B. 2011, ApJ, 741, 64 [Google Scholar]
- Klein, B. L., Doyle, A. E., Zuckerman, B., et al. 2021, ApJ, 914, 61 [NASA ADS] [CrossRef] [Google Scholar]
- Koester, D. 1976, A&A, 52, 415 [NASA ADS] [Google Scholar]
- Koester, D. 2009, A&A, 498, 517 [NASA ADS] [CrossRef] [EDP Sciences] [Google Scholar]
- Koester, D. 2010, Mem. Soc. Astron. Italiana, 81, 921 [NASA ADS] [Google Scholar]
- Koester, D. 2015, in Astronomical Society of the Pacific Conference Series, 493, 19th European Workshop on White Dwarfs, eds. P. Dufour, P. Bergeron, & G. Fontaine, 129 [Google Scholar]
- Koester, D., & Allard, N. F. 1996, in Astronomical Society of the Pacific Conference Series, 96, Hydrogen Deficient Stars, eds. C. S. Jeffery, & U. Heber, 324 [Google Scholar]
- Koester, D., & Kepler, S. O. 2015, A&A, 583, A86 [NASA ADS] [CrossRef] [EDP Sciences] [Google Scholar]
- Koester, D., & Wilken, D. 2006, A&A, 453, 1051 [NASA ADS] [CrossRef] [EDP Sciences] [Google Scholar]
- Koester, D., & Wolff, B. 2000, A&A, 357, 587 [NASA ADS] [Google Scholar]
- Koester, D., Provencal, J., & Shipman, H. L. 1997, A&A, 320, L57 [NASA ADS] [Google Scholar]
- Koester, D., Napiwotzki, R., Voss, B., Homeier, D., & Reimers, D. 2005a, A&A, 439, 317 [NASA ADS] [CrossRef] [EDP Sciences] [Google Scholar]
- Koester, D., Rollenhagen, K., Napiwotzki, R., et al. 2005b, A&A, 432, 1025 [NASA ADS] [CrossRef] [EDP Sciences] [Google Scholar]
- Koester, D., Gänsicke, B. T., & Farihi, J. 2014a, A&A, 566, A34 [NASA ADS] [CrossRef] [EDP Sciences] [Google Scholar]
- Koester, D., Provencal, J., & Gänsicke, B. T. 2014b, A&A, 568, A118 [NASA ADS] [CrossRef] [EDP Sciences] [Google Scholar]
- Koester, D., Kepler, S. O., & Irwin, A. W. 2020, A&A, 635, A103 [NASA ADS] [CrossRef] [EDP Sciences] [Google Scholar]
- Kraus, A. L., Ireland, M. J., Huber, D., Mann, A. W., & Dupuy, T. J. 2016, AJ, 152, 8 [NASA ADS] [CrossRef] [Google Scholar]
- Landstreet, J. D., & Bagnulo, S. 2019, A&A, 628, A1 [NASA ADS] [CrossRef] [EDP Sciences] [Google Scholar]
- Lee, S. G. 1984, AJ, 89, 702 [NASA ADS] [CrossRef] [Google Scholar]
- Leggett, S. K., Bergeron, P., Subasavage, J. P., et al. 2018, ApJS, 239, 26 [NASA ADS] [CrossRef] [Google Scholar]
- Liebert, J. 1977, A&A, 60, 101 [NASA ADS] [Google Scholar]
- Liebert, J., Wehrse, R., & Green, R. F. 1987, A&A, 175, 173 [NASA ADS] [Google Scholar]
- Lodders, K. 2003, ApJ, 591, 1220 [Google Scholar]
- Malamud, U., Grishin, E., & Brouwers, M. 2021, MNRAS, 501, 3806 [NASA ADS] [Google Scholar]
- Manser, C. J., Gänsicke, B. T., Marsh, T. R., et al. 2016, MNRAS, 455, 4467 [Google Scholar]
- Manser, C. J., Gänsicke, B. T., Eggl, S., et al. 2019, Science, 364, 66 [Google Scholar]
- Manser, C. J., Gänsicke, B. T., Gentile Fusillo, N. P., et al. 2020, MNRAS, 493, 2127 [NASA ADS] [CrossRef] [Google Scholar]
- Manser, C. J., Dennihy, E., Gänsicke, B. T., et al. 2021, MNRAS, 508, 5657 [NASA ADS] [CrossRef] [Google Scholar]
- McCleery, J., Tremblay, P.-E., Gentile Fusillo, N. P., et al. 2020, MNRAS, 499, 1890 [Google Scholar]
- McDonough, W. 2000, Earthquake Thermodynamics and Phase Transformation in the Earth’s Interior (Elsevier Science Academic Press), 5 [Google Scholar]
- Melis, C., & Dufour, P. 2017, ApJ, 834, 1 [NASA ADS] [Google Scholar]
- Melis, C., Jura, M., Albert, L., Klein, B., & Zuckerman, B. 2010, ApJ, 722, 1078 [NASA ADS] [CrossRef] [Google Scholar]
- Melis, C., Farihi, J., Dufour, P., et al. 2011, ApJ, 732, 90 [NASA ADS] [CrossRef] [Google Scholar]
- Melis, C., Dufour, P., Farihi, J., et al. 2012, ApJ, 751, L4 [NASA ADS] [CrossRef] [Google Scholar]
- Melis, C., Zuckerman, B., Dufour, P., Song, I., & Klein, B. 2018, RNAAS, 2, 64 [NASA ADS] [Google Scholar]
- Melis, C., Klein, B., Doyle, A. E., et al. 2020, ApJ, 905, 56 [NASA ADS] [CrossRef] [Google Scholar]
- Metzger, B. D., Rafikov, R. R., & Bochkarev, K. V. 2012, MNRAS, 423, 505 [Google Scholar]
- Moe, M., & Kratter, K. M. 2021, MNRAS, 507, 3593 [NASA ADS] [CrossRef] [Google Scholar]
- Mustill, A. J., Villaver, E., Veras, D., Gänsicke, B. T., & Bonsor, A. 2018, MNRAS, 476, 3939 [NASA ADS] [CrossRef] [Google Scholar]
- Nittler, L. R., McCoy, T. J., Clark, P. E., et al. 2004, Antarctic Meteor. Res., 17, 231 [Google Scholar]
- Noor, H. T., Farihi, J., Hollands, M., & Toonen, S. 2024, MNRAS, 529, 2910 [NASA ADS] [CrossRef] [Google Scholar]
- O’Brien, M. W., Tremblay, P. E., Gentile Fusillo, N. P., et al. 2023, MNRAS, 518, 3055 [Google Scholar]
- O’Brien, M. W., Tremblay, P. E., Klein, B. L., et al. 2024, MNRAS, 527, 8687 [Google Scholar]
- O’Donoghue, D., Koen, C., Kilkenny, D., et al. 2003, MNRAS, 345, 506 [CrossRef] [Google Scholar]
- Okuya, A., Ida, S., Hyodo, R., & Okuzumi, S. 2023, MNRAS, 519, 1657 [Google Scholar]
- Owens, D., Xu, S., Manjavacas, E., et al. 2023, AJ, 166, 5 [NASA ADS] [CrossRef] [Google Scholar]
- Payne, C. H. 1925, PhD thesis, Radcliffe College, USA [Google Scholar]
- Pyrzas, S., Gänsicke, B. T., Brady, S., et al. 2012, MNRAS, 419, 817 [NASA ADS] [CrossRef] [Google Scholar]
- Raddi, R., Gänsicke, B. T., Koester, D., et al. 2015, MNRAS, 450, 2083 [NASA ADS] [CrossRef] [Google Scholar]
- Raddi, R., Hollands, M. A., Koester, D., et al. 2019, MNRAS, 489, 1489 [Google Scholar]
- Rafikov, R. R. 2011, ApJ, 732, L3 [NASA ADS] [CrossRef] [Google Scholar]
- Rafikov, R. R., & Garmilla, J. A. 2012, ApJ, 760, 123 [NASA ADS] [CrossRef] [Google Scholar]
- Rocchetto, M., Farihi, J., Gänsicke, B. T., & Bergfors, C. 2015, MNRAS, 449, 574 [NASA ADS] [CrossRef] [Google Scholar]
- Roell, T., Neuhäuser, R., Seifahrt, A., & Mugrauer, M. 2012, A&A, 542, A92 [NASA ADS] [CrossRef] [EDP Sciences] [Google Scholar]
- Rogers, L. K., Bonsor, A., Xu, S., et al. 2024, MNRAS, 527, 6038 [Google Scholar]
- Sayres, C., Subasavage, J. P., Bergeron, P., et al. 2012, AJ, 143, 103 [NASA ADS] [CrossRef] [Google Scholar]
- Schmidt, G. D., & Smith, P. S. 1994, ApJ, 423, L63 [NASA ADS] [CrossRef] [Google Scholar]
- Schmidt, G. D., & Smith, P. S. 1995, ApJ, 448, 305 [NASA ADS] [CrossRef] [Google Scholar]
- Schreiber, M. R., Gänsicke, B. T., Toloza, O., Hernandez, M.-S., & Lagos, F. 2019, ApJ, 887, L4 [Google Scholar]
- Schreiber, M. R., Belloni, D., Gänsicke, B. T., & Parsons, S. G. 2021, MNRAS, 506, L29 [NASA ADS] [CrossRef] [Google Scholar]
- Shappee, B. J., & Thompson, T. A. 2013, ApJ, 766, 64 [NASA ADS] [CrossRef] [Google Scholar]
- Shipman, H. L., & Greenstein, J. L. 1983, ApJ, 266, 761 [NASA ADS] [CrossRef] [Google Scholar]
- Shipman, H. L., Greenstein, J. L., & Boksenberg, A. 1977, AJ, 82, 480 [NASA ADS] [CrossRef] [Google Scholar]
- Sion, E. M., & Starrfield, S. G. 1984, ApJ, 286, 760 [NASA ADS] [CrossRef] [Google Scholar]
- Sion, E. M., Aannestad, P. A., & Kenyon, S. J. 1988, ApJ, 330, L55 [NASA ADS] [CrossRef] [Google Scholar]
- Steele, A., Debes, J., Xu, S., Yeh, S., & Dufour, P. 2021, ApJ, 911, 25 [NASA ADS] [CrossRef] [Google Scholar]
- Stephenson, C. B. 1986, AJ, 91, 144 [NASA ADS] [CrossRef] [Google Scholar]
- Subasavage, J. P., Henry, T. J., Bergeron, P., et al. 2007, AJ, 134, 252 [NASA ADS] [CrossRef] [Google Scholar]
- Subasavage, J. P., Jao, W.-C., Henry, T. J., et al. 2017, AJ, 154, 32 [Google Scholar]
- Swan, A., Farihi, J., Koester, D., et al. 2019, MNRAS, 490, 202 [NASA ADS] [CrossRef] [Google Scholar]
- Swan, A., Kenyon, S. J., Farihi, J., et al. 2021, MNRAS, 506, 432 [NASA ADS] [CrossRef] [Google Scholar]
- Swan, A., Farihi, J., Melis, C., et al. 2023, MNRAS, 526, 3815 [NASA ADS] [CrossRef] [Google Scholar]
- Swan, A., Farihi, J., Su, K. Y. L., & Desch, S. J. 2024, MNRAS, 529, L41 [Google Scholar]
- Tappert, C., Gänsicke, B. T., Schmidtobreick, L., & Ribeiro, T. 2011, A&A, 532, A129 [NASA ADS] [CrossRef] [EDP Sciences] [Google Scholar]
- Tremblay, P. E., Fontaine, G., Freytag, B., et al. 2015, ApJ, 812, 19 [Google Scholar]
- Tremblay, P. E., Hollands, M. A., Gentile Fusillo, N. P., et al. 2020, MNRAS, 497, 130 [NASA ADS] [CrossRef] [Google Scholar]
- Trierweiler, I. L., Doyle, A. E., & Young, E. D. 2023, arXiv e-prints [arXiv:2306.03743] [Google Scholar]
- Upgren, A. R., Grossenbacher, R., Penhallow, W. S., MacConnell, D. J., & Frye, R. L. 1972, AJ, 77, 486 [NASA ADS] [CrossRef] [Google Scholar]
- Valyavin, G., Shulyak, D., Wade, G. A., et al. 2014, Nature, 515, 88 [NASA ADS] [CrossRef] [Google Scholar]
- van Maanen, A. 1917, PASP, 29, 258 [Google Scholar]
- Vennes, S., & Kawka, A. 2013, ApJ, 779, 70 [NASA ADS] [CrossRef] [Google Scholar]
- Vennes, S., Kawka, A., & Németh, P. 2010, MNRAS, 404, L40 [NASA ADS] [CrossRef] [Google Scholar]
- Vennes, S., Kawka, A., & Németh, P. 2011, MNRAS, 413, 2545 [CrossRef] [Google Scholar]
- Vennes, S., Nemeth, P., Kawka, A., et al. 2017, Science, 357, 680 [Google Scholar]
- Vennes, S., Kawka, A., Klein, B. L., et al. 2024, MNRAS, 527, 3122 [Google Scholar]
- Veras, D. 2016, Roy. Soc. Open Sci., 3, 150571 [NASA ADS] [CrossRef] [Google Scholar]
- Veras, D., Evans, N. W., Wyatt, M. C., & Tout, C. A. 2014a, MNRAS, 437, 1127 [Google Scholar]
- Veras, D., Leinhardt, Z. M., Bonsor, A., & Gänsicke, B. T. 2014b, MNRAS, 445, 2244 [NASA ADS] [CrossRef] [Google Scholar]
- Veras, D., Leinhardt, Z. M., Eggl, S., & Gänsicke, B. T. 2015, MNRAS, 451, 3453 [NASA ADS] [CrossRef] [Google Scholar]
- Veras, D., Birader, Y., & Zaman, U. 2022, MNRAS, 510, 3379 [NASA ADS] [CrossRef] [Google Scholar]
- von Hippel, T., Kuchner, M. J., Kilic, M., Mullally, F., & Reach, W. T. 2007, ApJ, 662, 544 [Google Scholar]
- Wachlin, F. C., Vauclair, G., Vauclair, S., & Althaus, L. G. 2022, A&A, 660, A30 [NASA ADS] [CrossRef] [EDP Sciences] [Google Scholar]
- Walters, N., Farihi, J., Dufour, P., Pineda, J. S., & Izzard, R. G. 2023, MNRAS, 524, 5096 [CrossRef] [Google Scholar]
- Wegner, G. 1973, MNRAS, 163, 381 [NASA ADS] [CrossRef] [Google Scholar]
- Wehrse, R., & Liebert, J. 1980, A&A, 86, 139 [NASA ADS] [Google Scholar]
- Werner, K., Rauch, T., Ringat, E., & Kruk, J. W. 2012, ApJ, 753, L7 [Google Scholar]
- Werner, K., Rauch, T., & Kruk, J. W. 2015, A&A, 582, A94 [NASA ADS] [CrossRef] [EDP Sciences] [Google Scholar]
- Werner, K., Rauch, T., & Kruk, J. W. 2017, A&A, 601, A8 [NASA ADS] [CrossRef] [EDP Sciences] [Google Scholar]
- Werner, K., Rauch, T., Knörzer, M., & Kruk, J. W. 2018, A&A, 614, A96 [NASA ADS] [CrossRef] [EDP Sciences] [Google Scholar]
- Wesemael, F. 1979, A&A, 72, 104 [NASA ADS] [Google Scholar]
- Wickramasinghe, D. T., & Martin, B. 1986, MNRAS, 223, 323 [NASA ADS] [CrossRef] [Google Scholar]
- Wilson, D. J., Gänsicke, B. T., Koester, D., et al. 2014, MNRAS, 445, 1878 [Google Scholar]
- Wilson, D. J., Gänsicke, B. T., Farihi, J., & Koester, D. 2016, MNRAS, 459, 3282 [NASA ADS] [CrossRef] [Google Scholar]
- Wilson, D. J., Gänsicke, B. T., Koester, D., et al. 2015, MNRAS, 451, 3237 [NASA ADS] [CrossRef] [Google Scholar]
- Wilson, D. J., Gänsicke, B. T., Koester, D., et al. 2019a, MNRAS, 483, 2941 [NASA ADS] [CrossRef] [Google Scholar]
- Wilson, T. G., Farihi, J., Gänsicke, B. T., & Swan, A. 2019b, MNRAS, 487, 133 [CrossRef] [Google Scholar]
- Wolff, B., Jordan, S., Koester, D., & Reimers, D. 2000, A&A, 361, 629 [NASA ADS] [Google Scholar]
- Wolff, B., Koester, D., & Liebert, J. 2002, A&A, 385, 995 [NASA ADS] [CrossRef] [EDP Sciences] [Google Scholar]
- Xu, S., Jura, M., Klein, B., Koester, D., & Zuckerman, B. 2013, ApJ, 766, 132 [NASA ADS] [CrossRef] [Google Scholar]
- Xu, S., Jura, M., Koester, D., Klein, B., & Zuckerman, B. 2014, ApJ, 783, 79 [NASA ADS] [CrossRef] [Google Scholar]
- Xu, S., Zuckerman, B., Dufour, P., et al. 2017, ApJ, 836, L7 [Google Scholar]
- Xu, S., Dufour, P., Klein, B., et al. 2019, AJ, 158, 242 [NASA ADS] [CrossRef] [Google Scholar]
- Zeidler-K. T., E. M., Weidemann, V., & Koester, D. 1986, A&A, 155, 356 [NASA ADS] [Google Scholar]
- Zuckerman, B. 2014, ApJ, 791, L27 [NASA ADS] [CrossRef] [Google Scholar]
- Zuckerman, B. 2015, in Astronomical Society of the Pacific Conference Series, 493, 19th European Workshop on White Dwarfs, eds. P. Dufour, P. Bergeron, & G. Fontaine, 291 [Google Scholar]
- Zuckerman, B., & Becklin, E. E. 1987, Nature, 330, 138 [NASA ADS] [CrossRef] [Google Scholar]
- Zuckerman, B., & Reid, I. N. 1998, ApJ, 505, L143 [Google Scholar]
- Zuckerman, B., Koester, D., Reid, I. N., & Hünsch, M. 2003, ApJ, 596, 477 [Google Scholar]
- Zuckerman, B., Koester, D., Melis, C., Hansen, B. M., & Jura, M. 2007, ApJ, 671, 872 [Google Scholar]
- Zuckerman, B., Melis, C., Klein, B., Koester, D., & Jura, M. 2010, ApJ, 722, 725 [Google Scholar]
- Zuckerman, B., Koester, D., Dufour, P., et al. 2011, ApJ, 739, 101 [NASA ADS] [CrossRef] [Google Scholar]
- Zuckerman, B., Xu, S., Klein, B., & Jura, M. 2013, ApJ, 770, 140 [NASA ADS] [CrossRef] [Google Scholar]
Unless explicitly mentioned, abundances are expressed by number throughout the paper.
Hence we excluded white dwarfs with photospheric metals caused purely by radiative levitation with no evidence of recent accretion (Chayer et al. 1995) or dredge-up (Koester et al. 2020; Bédard et al. 2022) and extremely hot white dwarfs that have not yet gravitationally settled and hence exhibit metal-rich atmospheres (Werner et al. 2017, 2018), accretion from winds of close stellar or sub-stellar companions (e.g. O’Donoghue et al. 2003; Debes 2006; Tappert et al. 2011; Pyrzas et al. 2012; Walters et al. 2023), or the very metal-rich, partially burned remnants of thermonuclear supernovae (Vennes et al. 2017; Raddi et al. 2019; Gänsicke et al. 2020).
In hot (Teff ≳ 20 000 K) H atmospheres, radiative levitation can balance gravity and hence sustain metals for prolonged periods of time. However, hot and young white dwarfs are relatively rare within the overall white dwarf population. The presence of photospheric metals from accretion and radiative levitation can be distinguished by modelling the predicted abundances from radiative levitation alone (Chayer 2014; Koester et al. 2014a).
Additionally, many large scale surveys focus exclusively on the detection of Ca (e.g. Kepler et al. 2015, 2016, 2021; Coutu et al. 2019; Kilic et al. 2020) and overlook absorption features that indicate the presence of other metals.
When comparing to Solar System objects, Mg, Si, or Fe are traditionally used, but any metal can be selected as a reference.
If the composition is not consistent with a dry, rocky body, additional metals may be required, such as C for an ice-dominated body.
It should be noted that this is a minimum separation, since the unknown inclination reduces the apparent distance between the stars.
WD J091621.31+254029.10 (Hollands et al. 2018a) is not recovered in the cone search since it is the tertiary member of an hierarchical triple star system. Additionally, SDSS J080740.69+493059.7 (Hollands et al. 2018a) fails the quality cut. Since both are confirmed as binaries in the literature, they are included in Table A.1.
All Tables
Metal-enriched white dwarfs in wide binaries with properties of their companion star.
References for all white dwarfs with entries in PEWDD at the time of publication.
All Figures
|
Fig. 1 Atmospheric composition of the white dwarfs in PEWDD. “H + Z” and “He + Z” have atmospheres dominated by H and He, respectively, with traces of metals. The white dwarfs with “H + He + Z” and “He + H + Z” have H- or He-dominated atmospheres with traces of both metals and He or H, respectively. |
| In the text | |
|
Fig. 2 Periodic table highlighting the frequency of metal detection in metal-enriched white dwarfs. The number in each box represents how many white dwarfs have detections of that photospheric metal. The colours represent the Goldschmidt classification (Goldschmidt 1937), which groups metals into their geochemical preferences with atmophiles (gas-loving; blue), lithophiles (silicate-loving; green), chalcophiles (sulfur-loving; yellow) and siderophiles (iron-loving; red). Metals that have two colours within their box exhibit both siderophilic and lithophilic characteristics. The box containing H indicates the number of He-atmosphere white dwarfs with trace-H detections and vice versa for the box with He. |
| In the text | |
|
Fig. 3 Number of detections of individual elements as a function of Teff. The colours are related to the Goldschmidt classification, as described in Fig. 2. The black histograms show the temperature distribution for all metal detections, normalised to match that of the individual elements. |
| In the text | |
|
Fig. 4 Upper and lower abundance bounds for all metals detected in H- (blue) and He- (orange) dominated white dwarf atmospheres. The absence of a bound means that the metal has not been observed (Be and Co in a H-dominated white dwarf atmosphere). The single dashes represent metals that have only been detected in a single white dwarf of a certain atmosphere composition. |
| In the text | |
|
Fig. 5 Frequency of metal-enriched white dwarfs as a function of detected photospheric metals. White dwarfs with multiple abundance analyses are combined to find the total number of metals for each object. H and He are not counted. |
| In the text | |
|
Fig. 6 Abundance ratio diagram comparing O and Fe with the reference metal Si. The coloured dots are different classes of meteorites (Nittler et al. 2004) and the black symbols are large Solar System objects (McDonough 2000; Lodders 2003, CI = chondrites and BSE = bulk silicate Earth). Six metal-enriched white dwarfs with diverse abundances are shown as examples (GD 424, Izquierdo et al. 2021; WD 1415+234, Doyle et al. 2023; GD 362, Xu et al. 2013; Ton 345, Wilson et al. 2015; EC 20444−1310 also known as WD 2047−1259, Hoskin et al. 2020, and SDSS J095645.14+591240.6, Hollands et al. 2022). The diagonal lines track the abundances back through time, assuming the star is observed in the decreasing phase. Each small point on the diagonal line represents the corrected abundance of the accreted body if accretion had ceased one Si sinking timescale ago. Diagrams like this can be created with any combination of metals available within PEWDD and the PYTHON code that we provide. The evolutionary lines require that the sinking timescales were published as well. |
| In the text | |
|
Fig. 7 Mass fractions for six parent bodies accreted onto white dwarfs. The white dwarfs shown as bar charts on the left and pie charts on the right, illustrate the diversity in compositions: bulk Earth for GD 424 (Izquierdo et al. 2021); core-rich material for PG 0843+516 (Gänsicke et al. 2012); mantle- and crust-rich material for SDSS J104341.54+085558.1 (Melis & Dufour 2017); an unusual composition for G 238-44 – likely a combination of an iron-rich and icy object (Johnson et al. 2022); a hydrated carbonaceous chondrite for EC 20444 – 1310 (also known as WD J2047 – 1259; Hoskin et al. 2020); and a comet for WD 1425+540 (Xu et al. 2017). These diagrams were created using PEWDD and the PYTHON code that we provide. |
| In the text | |
|
Fig. 8 Spread of abundances for each metal detected in a white dwarf atmosphere (green) compared to the median of the quoted errors (red). The size of each point represents the number of measurements that were used to calculate each spread on the metal, with larger points representing more measurements. |
| In the text | |
|
Fig. 9 Comparison of abundances taken from different studies of the same white dwarfs. The figure illustrates the range of measurements obtained due to using different observations and models. Each axis is 2 dex wide. The upper-left panel shows Si and Fe photospheric abundances for GALEX J193156.8+011745 (Vennes et al. 2010; Melis et al. 2011; Vennes et al. 2011; Gänsicke et al. 2012). The upper-right panel shows Ca and Fe photospheric abundances for GD 378 (Dupuis et al. 1993; Wolff et al. 2002; Desharnais et al. 2008; Klein et al. 2021). The bottom-left panel presents photospheric Ca and Mg abundances for PG 1015+161 (Kawka et al. 2011; Gänsicke et al. 2012; Xu et al. 2019). The bottom-right panel contains photospheric abundances of Fe and Mg for GD 40 (Shipman & Greenstein 1983; Dupuis et al. 1993; Friedrich et al. 1999; Klein et al. 2010; Jura et al. 2012). |
| In the text | |
|
Fig. 10 Total accretion rates onto white dwarfs with H- (blue hexagons) and He- (orange pentagons) dominated atmospheres as a function of temperature. The left panel shows total accretion rates extrapolated from that of ṀCa (or ṀSi if Ca was not detected), assuming that the accreted material has bulk Earth abundance (McDonough 2000) with a Ca (Si) mass fraction of 1.71% (16%). The red rings and green diamonds highlight the systems where infrared excesses and gas emission have been detected respectively, implying the presence of a circumstellar disc. The right panel compares the extrapolated total accretion rate to the sum of the accretion rates of O, Mg, Si and Fe, which make up approximately 95% of the bulk Earth, represented by stars. |
| In the text | |
|
Fig. 11 Minimum masses of accreted material within white dwarf atmospheres as a function of temperature. The left panel shows the minimum mass of planetary material in the mixing zones of H- and He-dominated white dwarfs, represented by blue hexagons and orange pentagons, respectively. For He-dominated white dwarfs, the mixing zone is defined as the convection zone, whereas for warmer H-dominated white dwarfs, it is defined as the region above optical depth τR ≲ 5. Examples of a variety of Solar System objects are included for comparison. The right panel expresses the evolution of the mixing zone mass with decreasing Teff and increasing cooling age. The much lower mixing zone masses of the two He-dominated white dwarfs with Teff > 15 000 K (WD1536+520 (Farihi et al. 2016) and WD J2047–1259 (Hoskin et al. 2020)) arise from the large amounts of trace H (log(H/He) ≃−1 to −2) in their atmospheres. |
| In the text | |
|
Fig. 12 Magnetic field strength as a function of cooling age for metal-enriched H- and He-dominated white dwarfs from PEWDD. The black horizontal dashed line illustrates the threshold for detecting Zeeman splitting in flux spectra. The coloured horizontal dotted lines show the median values of magnetic field strength for H- (blue pentagons) and He- (orange hexagons) dominated atmospheres. The upper histogram shows the fraction of magnetic white dwarfs compared to the total number of metal-enriched white dwarfs in PEWDD. The right histogram illustrates the distribution of magnetic field strengths for H- and He-dominated white dwarfs. The points below the detection threshold are white dwarfs where no magnetic field has been detected, scattered to show the cooling age distribution compared to their magnetic counterparts. |
| In the text | |
|
Fig. 13 Distribution of metal-enriched white dwarfs in wide binaries from Table A.1 as a function of projected separation. The top panel shows the estimated initial projected separation been when both stars in the binary were on the main sequence, whereas the bottom panel shows the observed projected separation. The vertical line corresponds to a separation of 1000 au, which Zuckerman (2014) identified as a thresh-old below which the frequency of metal-enrichment decreases. |
| In the text | |
Current usage metrics show cumulative count of Article Views (full-text article views including HTML views, PDF and ePub downloads, according to the available data) and Abstracts Views on Vision4Press platform.
Data correspond to usage on the plateform after 2015. The current usage metrics is available 48-96 hours after online publication and is updated daily on week days.
Initial download of the metrics may take a while.