Fig. 9
Download original image
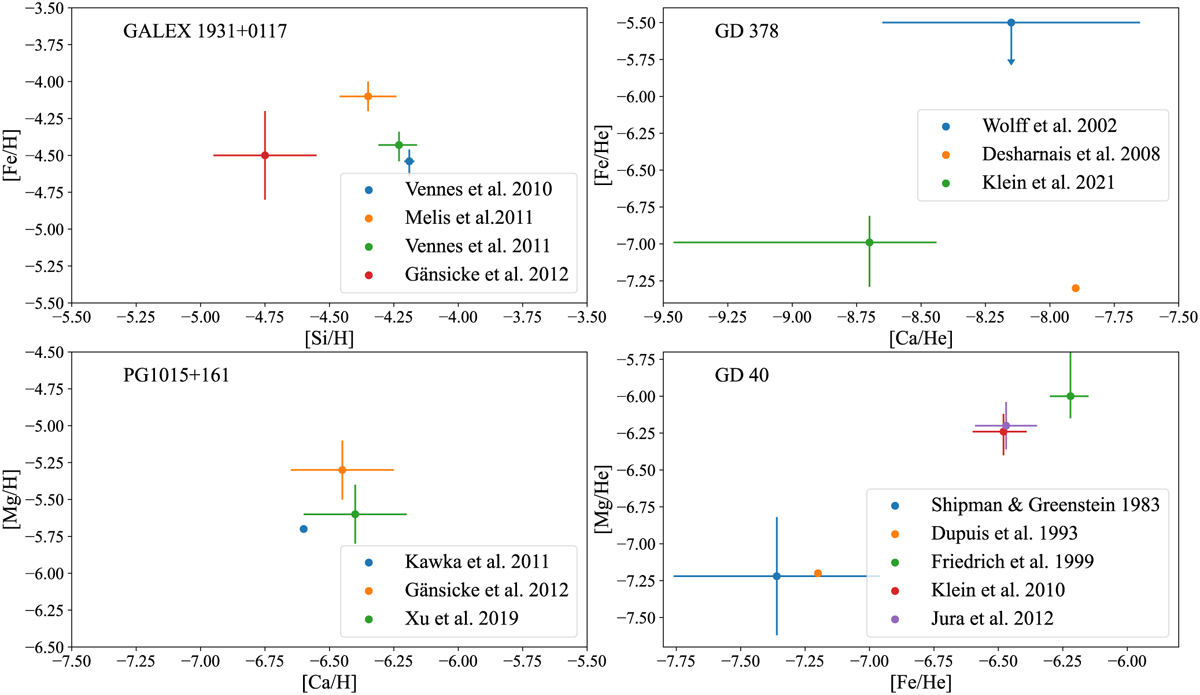
Comparison of abundances taken from different studies of the same white dwarfs. The figure illustrates the range of measurements obtained due to using different observations and models. Each axis is 2 dex wide. The upper-left panel shows Si and Fe photospheric abundances for GALEX J193156.8+011745 (Vennes et al. 2010; Melis et al. 2011; Vennes et al. 2011; Gänsicke et al. 2012). The upper-right panel shows Ca and Fe photospheric abundances for GD 378 (Dupuis et al. 1993; Wolff et al. 2002; Desharnais et al. 2008; Klein et al. 2021). The bottom-left panel presents photospheric Ca and Mg abundances for PG 1015+161 (Kawka et al. 2011; Gänsicke et al. 2012; Xu et al. 2019). The bottom-right panel contains photospheric abundances of Fe and Mg for GD 40 (Shipman & Greenstein 1983; Dupuis et al. 1993; Friedrich et al. 1999; Klein et al. 2010; Jura et al. 2012).
Current usage metrics show cumulative count of Article Views (full-text article views including HTML views, PDF and ePub downloads, according to the available data) and Abstracts Views on Vision4Press platform.
Data correspond to usage on the plateform after 2015. The current usage metrics is available 48-96 hours after online publication and is updated daily on week days.
Initial download of the metrics may take a while.