Open Access
Fig. 8
Download original image
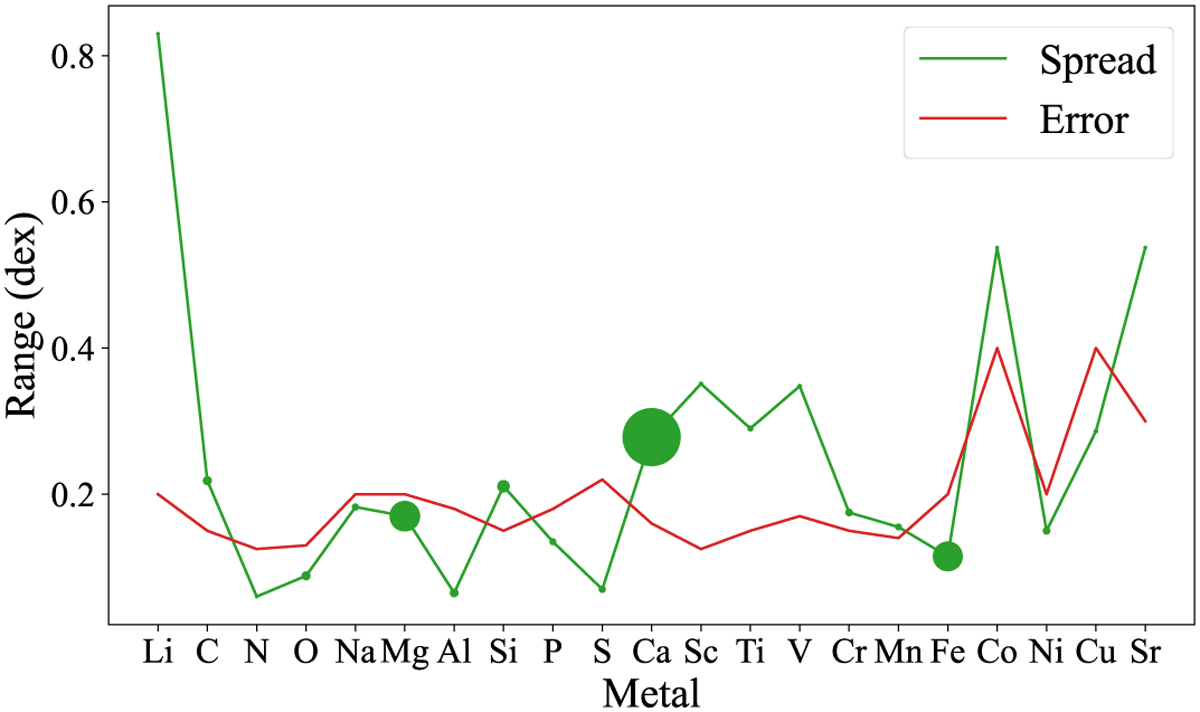
Spread of abundances for each metal detected in a white dwarf atmosphere (green) compared to the median of the quoted errors (red). The size of each point represents the number of measurements that were used to calculate each spread on the metal, with larger points representing more measurements.
Current usage metrics show cumulative count of Article Views (full-text article views including HTML views, PDF and ePub downloads, according to the available data) and Abstracts Views on Vision4Press platform.
Data correspond to usage on the plateform after 2015. The current usage metrics is available 48-96 hours after online publication and is updated daily on week days.
Initial download of the metrics may take a while.