Fig. 6
Download original image
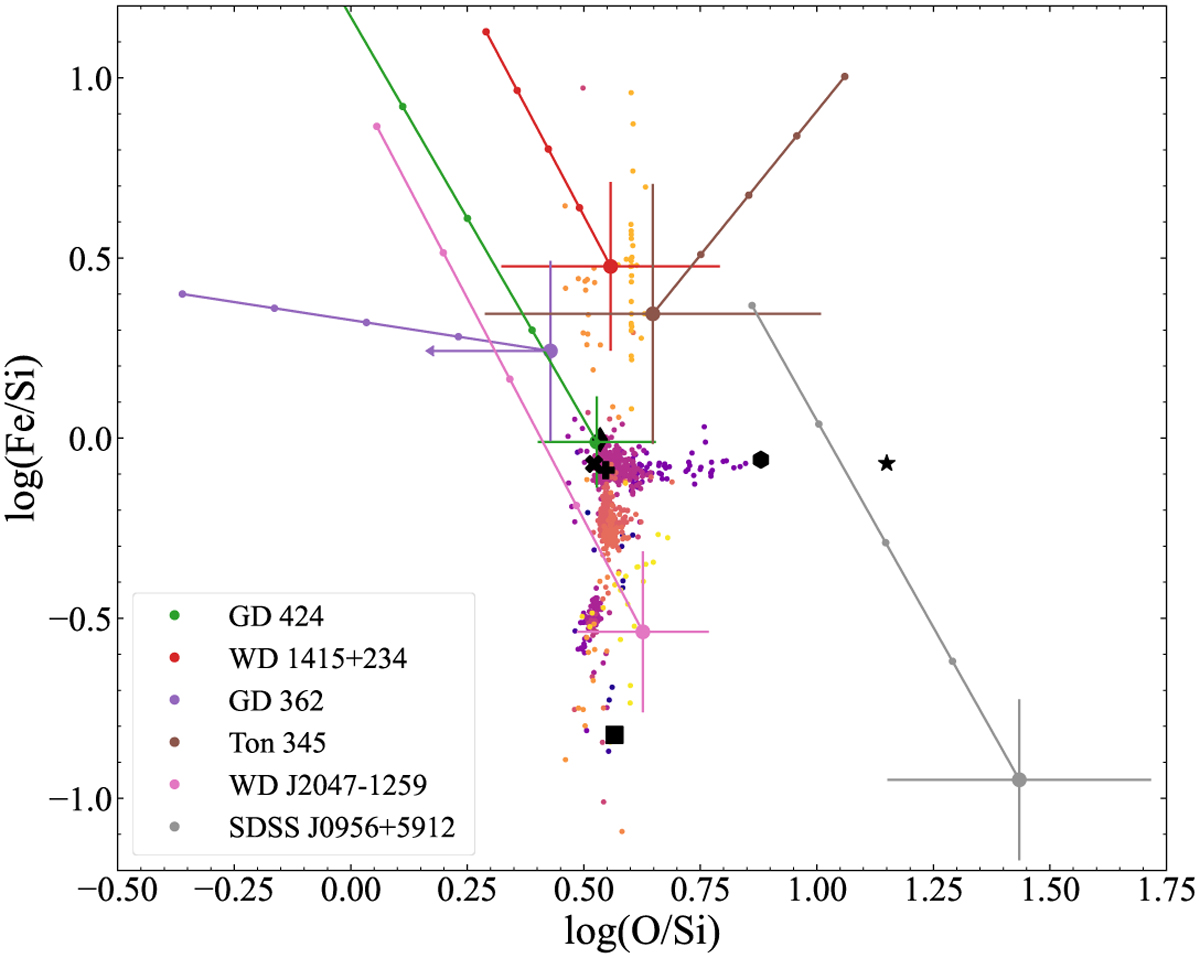
Abundance ratio diagram comparing O and Fe with the reference metal Si. The coloured dots are different classes of meteorites (Nittler et al. 2004) and the black symbols are large Solar System objects (McDonough 2000; Lodders 2003, CI = chondrites and BSE = bulk silicate Earth). Six metal-enriched white dwarfs with diverse abundances are shown as examples (GD 424, Izquierdo et al. 2021; WD 1415+234, Doyle et al. 2023; GD 362, Xu et al. 2013; Ton 345, Wilson et al. 2015; EC 20444−1310 also known as WD 2047−1259, Hoskin et al. 2020, and SDSS J095645.14+591240.6, Hollands et al. 2022). The diagonal lines track the abundances back through time, assuming the star is observed in the decreasing phase. Each small point on the diagonal line represents the corrected abundance of the accreted body if accretion had ceased one Si sinking timescale ago. Diagrams like this can be created with any combination of metals available within PEWDD and the PYTHON code that we provide. The evolutionary lines require that the sinking timescales were published as well.
Current usage metrics show cumulative count of Article Views (full-text article views including HTML views, PDF and ePub downloads, according to the available data) and Abstracts Views on Vision4Press platform.
Data correspond to usage on the plateform after 2015. The current usage metrics is available 48-96 hours after online publication and is updated daily on week days.
Initial download of the metrics may take a while.