Open Access
Fig. 3
Download original image
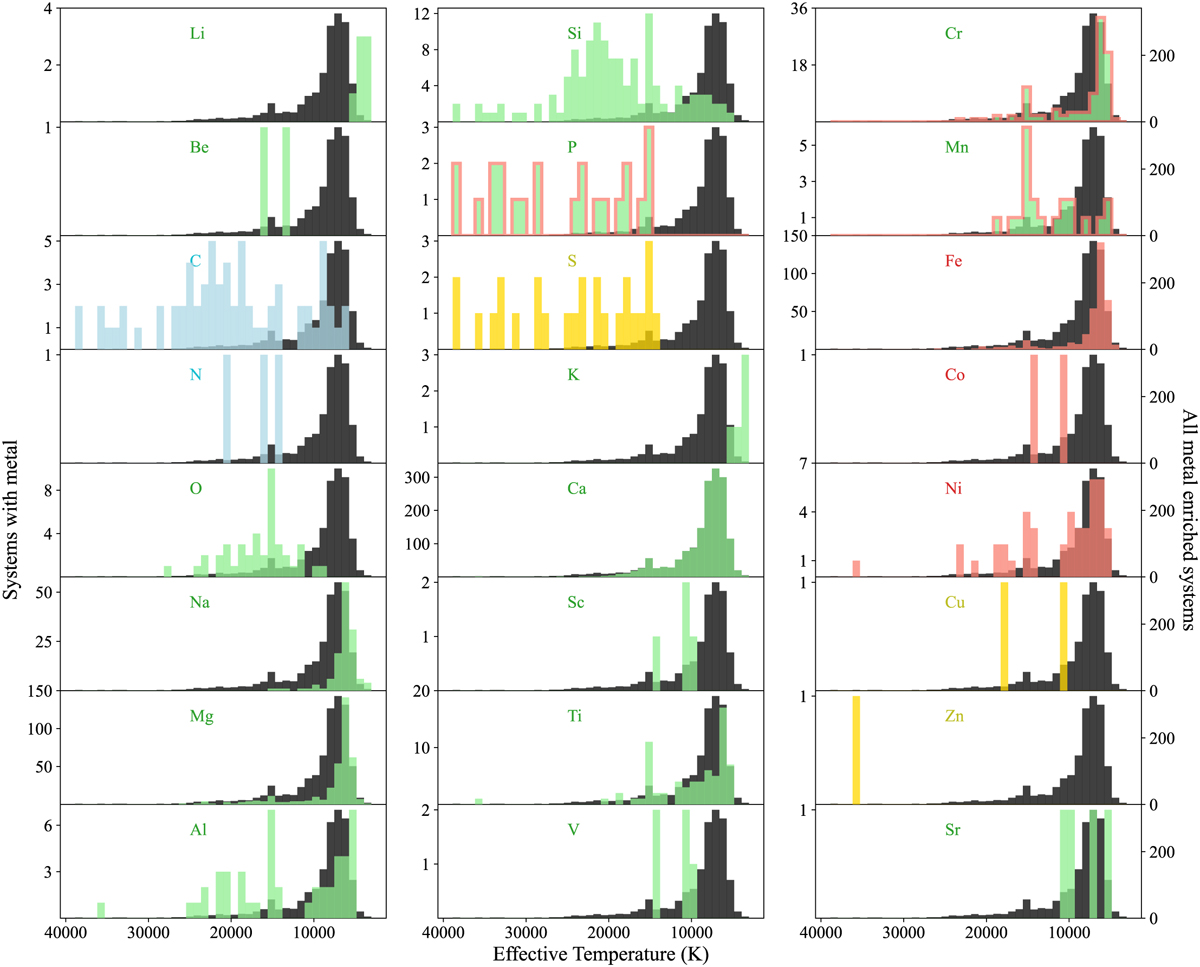
Number of detections of individual elements as a function of Teff. The colours are related to the Goldschmidt classification, as described in Fig. 2. The black histograms show the temperature distribution for all metal detections, normalised to match that of the individual elements.
Current usage metrics show cumulative count of Article Views (full-text article views including HTML views, PDF and ePub downloads, according to the available data) and Abstracts Views on Vision4Press platform.
Data correspond to usage on the plateform after 2015. The current usage metrics is available 48-96 hours after online publication and is updated daily on week days.
Initial download of the metrics may take a while.