| Issue |
A&A
Volume 690, October 2024
|
|
|---|---|---|
| Article Number | A49 | |
| Number of page(s) | 21 | |
| Section | Galactic structure, stellar clusters and populations | |
| DOI | https://doi.org/10.1051/0004-6361/202449537 | |
| Published online | 27 September 2024 | |
Linear polarization study of open clusters in the anticenter direction: Signature of the spiral arms
1
Institute of Astrophysics, Foundation for Research and Technology-Hellas,
71110
Heraklion,
Greece
2
Physical Research Laboratory,
Ahmedabad,
380009
Gujarat,
India
3
Indian Institute of Technology,
Gandhinagar,
382355
Gujarat,
India
4
Université Libre de Bruxelles, Science Faculty CP230,
1050
Brussels,
Belgium
5
Aryabhatta Research Institute of Observational Sciences,
Manora Peak,
Nainital
263002,
India
★ Corresponding author; This email address is being protected from spambots. You need JavaScript enabled to view it.
Received:
8
February
2024
Accepted:
4
August
2024
Abstract
Aims. Our objective is to investigate the distribution of dust and associated large-scale structures of the Galaxy using optical linear polarization measurements of various open clusters located at different distances in the Galactic anticenter direction.
Methods. We present R-band linear polarization observations of stars toward five open clusters: Kronberger 1, Berkeley 69, Berkeley 71, Berkeley 19, and King 8 in the anticenter direction. The polarization observations were carried out using the ARIES (Aryabhatta Research Institute of Observational Sciences) IMaging POLarimeter mounted on the 104 cm Sampurnanand telescope of ARIES, Nainital, making it the first study to target the polarization observations toward distant clusters (~6 kpc). We combined the observed polarization data with the distance information from the Gaia space telescope to infer the dust distribution along the line of sight.
Results. The variation in the degree of polarization and extinction with distance reveals multiple dust layers in each cluster direction. In addition, common foreground-dust layers detected toward different cluster directions highlight global features such as spiral arms. Our results show that the dust clouds at 2 kpc toward Berkeley 69 and Berkeley 71 coincide with the Perseus arm, while the dust layer at ~4 kpc toward the distant clusters Berkeley 19 and King 8 indicates the presence of the Outer arm. The large-scale dust distribution obtained by combining our polarization results with previous polarization studies of nearby open clusters suggests that the anticenter direction is characterized by a low-extinction homogeneous dust distribution with a somewhat uniform orientation of the plane-of-sky component of the magnetic field along the line of sight.
Conclusions. Our study demonstrates that polarization is useful as a tool for studying the large-scale dust distribution and structural features where kinematic distance methods are inadequate and cannot provide accurate distances to the dust clouds. The global dust distribution in the anticenter direction shows signatures of the intervening spiral arms.
Key words: methods: observational / techniques: polarimetric / dust, extinction / open clusters and associations: general / Galaxy: structure
© The Authors 2024
 Open Access article, published by EDP Sciences, under the terms of the Creative Commons Attribution License (https://creativecommons.org/licenses/by/4.0), which permits unrestricted use, distribution, and reproduction in any medium, provided the original work is properly cited.
This article is published in open access under the Subscribe to Open model. This email address is being protected from spambots. You need JavaScript enabled to view it. to support open access publication.
1 Introduction
Tracing the distribution of dust in the Galaxy is of paramount importance for mapping its structure. Numerous attempts have been made to create three-dimensional (3D) extinction maps of the Milky Way galaxy to uncover the dust distribution (e.g., Lallement et al. 2019; Green et al. 2019; Lallement et al. 2022; Vergely et al. 2022; Edenhofer et al. 2024). However, these maps rely on models and assumptions that might introduce inherent biases, such as assumptions regarding the intrinsic spectral energy distributions (SEDs) of the stars that are used to determine the extinction. Another notable property demonstrated by dust grains is starlight polarization. An unpolarized light beam is dichroically extincted when it passes through the asymmetrical but aligned dust grains. In other words, when unpolarized light from the stars interacts with partially aligned optically anisotropic (e.g., elongated) dust grains, a part of the light is absorbed by these grains. The electric field vector parallel to the longer axis of the grain is preferentially absorbed because its cross-sectional area is larger. Consequently, the scattered light becomes partially plane polarized along the short axis of the grain (Hall 1949; Hiltner 1949). Moreover, the dust grains are aligned with their shorter axis in the direction parallel to the ambient magnetic field (Davis & Greenstein 1949). Hence, the polarization angles indicate the plane-of-sky orientation of the magnetic field. In a broader context, the polarization of starlight caused by interstellar dust is regarded as a valuable tool for determining various properties of the interstellar medium (ISM), such as the geometry of the magnetic field (e.g., Mathewson & Ford 1971; Goodman et al. 1990; Clemens et al. 2020) and grain properties such as size, shape, chemical composition, and grain alignment efficiency (e.g., Kim & Martin 1994; Voshchinnikov & Das 2008; Papoular 2018). Furthermore, combining polarization data with accurate distance information provides observational constraints on the number of dust clouds and their distances along the line of sight (e.g., Eswaraiah et al. 2012; Panopoulou et al. 2019; Doi et al. 2021; Uppal et al. 2022; Bijas et al. 2022; Doi et al. 2024; Pelgrims et al. 2023, 2024), thereby enabling a more comprehensive understanding of its distribution within the Galaxy.
Open clusters are essential constituents of the Galactic disk, and their distribution has been studied as a means of tracing the spiral arm structure of the Galaxy (e.g., Castro-Ginard et al. 2021; Hao et al. 2021). These clusters are ideal for polarization observations as all of their member stars possess common properties such as distance, age, and proper motion. Moreover, several stars that lie at similar distances and locations in the sky will provide statistically more robust results than randomly selected stars. The polarization data from various clusters can be used to examine the dust distribution in the Galactic disk, particularly in the spiral arms. Polarization studies of open clusters have been used to identify the number of foreground dust layers, constrain the distance of foreground clouds (e.g., Eswaraiah et al. 2012; Singh et al. 2020; Singh & Pandey 2020; Uppal et al. 2022; Singh et al. 2022) and cluster membership (Medhi & Tamura 2013), and to gain insight into the properties of the dust (e.g., Medhi et al. 2008; Eswaraiah et al. 2011, 2012; Topasna et al. 2018; Singh et al. 2020, 2022; Singh & Pandey 2020; Bijas et al. 2024, and references therein). The linear polarization study of open clusters combined with the distance information from the Gaia early data release 3 (EDR3, Gaia Collaboration 2021b) can assist in tracing the dust distribution.
Motivated by the idea of tracing the spiral arms from the dust distribution, we chose to study several clusters in a similar line of sight that lie at different distances in the direction of the anticenter. In contrast to the direction of the Galactic center, the anticenter direction is less crowded and has less dust extinction (Gaia Collaboration 2021a), providing a unique opportunity to perform polarization observations of open clusters at distant locations of the disk. Notably, the kinematic distances derived from the radial velocity measurements of dust clouds at longer wavelengths in anticenter directions did not provide reliable results (e.g., Wenger et al. 2018; Hunter et al. 2024), which was attributed to the very small radial velocity component in this particular direction. Consequently, employing the polarization of background starlight in combination with distance emerges as the most effective method for determining the distance to foreground dust layers in this direction.
In the literature, only five clusters have been studied in terms of their polarization measurements in the anticenter direction. These include NGC 2281 (Eswaraiah et al. 2011), NGC 1960 (Eswaraiah et al. 2011), Stock 8 (Eswaraiah et al. 2011), NGC 1931 (Pandey et al. 2013), and NGC 1893 (Eswaraiah et al. 2011; Bijas et al. 2022). However, it is noteworthy that most of these clusters are located at distances smaller than 2.5 kpc. To investigate the dust distribution in the distant regions, we targeted five Galactic open clusters, Kronberger 1, Berkeley 69, Berkeley 71, Berkeley 19, and King 8, toward a similar line of sight and distributed according to distance. These clusters span a distance range of ~2–6 kpc (see Col. 6 in Table 1).
The paper is organized as follows. Section 2 delves into the observations of the five clusters, the data reduction procedure, and details about the archival data used to complement the observations. Section 3 describes the polarization results based on the sky map and the distribution of stars in the degree of polarization and polarization angle (P–θ) plane. The dust distribution at local and global scales, using the polarization results along with archival cluster polarimetric data, is discussed in Sect. 4. Finally, the conclusion of the paper is presented in Sect. 5.
Observation log for open clusters observed in the anticenter direction from AIMPOL along with the distance to the respective cluster (Hunt & Reffert 2023).
2 Data
2.1 Observations and data reduction
The observations of five clusters, Kronberger 1, Berkeley 69, Berkeley 71, King 8, and Berkeley 19, were carried out on dark nights from October 19, 2022, to October 23, 2022. An observation log is provided in Table 1, in which the clusters are listed in ascending order of their distance, and the same ordering is followed in the rest of the text. The polarization observations were conducted using the ARIES IMaging POLarimeter (AIMPOL, Rautela et al. 2004; Pandey et al. 2023) instrument mounted at the Cassegrain focus of the 1.04 m, f/13 Sampurnanad telescope. The instrument consists of an achromatic rotating half wave-plate (HWP), which helps us to modulate the intensity of the star, and a Wollaston prism, which is used as an analyzer. The Wollaston splits the incoming light into ordinary (o-ray, Io) and extraordinary rays (e-ray, Ie), which are focused on the same detector plane, but with a separation of ~34 pixels. A liquid nitrogen-cooled pylon charged coupled device (CCD), with dimensions of 1300 × 1340 and a pixel size of 20 µm ×20 µm, is used to detect the light passing through the instrument, giving a total field of view of ~8′. Different readout speeds (50, 100, 200, and 500 kHz, and 1, 2, and 4 MHz) and gain (low, medium, and high) options are available in the CCD. All the clusters were observed in Johnson-Cousins R band (λeff = 0.63 µm) with a readout speed of 100 kHz (noise 4 e−) and medium gain. In order to obtain the normalized Stokes parameters q = Q/I and u = U/I, we took images at four independent HWP orientations (0°, 22.5°, 45.0°, and 67.5°; Schaefer et al. 2007). Different exposure times, based on the cluster brightness, were used to cover the bright and the faint stars in the field up to 17 mag. The details of the exposure time for each cluster are presented in the fifth column of Table 1. At least six frames at each position were taken in order to increase the signal-to-noise ratio. We observed an area with a radius of 6′ around each cluster, which completely covered the core regions of the cluster (core size = 2.4′, 3′, 2.4′, 2.4′, 1.8′ for Kronberger 1, Berkeley 69, Berkeley 71, Berkeley 19 and King 8 respectively; Kharchenko et al. 2013). Two to five polarized standards (see Table 2) and multiple sets of un-polarized standards (HD 14069, Table 3) were also observed on each night along with the cluster field in the same filter to calibrate the polarization angle and to correct for the instrumental polarization, respectively. The instrumental polarization was found to be low (~ 0.1%).
The observed data were reduced and analyzed using self-scripted Python routines. The basic data reduction tasks included bias subtraction, shifting, and stacking of images to increase the signal-to-noise ratio and astrometry using the astrometry.net service. The astrometric accuracy of all the images is better than 0.5″. Since the two images (e-ray and o-ray) of one source are present in the same CCD plane, it is important to separate the o-ray and e-ray images. Following the extraction of e-ray and o-ray coordinate information, aperture photometry was performed on each set of coordinates using the photutils package of (Bradley et al. 2020) of Astropy (Astropy Collaboration 2018). In crowded fields such as open clusters, there is always a finite probability of apertures of nearby stars to overlap. The crowding problem in AlMPOL images is multiplied because e-ray and o-ray images are present together (see Fig. 4 of Uppal et al. 2024a). Multiple apertures between one time of the full-width at half maxima (FWHM) to three times the FWHM were used for aperture photometry to reduce the overlapping issue. The modulation factor R(α) at each HWP orientation (α = 0º, 22.5º, 45º, and 67.5º) was calculated using the photometric flux of the e-ray and o-ray (Io and Ie) of a star at each aperture using
 (1)
(1)
where the factor F was introduced because the responses of the CCD to the two orthogonal polarization components may not be the same, and they are a function of position on its surface. The actual measured signal in the two images may differ by a factor F, given by
![Mathematical equation: $F = {\left[ {{{{I_o}\left( {{0^^\circ }} \right)} \over {{I_e}\left( {{{45}^^\circ }} \right)}} \times {{{I_o}\left( {{{45}^^\circ }} \right)} \over {{I_e}\left( {{0^^\circ }} \right)}} \times {{{I_o}\left( {{{22.5}^^\circ }} \right)} \over {{I_e}\left( {{{67.5}^^\circ }} \right)}} \times {{{I_o}\left( {{{67.5}^^\circ }} \right)} \over {{I_e}\left( {{{22.5}^^\circ }} \right)}}} \right]^{{1 \over 4}}}.$](/articles/aa/full_html/2024/10/aa49537-24/aa49537-24-eq2.png) (2)
(2)
The uncertainty in the measurement of R(α) is obtained using
 (3)
(3)
where Ib is the average background counts around the extraordinary and ordinary images.
For AIMPOL, the modulation factor measured at different HWP angles relates to the Stokes parameter of the starlight (qobs, and uobs) through
 (4)
(4)
We kept the Stokes parameters corresponding to the aperture leading to the minimum χ2 fit of Eq. (4). The obtained Stokes parameters of all the observed stars (qobs and uobs) and their uncertainties  were corrected for instrumental polarization in qu space following Eqs. (5) and (6),
 (5)
(5)
 (6)
(6)
where qins and uins are Stokes parameters corresponding to the instrumental polarization obtained from the measurement of unpolarized standard stars.  are their respective uncertainties. The degree of polarization was then determined as the quadrature sum of q and u Stokes parameters, that is,
 (7)
(7)
and the polarization angle, measured in IAU convention (north to east), that is, with zero at north and increasing toward the east, was determined as
 (8)
(8)
To define the polarization angle, we used the two-argument arctangent function to account for the inherent 180° ambiguity in polarization angle. The observed position angle of stars in each field was corrected to the reference position angle using observations of the polarized standard stars. The measured degree of polarization, polarization angle, and offset in angle for different standard stars observed on each night are listed in Table 2 in the range −90° ≤ θ < +90°.
The uncertainties in the derived degree of polarization (Eq. (7)) and polarization angle (Eq. (8)) were estimated using the error propagation of the measured q and u values and their uncertainties,
 (9)
(9)
 (10)
(10)
The determination of the degree of polarization from the quadrature sum of the q and u Stokes parameters (Eq. (7)) followed the Ricean distribution. The errors in q and u, originating from various sources, contribute positively to the overall error, leading to a systematic increase in the derived degree ofpolarization (Patat & Romaniello 2006;Sohn 2011). Consequently, this introduces a bias in the polarization measurements, particularly when the error in polarization becomes comparable to the degree of polarization. We corrected for the Ricean bias produced due to the low signal-to-noise ratio (S/N) in polarization measurements with the asymptotic estimator (Wardle & Kronberg 1974), given by
 (11)
(11)
The debiased value of the degree of polarization obtained from the above equation was used in our analysis. On the other hand, the measurements of the polarization angle follow a different probability distribution than the degree of polarization (Naghizadeh-Khouei & Clarke 1993). Given that the distributions of q and u exhibit similar statistical properties, the ratios between them do not influence the derived polarization angle (see Eq. (8)). Therefore, we anticipate that measurements of polarization angle will be considerably more accurate than those of the degree of polarization. Consequently, we did not consider any debiasing for the polarization angle.
We restricted our analysis to stars with a G-band magnitude <17 mag and thereby excluded fainter stars that typically exhibit a low S/N and may yield unreliable results. Additionally, we only considered stars with a degree of polarization exceeding the 3σp threshold. While these criteria led to the exclusion of many nearby foreground stars with low S/N in their polarization, we prioritized the selection of the most reliable measurements in our study, except in Sect. 4.2.2. After we applied these two criteria, the remaining data are comprised of 158, 151, 80, 161, and 88 stars toward Kronberger 1, Berkeley 69, Berkeley 71, King 8, and Berkeley 19, respectively.
Polarization measurements and the reference values of highly polarized standard stars.
Polarization measurements of the unpolarized standard, star HD 14069, at each epoch.
2.2 Archival data
The observed polarization data were complemented with the imaging data from the Wide-Field Infrared Survey Explorer (WISE; λ = 3.4, 4.6, 12, 22 µm; resolutions = 6″.1, 6″.4, 6″.5, 12″; Wright et al. 2010) depicting the 2D distribution of warm dust of the ISM, and from the Herschel Infrared Galactic Plane Survey (Hi-GAL; λ = 250, 350, 500 µm; resolutions = 18″, 25″, 37″; Molinari et al. 2010) for the cold dust distribution.
The polarization measurement of five additional clusters located in the same line of sight, NGC 2281 (Eswaraiah et al. 2011), NGC 1960 (Eswaraiah et al. 2011), Stock 8 (Eswaraiah et al. 2011), NGC 1931 (Pandey et al. 2013), and NGC 1893 (Eswaraiah et al. 2011; Bijas et al. 2022), were used to study the large-scale dust distribution in the direction of the anticenter. More details of these clusters are given in Table 4.
3 Results
In this section, we highlight the polarization results we obtained from the observations of five clusters in the direction of the anticenter. The polarization measurements of 159, 152, 80, 161, and 88 stars toward Kronberger 1, Berkeley 69, Berkeley 71, King 8, and Berkeley 19 are added in the electronic media as extended tables. The extended table lists the degree of polarization (pobs), the debiased polarization (P), the polarization angle (θ), and the Stokes parameters (q and u), and their errors (σp, σθ, σq, and σu) for the selected stars observed toward each individual cluster, labeled with the cluster name. The corresponding Gaia DR3 source IDs of the observed stars are also appended to the tables. A sample of the observed polarization measurements is presented in Table 5.
3.1 Polarization sky map
The sky projection of the polarization segments of all the observed stars in different cluster directions is overlaid on 25′ × 25′ Digital Sky Survey (DSS)1 R-band images (in Equatorial coordinates) and shown in Figs. 1a–1e. The red-line segments indicate the member stars with a membership probability of more than 50%, as calculated in Hunt & Reffert (2023). The length of each segment is proportional to the degree of polarization, and their orientation traces the measured optical polarization position angle (θ, Eq. (8)). A reference line segment with a degree of polarization of 5% and a polarization angle of 90° is drawn in the lower right corner of each panel. The solid gray line in the upper left corner of each figure depicts the orientation of the Galactic plane (constant latitude).
Parameters of ten Galactic clusters in the direction of the anticenter with polarization measurements from our observations and the literature.
Sample of the polarization measurements of a few stars toward the cluster Kronberger 1.
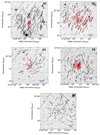 |
Fig. 1 Polarization line segments overlaid on DSS R-band 25′ × 25′ field toward Kronberger 1 in panel (a), Berkeley 69 in (b), Berkeley 71 in (c), King 8 in (d), and Berkeley 19 in panel (e). The length of the segment is proportional to the degree of polarization, and the orientation depicts the polarization angle. The red lines represent the polarization measurements of probable member stars, and the solid gray line in the upper left corner corresponds to the orientation of the Galactic plane. A reference line for the polarization of 5% and a polarization angle of 90° is also drawn in the lower right corner of each panel. |
3.2 Distribution of stars in P–θ
A detailed examination of polarization measurements toward the observed clusters is presented in Figs. 2a–2e. The member stars with a membership probability more than 50% are denoted by open red circles. The orientation of the Galactic plane in the direction of each cluster is represented by a dashed gray line. In all the panels of Fig. 2, the stars exhibiting a low degree of polarization show a high dispersion in position angle. The spread in the polarization angle reduced with increasing polarization.
In the case of Kronberger 1 (Fig. 2a), most of the member stars exhibit uniform polarization angles (~−27°) with a low dispersion of ~5°. Only one member star, with a membership probability of 90%, exhibits a larger polarization angle (= −6°) in contrast to the remaining detected member stars. The weighted average degree of polarization for the Kronberger 1 cluster is calculated to be 2.55 ± 0.57% and the polarization angle is ~−27°, with a standard deviation of 5° among the member stars. This calculation was performed using the following equations:
 (12)
(12)
and
 (13)
(13)
Here, X denotes P values for N number of stars, and we used the weighted circular mean from the circular statistics package of Astropy in the range (0, π) to calculate the mean polarization angle. To perform the analyses and present the results, we chose to use the P and θ values as they directly provide information on the amplitude of the polarization source field and on the plane-of-sky orientation of the magnetic field, which is associated with dust clouds. We verified that running our analysis in (q, u) space and converting into (P, θ) space led to the same results. In our calculation, the weights (wi) were defined from corresponding uncertainties (σ = σP or σθ) as
 (14)
(14)
Furthermore, Fig. 2a shows that the nonmember stars toward Kronberger 1 also display nearly similar polarization angles as the member stars.
In contrast, the distribution of stars toward Berkeley 69 (Fig. 2b) in the P − θ plane roughly shows three groups. The first group consists of four stars with a low degree of polarization and polarization angles around 50°. The second group exhibits a slightly higher degree of polarization (approximately 1.5%) and a polarization angle of θ ≈ −11°. The third group primarily consists of all the member stars with a higher average degree of polarization (around 3%) compared to the other groups. These stars also have a smaller polarization angle (approximately −33°) compared to the stars in the second group. The differences in polarization among these three groups suggest variations in the magnetized ISM, either along the line of sight or in the plane of the sky. The weighted average degree of polarization and weighted circular mean polarization angle with their respective weighted standard deviation for member stars were derived using Eqs. (12), (13) and (14), yielding values approximately equal to 3.23 ± 0.68% and −34º ± 8º. Similar to Berkeley 69, the stars toward the cluster King 8 (Fig. 2d) also show a distinct grouping in the P – θ plane. The weighted average degree of polarization of member stars toward King 8 is 3.13 ± 0.92, with a polarization angle of −26° ± 7°.
The stars toward Berkeley 71 (Fig. 2c) and Berkeley 19 (Fig. 2e) display a low degree of polarization and high dispersion in polarization angle. The weighted mean polarization for Berkeley 71 is 1.50 ± 0.53%, and the polarization angle is around −40° ± 16°. Similarly, the weighted mean degree of polarization for Berkeley 19 member stars is calculated to be 1.08 ± 0.27 % with a polarization angle of −62° ± 15°. In most cases, the polarization angle tracing the plane-of-sky orientation of the magnetic field is closely aligned with that of the orientation of the Galactic plane, implying the dust is relaxed in these directions, except for stars toward Berkeley 71 and Berkeley 19. The polarization angles of only a few member stars in Berkeley 71 are aligned with the Galactic plane, while most of the field stars and cluster members display a scattered orientation. This suggests that the magnetic field in this direction is inhomogeneous in small-scale regions. Furthermore, the member stars in this direction show a helical pattern in the polarization angle on the sky plane, as shown in Fig. 1c. This is likely the result of inhomogeneities in the foreground clouds, as discussed in Sects. 4.1 and 4.2, where we showed that the polarization segments are closely aligned with the morphology of the foreground cloud. Berkeley 19, on the other hand, is the most distant cluster in our observation campaign. Most of the observed stars in this direction lie in the foreground to the cluster and are less extincted by dust. Consequently, they exhibit a low degree of polarization with a large scatter in polarization angle.
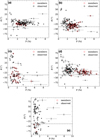 |
Fig. 2 Scatter plot of P and θ of observed stars toward Kronberger 1 (panel a), Berkeley 69 (panel b), Berkeley 71 (panel c), King 8 (panel d), and Berkeley 19 (panel e). The error bars represent the uncertainties in the polarization measurements (σP and σθ). The open red circle in all the panels corresponds to the P and θ values of probable member stars. The dashed gray line depicts the orientation of the Galactic plane in the respective cluster direction. |
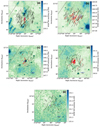 |
Fig. 3 WISE W4 map of 25′ × 25′ fields, centered on Kronberger 1 (panel a), Berkeley 69 (panel b), Berkeley 71 (panel c), King 8 (panel d), and Berkeley 19 (panel e). The polarization segments are the same as in Fig. 1 for member stars (in red), and field stars (in black) are superimposed on the respective WISE map. The color scale in the maps represents the WISE W4 intensity (in DN), and the contours correspond to its constant value. |
4 Discussions
In this section, we discuss the spatial and line-of-sight dust distribution toward individual clusters by combining the polarization measurements with the archival data, including data from WISE, Herschel, and Gaia.
4.1 Spatial dust distribution
We showed in Sect. 3.2 that stars toward Berkeley 71 and Berkeley 19 show high dispersion in polarization angle. Stars toward the other clusters either show nearly uniform polarization or some grouping in the polarization measurements. The variation in the degree of polarization and polarization angle could be linked with the spatial distribution of foreground dust clouds along with the plane-of-sky magnetic field orientation. A uniform foreground dust distribution with a uniform plane-of-sky magnetic field is expected to show low dispersion in the polarization angle. However, high dispersion in the polarization angle indicates a nonuniform dust distribution or a varying magnetic field orientation on the sky plane. In order to infer this possible scenario, we analyze 2D maps of the warm and cold dust distribution in the following subsections.
4.1.1 WISE maps
The intensity images in WISE W4 (22 µm) (NASA/IPAC Infrared Science Archive 2020) depict the line-of-sight integrated distribution of warm dust in the plane of the sky. Figures 3a–3e show the polarization measurements in the direction of each cluster, superimposed on WISE W4 maps covering a 25′ field centered on the location of the cluster. The color-coding and orientation of the polarization vectors are aligned with those in Fig. 1. The color bar on the right side of the panels of Fig. 3 corresponds to the WISE W4 intensity in digital numbers (DN), and the green contours denote constant W4 intensity contours. The color gradient in these panels suggests a patchy spatial distribution of the dust in the corresponding cluster directions. In the direction of cluster Kronberger 1, the polarization angle of most of the stars is oriented systematically away from the Galactic plane (see Figs. 2a and 3a). A closer inspection of Fig. 3a reveals that the orientation of the polarization segments of a few stars seems to follow the curvature of the filament seen in the WISE map. However, we require more polarization data of stars located at similar distances, covering a wider area beyond the whole filament, to confirm the relation of the polarization features with the large-scale filament geometry. In this direction, the polarization angle of most member stars appears to be aligned with each other, except for one outlier (shown as the purple circle in Fig. 3a), which has a polarization angle of –6°.
In the case of Berkeley 69, most of the member stars in group 3 (see Sect. 3.2 and Fig. 2b) are aligned in parallel with the Galactic plane, except for one star. This star exhibits a degree of polarization of 7.22 ± 0.69% and a polarization angle of 15° ± 3°. The considerable deviation in P and θ, or q and u values of this star from the remaining member stars raises doubts about its membership status or suggests intrinsic polarization. The sky position of this star is at the edge of the cluster, indicating possible inhomogeneous dust distribution at the outskirts of the cluster. We plot the polarization vectors on the WISE W4 image in Fig. 3b to investigate this further. The figure clearly illustrates a nonuniform distribution of dust in the sky region in the direction of the cluster. Interestingly, the central region appears to have less dust than the periphery of the cluster, as traced by WISE W4. Here, the star with the polarization value of 7.22% is denoted by a purple circle. The higher polarization could be attributed to the presence of warm dust, as suggested by the increased WISE W4 intensity at the star location in Fig. 3b. The large difference in angle might indicate that the star is intrinsically polarized. We require multi-band polarization data to confirm the possibility of intrinsic polarization. Excluding this star, the weighted average of the degree of polarization and polarization angle of the cluster is estimated to be 3.23% ± 0.68% and –33.9° ± 8.2°.
The dust traced by WISE W4 appears to be nearly uniformly distributed toward Berkeley 71 (Fig. 3c) and Berkeley 19 (Fig. 3e), as seen by WISE W4 contours. Consequently, the significant spread in the polarization angle cannot be attributed to the presence of warm dust alone. In contrast, Fig. 3d reveals that the dust traced by WISE W4 toward King 8 is less concentrated toward the center of the cluster than in the peripheral regions. As a result, the member stars located closer to the cluster center exhibit a distinct polarization behavior compared to field stars dispersed toward the edge of the cluster.
4.1.2 Herschel maps
In order to examine the distribution of cold dust and their correspondence in polarization measurements, we searched for our observed locations in Herschel high-level images (HHLI; HSA 2020) and found the data corresponding to only two cluster directions, that is, Kronberger 1, and Berkeley 71. The color gradient and the contours in Fig. 4 depict the Herschel 250 µm intensity map plotted in equatorial coordinates. Similar to the WISE W4 map (Fig. 3a), the Herschel 250 µm map toward Kronberger 1 (Fig. 4a) also exhibits a filamentary feature, where the polarization angle seems to be parallel to its longer axis. However, in the case of Berkeley 71, unlike the WISE W4 image (Fig. 3c), the Hershel 250 µm map displayed in Fig. 4b has some filamentary loop features. Notably, the polarization vectors of the member stars appear to be aligned with the 250 µm dust-loop features, particularly in the vicinity of the cluster center. This correlation between the inhomogeneous cold dust emission and the polarization explains the significant scatter observed in the polarization angles toward cluster Berkeley 71.
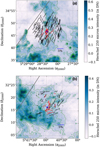 |
Fig. 4 Herschel 250 µm dust map of Kronberger 1 in panel a and Berkeley 71 in panel b. The contours correspond to the constant Herschel 250 µm intensity. The polarization measurements are overplotted on the dust map, and the color-coding and orientation are similar to Fig. 1. A 5% polarization line perpendicular to celestial north is also added in the bottom corner on the right side. |
4.2 Line-of-sight dust distribution
It is important to estimate the number of dust clouds and their distance along the line of sight to understand the 3D distribution of dust and, hence, the structure of the Galaxy. To determine the distance of foreground dust layers in the direction of each cluster, we attempted to employ kinematic distance measurements based on spectral information obtained from the HI4PI survey (HI4PI Collaboration 2016) for the diffuse neutral medium and molecular emission data from the 12CO survey by (Dame et al. 2001). However, the kinematic distances obtained for the anticenter direction using the A5 model following the method outlined by Reid et al. (2014) yielded unreliable values with large uncertainties. This discrepancy is attributed to the fact that in the anticenter direction, the main velocity component of the dust cloud is oriented along the plane of the sky rather than in the line of sight, following a circular rotation model. Consequently, the small radial velocity component and associated uncertainties contribute to significant uncertainties in the derived kinematic distances.
Nevertheless, as discussed in Sect. 1, the polarization of background starlight and extinction combined with distance information provides an alternative approach to inferring the dust distribution along the line of sight. The degree of polarization and extinction is expected to jump when starlight encounters a dust layer. The polarization jump is also accompanied by a change in the polarization angle when the dust clouds along the line of sight are permeated by magnetic field lines with different orientations. Consequently, the variation in polarization and extinction as a function of distance serves as a proxy for the dust distribution along the line of sight. This section provides detailed analyses for determining the number of dust layers along the line of sight in the direction of each cluster. It uses polarization information with distance through qualitative and quantitative methods and critically examines the constraints inherent in the applied methods.
4.2.1 Visual inspection
To determine the dust distribution toward each cluster, we cross-matched the observed stars with the Gaia EDR3 (Gaia Collaboration 2021b) distance catalog (Bailer-Jones et al. 2021) and used rpgeo as the distance estimator of cross-matched sources. The extinction or reddening E(B – V) information toward each star was extracted from Green’s Bayestar 3D extinction map (Green et al. 2019). In Fig. 5, we show the variation in the degree of polarization (top), the polarization angle (middle), and the reddenning E(B – V) (bottom) as a function of the rpgeo distance toward clusters Kronberger 1, Berkeley 69, Berkeley 71, King 8, and Berkeley 19 in panel 5a–5e, respectively. Stars with a membership probability greater than 50% are shown with open red circles. We binned the data along the line of sight for each cluster direction in the distance axis to reveal the smooth variation in polarization and extinction with distance. The weighted average degree of polarization, circular weighted average polarization angle, and average extinction within 500 pc distance (rpgeo) bins are depicted as green square points with error bars representing the weighted dispersion in the horizontal and vertical axes within the corresponding bin. The individual point-wise error bars are omitted in the figures for clarity. We refer to Figs. A.1–A.5 for the depiction of the degree of polarization and polarization angle for each cluster, along with their associated uncertainties in polarization measurements and estimated distances.
The middle panel of Fig. 5a shows that the foreground stars in the direction of Kronberger 1 exhibit a low degree of polarization with a polarization angle that largely deviates from the Galactic plane. The polarization angle becomes almost constant beyond ≈500 pc. Despite the limited number of stars in this region, the abrupt change in the polarization angle implies the likely existence of a cloud layer around 500 pc (marked by a dotted vertical line in Fig. 5a). This transition is aligned with observed jumps in extinction values, as evident in the bottom panel of Fig. 5a. Subsequently, polarization uniformly increases with distance until around 1600 pc (also marked by a vertical dotted line), where starlight undergoes a systematic depolarization, leading to a reduction in the degree of polarization. This region coincides with the cluster position, as denoted by the location of members in the figure. The cluster is situated in close proximity to the star-forming region S234 (Dewangan et al. 2018). The decrease in the degree of polarization could be attributed to the cumulative effect of dust in the ISM and dust in the star-forming region. However, the polarization angles remain relatively unchanged. They may be influenced by the dominant foreground dust layer at around 500 pc. An increase in the degree of polarization is observed beyond 3000 pc, which could indicate another dust layer at this distance. Similarly, multiple jumps in the degree of polarization, polarization angle, and extinction are evident in the direction of each cluster (marked by dashed lines in Figs. 5b–5e), implying multiple dust layers along each line of sight. The second column of Table 6 lists the approximate distance to the dust layers visually determined toward each cluster. The analysis reveals at least two dust layers in the direction of each cluster. While more than two dust layers may exist, we focus on layers showing a clear change in the degree of polarization and extinction.
4.2.2 BISP-1 method
The visual examination of change in polarization and extinction of stars as a function of distance provides qualitative analyses that offer indications of the number of dust layers along a specific line of sight. However, it remains challenging to accurately determine the distance to the dust layers and their associated uncertainties. Recently, Pelgrims et al. (2023) introduced a Bayesian method for decomposing the starlight polarization along the distance. Their method, called BISP-1 for Bayesian inference of starlight polarization in 1D, is specifically designed to quantify the number of dust layers, their distance, and their polarization properties based on the linear polarization measurements of stars along with their distance data. Unlike visual analyses, BISP-1 accounts for statistical uncertainties associated with the estimated parameters derived from the posterior distribution of the dust layers. This method was designed to work at high Galactic latitudes toward the diffuse ISM in the framework of the upcoming PASIPHAE polarization survey (Tassis et al. 2018). BISP-1 is the first Bayesian inference method developed for the tomographic decomposition of the plane-of-sky magnetic field component. The algorithm incorporates the polarization signal from the magnetized and dusty ISM, which is modeled by thin layers at different distances. It uses directly observed quantities such as the Stokes q and u parameters, the parallax, and their associated uncertainties as input data rather than relying on derived polarization and distance information.
We employed the BISP-1 algorithm on our polarization results to confirm and quantify the distance of the dust layers along the line of sight. We used the measured Stokes parameters (q, u) of all the stars along with their parallax values from Gaia DR3 (Gaia Collaboration 2023) without any constraints on the polarization S/N. However, we applied some quality criteria: We considered stars with positive parallax values and a renormalized unit weight error (RUWE) smaller than 1.4. A RUWE value above 1.4 indicates blended sources that may lead to unreliable parallax measurements. BISP-1 assumes all data points to be associated with the dusty magnetized ISM, and therefore, we opted to eliminate outliers from the polarization measurements that might be linked to intrinsic polarization. This was accomplished through a recursive σ-clipping on the distribution of the Stokes parameters within groups of five neighbors defined in the physical 3D position space. Outliers were identified as stars for which the probability of their Stokes parameters originating from the same parent distribution as their neighbors fell below 1%, accounting for distribution scatter and observation uncertainties. Upon inspecting the resulting selection for all line-of-sight samples, we observed that in the sample toward Kronberger 1, the star closest to the Sun, whose polarization was compatible with zero and which is isolated in distance space, was likely not an outlier. Hence, we did not consider this star as an outlier. We discarded the remaining outliers from the subsequent analyses.
We used BISP-1 to test various models involving different numbers of clouds along the sightlines, and we therefore first needed to define our priors. To do this, we visualized the data in the (q, u)-µ space, where µ is the distance modulus defined as µ = 5 log10(d) – 5, and d denotes the stellar distance in pc. We noted that for every sample except for Kronberger 1, the Stokes parameters of the nearest stars (first star according to distance) do not coincide with (q, u) = (0, 0), even when the uncertainties were considered. This indicates a dust layer in the foreground of our samples (discussed below). In addition to this, we observed evidence for a change in the polarization properties and extinction at a distance of 500–1000 pc (corresponding distance modulus µ ∈ [8,10]) in all the cluster directions (see Fig. 5). Therefore, it became evident that each sightline intersected at least two dust clouds. Based on these observations, we defined our priors for the cloud parallaxes as follows: a flat prior for the parallax of a nearby layer with a minimum distance set to 50 pc and a Gaussian prior for the parallax of the second layer with a mean of 1.58 mas, corresponding to a distance modulus of µ = 9, and a standard deviation of 0.5 mas. In addition, we used flat priors with the default setting in BISP-1 for the subsequent distant layers.
After defining the priors, we applied BISP-1 to model the data using models from two to five dust layers. In each case, we ran a maximum of 40000 iterations with a required log-evidence precision of 0.01. The Akaike information criterion (AIC) was employed to assess the performance of the various models and to identify the best-fit model (see Pelgrims et al. 2023, 2024 for details).
The results obtained from the BISP-1 method for each cluster direction are presented in Fig. 6. The figure illustrates the variation of q (in green) and u (in blue) as a function of distance modulus (µ) or distance estimated from the inverse of parallax. The solid vertical lines in the figure denote the distance moduli corresponding to the median of the posterior distributions on dust-layer parallaxes. The 16th and 84th percentiles of the same distribution are marked by the dark shaded region, while the 2.5 and 97.5 percentiles are denoted by the lightly shaded area.
The horizontal shaded areas show the (cumulative) posterior distributions of the mean Stokes parameters from the dust layers. The figure clearly shows multiple dust layers in each cluster direction. The estimated distances to the line-of-sight dust clouds are listed in the third column of Table 6 for comparison with the visual inspection. The degree of polarization and polarization angle derived from the resulting average q and u parameters, along with the predicted distance of each dust layer, are tabulated in Table 7.
Fig. 6 shows that a dust layer, including nonzero polarization to background stars, exists toward each cluster at a distance of µ ≲ 6.5 (d ≲ 200 pc). This layer is not expected from the visual inspection (Sect. 4.2.1) because only very few stars lie at distances smaller than 400 pc in our samples. However, the posterior distribution of the parallax of the nearby cloud as estimated by BISP-1 is not solely determined by the data at high parallax values (at small distances), but rather by a combination of the assumed prior and the nearest data points. These data points play a crucial role in determining the upper limit on the distance of the nearest clouds. Hence, for the nearest cloud layer, the upper limit on the distance estimate is considered and listed in Table 6. However, the lower limits strongly depend on the choice of the upper limit of the parallax of this nearby cloud.
Moreover, the indication of nearby dust components toward each cluster is also compatible with the existence of the Local Bubble, the most prominent structure of the local ISM in which the Sun is embedded. The distance from the Sun to the inner shell of the dusty wall surrounding the cavity was estimated by Pelgrims et al. (2020) from the 3D dust density map of Lallement et al. (2019). Toward our sightlines, the dusty wall of the Local Bubble is estimated2 to be in the range of ~180 pc to 220 pc. The upper limits to the first cloud listed in column 3 of Table 6 are consistent with this picture.
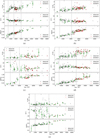 |
Fig. 5 Variation in the degree of polarization (P), polarization angle (θ), and reddening E(B–V) as a function of distance rpgeo for the clusters. Panel a shows Kronberger 1, panel b Berkeley 69, panel c Berkeley 71, panel d King 8, and panel e Berkeley 19. The vertical dashed lines in each panel denote the location of the foreground dust layers derived from visual inspection. |
Distances of detected foreground dust clouds from visual inspection and BISP-1.
4.3 Signature of spiral arms
The analyses presented in Sect. 4.2 reveal multiple dust layers in the direction of each cluster, regardless of the method employed. The distance of the predicted dust layers from different methods is cataloged in Table 6. The results are also shown in Fig. 7, where we plot the estimated distance of all dust layers resulting from visual inspection (light red squares) and BISP-1 algorithm (black points). The error bar around the BISP-1 inferred distance represents the 2.5 and 97.5 percentile (thin black line) and 16 and 84 percentile values (thick black lines). The solid vertical lines represent the approximate distance of the spiral arms in the direction of the anticenter (Local arm: cyan, Perseus arm: yellow, and Outer arm: red) determined from Reid et al. (2019) and Castro-Ginard et al. (2021). The cluster names are placed based on their relative Galactic latitudes, ranging from –3°.6 to 3°.1, and their distances are marked in the figure using different colored symbols. It is worth noting that BISP-1 estimates the parallax and normalized Stokes parameters of dust layers along the line of sight. Consequently, the inverse of the parallax was used to estimate the distance of these clouds. However, we used rpgeo as the distance estimator in the visual inspection. For the distant stars (e.g., stars toward clusters King 8 and Berkeley 19), the uncertainty in the parallax measurement can increase, and the rpgeo distance will largely depend on the prior assumptions (Bailer-Jones 2015; Bailer-Jones et al. 2021). Hence, the distant clouds may show large deviations in their distance estimates from visual inspection and BISP-1 merely due to the use of rpgeo in one case and the inverse of parallax in the other case. A careful inspection of Fig. 7 reveals that Berkeley 69 and Berkeley 71, which are located between the Perseus arm and the Outer arm, show a dust cloud at ≈ 2 kpc. Interestingly, this location is aligned with the anticipated position of the Perseus arm (depicted by the yellow line) in the anticenter direction. Additionally, NGC 1893 (I = 173°.582, b = –1°.659, and r = 2.8 kpc), another cluster in a similar direction, has been reported to have a dust cloud at a distance of ≈ 2 kpc (Bijas et al. 2022). This implies that the dust in the Perseus arm causes the polarization of background stars in this direction. Cluster Kronberger 1 itself resides in the dusty environment of this arm, and the signature of the arm toward this cluster is therefore challenging to predict.
Furthermore, the distant clusters King 8 and Berkeley 19, located beyond the Outer arm show a dust layer at approximately 3500–4500 pc although they lie at opposite latitudes (–3.6° and 3.1°, respectively). The Outer arm of the Galaxy may also be located at ≈ 4000 pc (solid red line, as predicted from the Reid et al. 2019 model of high-mass star-forming region, HMSFR, data). This suggests that the main changes in polarization occur near the spiral arms of the Galaxy, which highlights that polarization is an effective tool for understanding the large-scale dust distribution and mapping the underlying structure of the Galaxy.
In addition, to our surprise, we noted that the polarization measurements and extinction values of stars toward Berkeley 19 and King 8 do not exhibit strong signatures of the Perseus arm, in contrast to our initial expectations. The absence of a prominent dust layer around the Perseus arm for these higher-latitude clusters suggests potential variations in the thickness of the spiral arms. The vertical thickness of the Perseus arm might be smaller than that of the Outer arm, leading to less pronounced effects at higher latitudes.
This speculation is further supported by the fact that the Galactic disk exhibits a flare, that is, the scale height of the Galactic disk increases with the Galactocentric distance (e.g., Drimmel & Spergel 2001; Uppal et al. 2024b). Therefore, the Outer arm is expected to have a greater thickness than the Perseus arm. According to the linear model derived from the flare observed in Cosmic Background Explorer (COBE) – Diffuse Infrared Background Experiment (DIRBE) dust maps by Drimmel & Spergel (2001), the scale height of the Galactic disk is estimated to be ≈ 220 pc at the location of the Perseus arm and ≈ 260 pc at the Outer arm. However, the height of the disk (Z = d sin b; where d is the distance from the Sun and b is the Galactic latitude) in the line of sight of King 8 (b = 3.104°) and Berkeley 19 (b = –3.612°) within the Perseus arm is calculated to be approximately 110–125 pc and that of the Outer arm is around 220–250 pc. These values of the disk height are notably lower than the computed scale height of the disk in the corresponding arms. This implies that the absence of polarization features around the Perseus arm at higher-latitude sightlines may not be directly related to the global features, such as the flaring of the disk. Alternatively, it might indicate that the flared geometry of the disk as traced by dust differs from the linear predictions made by Drimmel & Spergel (2001).
Another plausible explanation could be the existence of a low extinction window within the Perseus arm, specifically, toward King 8 and Berkeley 19. The mid-IR images obtained from the James Webb Space Telescope provide evidence of variations in the dust distribution within the spiral arms for external galaxies (e.g., Meidt et al. 2023). It is possible that the sightlines toward our higher-latitude clusters may have less dust in the Perseus arm to polarize the background stars. To investigate this possibility further, we require polarization observations of distant clusters beyond the Outer arm with large spatial coverage. In any case, our polarization results provide insight into the signature of the large- and small-scale structures of the Galactic disk.
In addition, all the polarization data observed in the direction of the anticenter in this study are plotted in Fig. 8, which displays the variation of the degree of polarization (in the upper panel) and polarization angle (in the lower panel) with distance (rp𝑔eo). The figure encompasses the data from a broad sky area (~7° diameter) and shows a large scatter (−90° to + 90°) in the polarization angle. To show the variation of polarization with distance, we calculated the circular weighted average polarization angle and weighted mean degree of polarization in 500 pc bins of distance, rp𝑔eo. The weighted means are represented by the black squares, and the error bars depicting the standard deviation of polarization values in each bin. The mean polarization (P and θ) values slightly change in proximity to the spiral arms (vertical lines with color-coding consistent with Fig. 7), thus highlighting the presence of spiral arms in the polarization data.
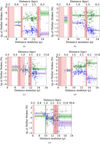 |
Fig. 6 Distribution of q (in green) and u (in blue) parameter of the stars as a function of their distance modulus (µ) or distance toward Kronberger 1 in (a), Berkeley 69 in (b), Berkeley 71 in (c), King 8 in (d), and Berkeley 19 in panel (e). The solid vertical red line indicates the median of the posterior distribution on the cloud distance, and the light and dark shaded area denotes the range of 2.5 to 97.5 percentiles and 16 to 84 percentiles of the distribution. The green and purple horizontal lines indicate the median value of q and u from the posterior distribution of the mean Stokes parameters of the foreground dust clouds. The shaded areas represent the 2.5 to 97.5 and 16 to 84 percentiles of the distributions. |
Results of the BISP-1 characterization of the degree of polarization, polarization angle, and distance of the dust clouds along the line of sight of each cluster.
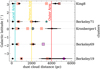 |
Fig. 7 Distance of the dust layers along the line of sight of observed cluster directions inferred from visual inspection (light red squares) and BISP-1 algorithm (black points). The thick black line around the black point corresponds to the 16th and 84th percentiles of the cloud distance, and the thin line represents the 2.5 and 97.5 percentile ranges. The cluster distances are marked by different colored symbols at their respective Galactic latitude positions. The vertical lines represent the location of the Spiral arms: the Local arm (cyan), the Perseus arm (yellow), and the Outer arm (red). |
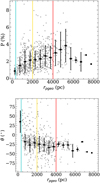 |
Fig. 8 Variation in the degree of polarization (top panel) and polarization angle (bottom panel) with rp𝑔eo for all the stars (members and nonmembers) observed in the direction of the anticenter. The black points with error bars represent the average P and θ values in rp𝑔eo distance bins of 500 pc width. The error bars correspond to the standard deviation in the P and θ values in each distance bin. The distance to the spiral arms is marked by vertical lines using the same colors as in Fig. 7. |
4.4 General trend of the dust distribution
In this section, we examine the large-scale dust distribution by combining our observed cluster data with the polarization data from other clusters located on a similar line of sight available in the literature. We include the data of five clusters: NGC 2281, Stock 8, NGC 1960, NGC 1931, and NGC 1893 (from Eswaraiah et al. 2011; Pandey et al. 2013; and Bijas et al. 2022). NGC 1931 and Stock 8 are located in close proximity to the star-forming region in the Perseus arm. NGC 2281 is a foreground cluster situated at a high latitude (b = 16°.9) and a distance of approximately 500 pc. NGC 1960 is also a foreground cluster with a distance of 1.12 kpc. Only one cluster, NGC 1893, is situated between the Perseus and Outer arms. We cross-matched these clusters with the Hunt & Reffert (2023) catalog to find the member stars with a membership probability of more than 50%. The Galactic position of the clusters (ℓ, b) and their distance (dis) values obtained from Hunt & Reffert (2023) are tabulated in Cols. 2–4 of Table 4. The number of member stars detected (col: members) after cross-matching, their weighted average degree of polarization (Paυ), and circular weighted mean polarization angle (θaυ) in equatorial coordinates are also listed in the table, along with their weighted standard deviation ( and
and  ). Thus, we obtained the polarization information of a total of ten Galactic open clusters (five from the literature and five from our observation) in the direction of the anticenter, distributed over a large distance range. To investigate the variation of polarization of clusters with the distance, we plot the weighted mean of the degree of polarization (Paυ) and weighted circular mean of polarization angle (θaυ) of cluster members with the average distance (dis) in the upper and lower panels of Fig. 9. The different colored symbols correspond to the different clusters. In these figures, the ellipse surrounding the central symbol represents the weighted standard deviation in polarization (
 and
and  , along the y-axis) of the member stars and the distance to the cluster (determined from the upper bound given in Hunt & Reffert 2023). Figure 9 shows that the degree of polarization increases with distance, but the polarization angle remains relatively constant except for NGC 2281, which is a high-latitude cluster (b = 16.887°), and Berkeley 19, where the average values are obtained based only on the four probable member stars. The uniform alignment of the polarization angle suggests that the plane-of-sky orientation of the magnetic field in the ISM in this direction remains relatively constant while more dust column is traversed. In this analysis, Berkeley 71 stands out as a special case with a localized variation in dust distribution in front of the cluster (as discussed in Sect. 4.1), resulting in a lower degree of polarization and a wider spread in the polarization distribution, which might be due to depolarization and small-scale spatial variations in a foreground cloud (as shown in Fig. 4b). Overall, the anticenter direction represents a low extinction with a relatively uniform magnetic field orientation parallel to the Galactic plane.
5 Summary and conclusions
We conducted R-band polarization observations toward five clusters, Kronberger 1, Berkeley 69, Berkeley 71, Berkeley 19, and King 8, that are located in the direction of the anticenter (ℓ ≈ 180°) covering a distance range of 2–6 kpc. These clusters were strategically chosen to infer the presence of dust layers in the direction of the anticenter. Deciphering the distance of these layers along the line of sight becomes challenging when relying solely on radial velocity information derived from dust clouds. Additionally, the polarization measurements of the selected clusters contribute to our understanding of both the small- and large-scale dust distribution along the line of sight and in the plane of the sky.
The polarization observations were carried out in the dark nights of October 2022 with the AIMPOL instrument mounted on the 1.04 m Sampurnanand telescope of ARIES, Nainital.
We obtained R-band polarization measurements of 159, 152, 80, 161, and 88 stars toward Kronberger 1, Berkeley 69, Berkeley 71, King 8, and Berkeley 19, respectively. Our analysis of the spatial dust distribution revealed a patchy distribution of warm dust in the sky region toward most of the clusters, as traced by the WISE W4 band. The deviation of polarization values of some of the member stars can be attributed to the presence of warm dust. Polarization measurements, together with the Herschel 250 µm wavelength intensity, trace the cold dust distribution toward Kronberger 1 and Berkeley 71. The magnetic field orientation of cluster Berkeley 71 helps to trace the morphology of the foreground dust cloud observed at Herschel 250 µm wavelength.
Furthermore, we analyzed the polarization measurements together with information on the distance to the observed stars using both qualitative and quantitative methods to disentangle the number of dust clouds along the line of sight. Our analysis revealed multiple (two or more) foreground dust layers in all observed cluster directions. The distances of these layers were approximated from the jump in the degree of polarization, polarization angle, and extinction as a function of distance to the individual stars toward the corresponding clusters. Berkeley 69 and Berkeley 71 reveal a dust layer at approximately 2 kpc, coinciding in distance with the Perseus arm. On the other hand, Berkeley 19 and King 8 have distant dust layers that are likely associated with the Outer arm in the direction of the anticenter. The absence of a discernible Perseus arm signature in the higher-latitude regions (|b| > 3°)) suggests that the Perseus arm could be thinner than the Outer arm of our Galaxy. However, it could also be related to local structures within the Perseus arm. These results highlight the dust distribution over small- and large-scale structures of the Galaxy.
The compilation of the polarization measurements in the direction of the anticenter from this study and the literature revealed a consistent rise in the degree of polarization and a gradual stabilization of the polarization angle with increasing distance, spanning approximately a radius of 4°. This uniform trend suggests a homogeneous dust distribution along this line of sight that is characterized by a consistent alignment of the dust grains and the plane-of-sky component of the magnetic field. Our findings indicate that the anticenter direction is a region with low extinction, with little dust and very little local variation. The observed changes in polarization and extinction are primarily caused by global features such as the Galactic spiral arms. Our results strongly justify the need for a large-scale polarization survey to be carried out to trace the structure in the entire Galactic plane.
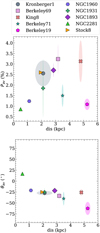 |
Fig. 9 Weighted average degree of polarization (top panel) and polarization angle (bottom panel) vs. the distance of each cluster in different colored symbols. The shaded ellipse corresponds to the weighted standard deviation in the corresponding axes. |
Data availability
Full Table 5, and the tables containing the polarization measurements of the remaining four clusters are available at the CDS via anonymous ftp to cdsarc.cds.unistra.fr (130.79.128.5) or via https://cdsarc.cds.unistra.fr/viz-bin/cat/J/A+A/690/A49
Acknowledgements
We thank the anonymous referee for their valuable and detailed reports that have significantly improved the quality of the manuscript. We thank Prof. Tassis, Department of Physics, University of Crete, for the helpful discussions. We acknowledge the Telescope Time Allocation Committee of Sampurnanand Telescope (ARIES) for approving and allocating time for our proposal. We also thank the local staff and colleagues at the Sampurnanand telescope, ARIES, for their help during observations. Work at the Physical Research Laboratory is supported by the Department of Space, Govt. of India. We acknowledge useful discussions made possible by the Belgo-Indian Network for Astronomy (BINA) supported by the International Division, Department of Science and Technology (DST, Govt. of India; DST/INT/BELG/P-09/2017) and the Belgian Federal Science Policy Office (BELSPO, Govt. of Belgium; BL/33/IN12). A part of this work has made use of data from the European Space Agency (ESA) mission Gaia3, processed by the Gaia Data Processing and Analysis Consortium (DPAC4). Funding for the DPAC is provided by national institutions, in particular, the institutions participating in the Gaia Multilateral Agreement. VP acknowledges funding from a Marie Curie Action of the European Union (grant agreement No. 101107047). This research has also made use of the NASA/IPAC Infrared Science Archive, which is funded by the National Aeronautics and Space Administration and operated by the California Institute of Technology. Astropy,5 a community-developed core Python package for Astronomy (Astгopy Collaboration 2013, 2018) was employed in the research. We have also used the VizieR catalog access tool, CDS, Strasbourg, France.
Appendix A Variation of degree of polarization and polarization angle with distance
The figures presented herein illustrate the variation of the degree of polarization and polarization angle with distance of stars (rp𝑔eo) towards Kronberger 1 (Fig. A.1), Berkeley 69 (Fig. A.2), Berkeley 71 (Fig. A.3), King 8 (Fig. A.4), and Berkeley 19 (Fig. A.5). These figures are similar to the top and middle panels of Fig. 5a to Fig. 5e, respectively, with the distinction that these incorporate uncertainties in the measured polarization and distance of the stars. The blue solid line in the θ plot represents the orientation of the Galactic plane towards the corresponding directions. The vertical gray dashed lines in each panel denote the location of the foreground dust layers expected from visual inspection.
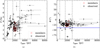 |
Fig. A.1 Variation of the degree of polarization (P, a), and polarization angle (θ, b) as a function of distance, rp𝑔eo for Kronberger 1 cluster direction. The probable cluster member stars are marked by the red open circles. The solid blue line in panel (b) represents the orientation of the Galactic plane in this direction, and the vertical gray lines in both panels correspond to the expected distance to the foreground clouds. |
References
- Astropy Collaboration (Robitaille, T. P., et al.) 2013, A&A, 558, A33 [NASA ADS] [CrossRef] [EDP Sciences] [Google Scholar]
- Astropy Collaboration (Price-Whelan, A. M., et al.) 2018, AJ, 156, 123 [Google Scholar]
- Bailer-Jones, C. A. 2015, PASP, 127, 994 [NASA ADS] [CrossRef] [Google Scholar]
- Bailer-Jones, C. A. L., Rybizki, J., Fouesneau, M., Demleitner, M., & Andrae, R. 2021, AJ, 161, 147 [Google Scholar]
- Bijas, N., Eswaraiah, C., Wang, J.-W., et al. 2022, MNRAS, 515, 3352 [NASA ADS] [CrossRef] [Google Scholar]
- Bijas, N., Eswaraiah, C., Sandhyarani, P., Jose, J., & Gopinathan, M. 2024, MNRAS, 529, 4234 [CrossRef] [Google Scholar]
- Bradley, L., Sipocz, B., Robitaille, T., et al. 2020, https://doi.org/10.5281/zenodo.4044744 [Google Scholar]
- Castro-Ginard, A., McMillan, P. J., Luri, X., et al. 2021, A&A, 652, A162 [NASA ADS] [CrossRef] [EDP Sciences] [Google Scholar]
- Clemens, D. P., Cashman, L. R., Cerny, C., et al. 2020, ApJS, 249, 23 [NASA ADS] [CrossRef] [Google Scholar]
- Dame, T. M., Hartmann, D., & Thaddeus, P. 2001, ApJ, 547, 792 [Google Scholar]
- Davis, L., & Greenstein, J. L. 1949, Phys. Rev., 75, 1605 [NASA ADS] [CrossRef] [Google Scholar]
- Dewangan, L. K., Baug, T., Ojha, D. K., Zinchenko, I., & Luna, A. 2018, ApJ, 864, 54 [NASA ADS] [CrossRef] [Google Scholar]
- Doi, Y., Hasegawa, T., Bastien, P., et al. 2021, ApJ, 914, 122 [NASA ADS] [CrossRef] [Google Scholar]
- Doi, Y., Nakamura, K., Kawabata, K. S., et al. 2024, ApJ, 961, 13 [NASA ADS] [CrossRef] [Google Scholar]
- Drimmel, R., & Spergel, D. N. 2001, ApJ, 556, 181 [Google Scholar]
- Edenhofer, G., Zucker, C., Frank, P., et al. 2024, A&A, 685, A82 [NASA ADS] [CrossRef] [EDP Sciences] [Google Scholar]
- Eswaraiah, C., Pandey, A. K., Maheswar, G., et al. 2011, MNRAS, 411, 1418 [NASA ADS] [CrossRef] [Google Scholar]
- Eswaraiah, C., Pandey, A. K., Maheswar, G., et al. 2012, MNRAS, 419, 2587 [NASA ADS] [CrossRef] [Google Scholar]
- Gaia Collaboration (Antoja, T., et al.) 2021a, A&A, 649, A8 [EDP Sciences] [Google Scholar]
- Gaia Collaboration (Brown, A. G. A., et al.) 2021b, A&A, 649, A1 [NASA ADS] [CrossRef] [EDP Sciences] [Google Scholar]
- Gaia Collaboration (Vallenari, A., et al.) 2023, A&A, 674, A1 [NASA ADS] [CrossRef] [EDP Sciences] [Google Scholar]
- Goodman, A. A., Bastien, P., Myers, P. C., & Menard, F. 1990, ApJ, 359, 363 [NASA ADS] [CrossRef] [Google Scholar]
- Green, G. M., Schlafly, E., Zucker, C., Speagle, J. S., & Finkbeiner, D. 2019, ApJ, 887, 93 [NASA ADS] [CrossRef] [Google Scholar]
- Hall, J. S. 1949, Science, 109, 166 [NASA ADS] [CrossRef] [Google Scholar]
- Hao, C. J., Xu, Y., Hou, L. G., et al. 2021, A&A, 652, A102 [NASA ADS] [CrossRef] [EDP Sciences] [Google Scholar]
- HI4PI Collaboration (Ben Bekhti, N., et al.) 2016, A&A, 594, A116 [NASA ADS] [CrossRef] [EDP Sciences] [Google Scholar]
- Hiltner, W. A. 1949, Science, 109, 165 [NASA ADS] [CrossRef] [Google Scholar]
- HSA. 2020, Herschel High Level Images (IPAC) [Google Scholar]
- Hunt, E. L., & Reffert, S. 2023, A&A, 673, A114 [NASA ADS] [CrossRef] [EDP Sciences] [Google Scholar]
- Hunter, G. H., Sormani, M. C., Beckmann, J. P., et al. 2024, A&A submitted [arXiv:2403.18000] [Google Scholar]
- Kharchenko, N. V., Piskunov, A. E., Schilbach, E., Röser, S., & Scholz, R. D. 2013, A&A, 558, A53 [NASA ADS] [CrossRef] [EDP Sciences] [Google Scholar]
- Kim, S.-H., & Martin, P. G. 1994, ApJ, 431, 783 [NASA ADS] [CrossRef] [Google Scholar]
- Lallement, R., Babusiaux, C., Vergely, J. L., et al. 2019, A&A, 625, A135 [NASA ADS] [CrossRef] [EDP Sciences] [Google Scholar]
- Lallement, R., Vergely, J. L., Babusiaux, C., & Cox, N. L. J. 2022, A&A, 661, A147 [NASA ADS] [CrossRef] [EDP Sciences] [Google Scholar]
- Mathewson, D. S., & Ford, V. L. 1971, MNRAS, 153, 525 [CrossRef] [Google Scholar]
- Medhi, B. J., & Tamura, M. 2013, MNRAS, 430, 1334 [CrossRef] [Google Scholar]
- Medhi, B. J., Maheswar, G., Pandey, J. C., Kumar, T. S., & Sagar, R. 2008, MNRAS, 388, 105 [NASA ADS] [CrossRef] [Google Scholar]
- Meidt, S. E., Rosolowsky, E., Sun, J., et al. 2023, ApJ, 944, L18 [CrossRef] [Google Scholar]
- Molinari, S., Swinyard, B., Bally, J., et al. 2010, PASP, 122, 314 [Google Scholar]
- Naghizadeh-Khouei, J., & Clarke, D. 1993, A&A, 274, 968 [NASA ADS] [Google Scholar]
- NASA/IPAC Infrared Science Archive. 2020, WISE All-Sky 4-band Atlas Coadded Images [Google Scholar]
- Pandey, A. K., Eswaraiah, C., Sharma, S., et al. 2013, ApJ, 764, 172 [NASA ADS] [CrossRef] [Google Scholar]
- Pandey, J. C., Singh, S., Yadav, R. K. S., et al. 2023, J. Astron. Instrum., 12, 2240008 [NASA ADS] [CrossRef] [Google Scholar]
- Panopoulou, G. V., Tassis, K., Skalidis, R., et al. 2019, ApJ, 872, 56 [NASA ADS] [CrossRef] [Google Scholar]
- Papoular, R. 2018, MNRAS, 479, 1685 [NASA ADS] [CrossRef] [Google Scholar]
- Patat, F., & Romaniello, M. 2006, PASP, 118, 146 [Google Scholar]
- Pelgrims, V. 2022, The shape of the shell of the Local Bubble (Harvard Dataverse) [Google Scholar]
- Pelgrims, V., Ferrière, K., Boulanger, F., Lallement, R., & Montier, L. 2020, A&A, 636, A17 [EDP Sciences] [Google Scholar]
- Pelgrims, V., Panopoulou, G. V., Tassis, K., et al. 2023, A&A, 670, A164 [NASA ADS] [CrossRef] [EDP Sciences] [Google Scholar]
- Pelgrims, V., Mandarakas, N., Skalidis, R., et al. 2024, A&A, 684, A162 [NASA ADS] [CrossRef] [EDP Sciences] [Google Scholar]
- Rautela, B. S., Joshi, G. C., & Pandey, J. C. 2004, Bull. Astron. Soc. India, 32, 159 [NASA ADS] [Google Scholar]
- Reid, M. J., Menten, K. M., Brunthaler, A., et al. 2014, ApJ, 783, 130 [Google Scholar]
- Reid, M. J., Menten, K. M., Brunthaler, A., et al. 2019, ApJ, 885, 131 [Google Scholar]
- Schaefer, B., Collett, E., Smyth, R., Barrett, D., & Fraher, B. 2007, Am. J. Phys., 75, 163 [CrossRef] [Google Scholar]
- Schmidt, G. D., Elston, R., & Lupie, O. L. 1992, AJ, 104, 1563 [Google Scholar]
- Singh, S., & Pandey, J. C. 2020, AJ, 160, 256 [NASA ADS] [CrossRef] [Google Scholar]
- Singh, S., Pandey, J. C., Yadav, R. K. S., & Medhi, B. J. 2020, AJ, 159, 99 [NASA ADS] [CrossRef] [Google Scholar]
- Singh, S., Pandey, J. C., & Hoang, T. 2022, MNRAS, 513, 4899 [NASA ADS] [CrossRef] [Google Scholar]
- Sohn, B. W. 2011, J. Astron. Space Sci., 28, 267 [NASA ADS] [CrossRef] [Google Scholar]
- Tassis, K., Ramaprakash, A. N., Readhead, A. C. S., et al. 2018, arXiv e-prints [arXiv:1810.05652] [Google Scholar]
- Topasna, G. A., Kaltcheva, N. T., & Paunzen, E. 2018, A&A, 615, A166 [NASA ADS] [CrossRef] [EDP Sciences] [Google Scholar]
- Uppal, N., Ganesh, S., & Bisht, D. 2022, AJ, 164, 31 [NASA ADS] [CrossRef] [Google Scholar]
- Uppal, N., Ganesh, S., Joshi, S., et al. 2024a, Bull. Soc. Roy. Sci. Liege, 93, 155 [NASA ADS] [Google Scholar]
- Uppal, N., Ganesh, S., & Schultheis, M. 2024b, MNRAS, 527, 4863 [Google Scholar]
- Vergely, J. L., Lallement, R., & Cox, N. L. J. 2022, A&A, 664, A174 [NASA ADS] [CrossRef] [EDP Sciences] [Google Scholar]
- Voshchinnikov, N. V., & Das, H. K. 2008, J. Quant. Spec. Radiat. Transf., 109, 1527 [NASA ADS] [CrossRef] [Google Scholar]
- Wardle, J. F. C., & Kronberg, P. P. 1974, ApJ, 194, 249 [Google Scholar]
- Wenger, T. V., Balser, D. S., Anderson, L. D., & Bania, T. M. 2018, ApJ, 856, 52 [Google Scholar]
- Wright, E. L., Eisenhardt, P. R. M., Mainzer, A. K., et al. 2010, AJ, 140, 1868 [Google Scholar]
In the sky area of interest, the inner shell of the Local Bubble is found to be at a distance of 175 to 195 pc from the Sun, determined from https://doi.org/10.7910/DVN/RHPVNC (Pelgrims 2022) with some added margin to account for the thickness of the Local Bubble wall.
All Tables
Observation log for open clusters observed in the anticenter direction from AIMPOL along with the distance to the respective cluster (Hunt & Reffert 2023).
Polarization measurements and the reference values of highly polarized standard stars.
Polarization measurements of the unpolarized standard, star HD 14069, at each epoch.
Parameters of ten Galactic clusters in the direction of the anticenter with polarization measurements from our observations and the literature.
Sample of the polarization measurements of a few stars toward the cluster Kronberger 1.
Results of the BISP-1 characterization of the degree of polarization, polarization angle, and distance of the dust clouds along the line of sight of each cluster.
All Figures
|
Fig. 1 Polarization line segments overlaid on DSS R-band 25′ × 25′ field toward Kronberger 1 in panel (a), Berkeley 69 in (b), Berkeley 71 in (c), King 8 in (d), and Berkeley 19 in panel (e). The length of the segment is proportional to the degree of polarization, and the orientation depicts the polarization angle. The red lines represent the polarization measurements of probable member stars, and the solid gray line in the upper left corner corresponds to the orientation of the Galactic plane. A reference line for the polarization of 5% and a polarization angle of 90° is also drawn in the lower right corner of each panel. |
| In the text | |
|
Fig. 2 Scatter plot of P and θ of observed stars toward Kronberger 1 (panel a), Berkeley 69 (panel b), Berkeley 71 (panel c), King 8 (panel d), and Berkeley 19 (panel e). The error bars represent the uncertainties in the polarization measurements (σP and σθ). The open red circle in all the panels corresponds to the P and θ values of probable member stars. The dashed gray line depicts the orientation of the Galactic plane in the respective cluster direction. |
| In the text | |
|
Fig. 3 WISE W4 map of 25′ × 25′ fields, centered on Kronberger 1 (panel a), Berkeley 69 (panel b), Berkeley 71 (panel c), King 8 (panel d), and Berkeley 19 (panel e). The polarization segments are the same as in Fig. 1 for member stars (in red), and field stars (in black) are superimposed on the respective WISE map. The color scale in the maps represents the WISE W4 intensity (in DN), and the contours correspond to its constant value. |
| In the text | |
|
Fig. 4 Herschel 250 µm dust map of Kronberger 1 in panel a and Berkeley 71 in panel b. The contours correspond to the constant Herschel 250 µm intensity. The polarization measurements are overplotted on the dust map, and the color-coding and orientation are similar to Fig. 1. A 5% polarization line perpendicular to celestial north is also added in the bottom corner on the right side. |
| In the text | |
|
Fig. 5 Variation in the degree of polarization (P), polarization angle (θ), and reddening E(B–V) as a function of distance rpgeo for the clusters. Panel a shows Kronberger 1, panel b Berkeley 69, panel c Berkeley 71, panel d King 8, and panel e Berkeley 19. The vertical dashed lines in each panel denote the location of the foreground dust layers derived from visual inspection. |
| In the text | |
|
Fig. 6 Distribution of q (in green) and u (in blue) parameter of the stars as a function of their distance modulus (µ) or distance toward Kronberger 1 in (a), Berkeley 69 in (b), Berkeley 71 in (c), King 8 in (d), and Berkeley 19 in panel (e). The solid vertical red line indicates the median of the posterior distribution on the cloud distance, and the light and dark shaded area denotes the range of 2.5 to 97.5 percentiles and 16 to 84 percentiles of the distribution. The green and purple horizontal lines indicate the median value of q and u from the posterior distribution of the mean Stokes parameters of the foreground dust clouds. The shaded areas represent the 2.5 to 97.5 and 16 to 84 percentiles of the distributions. |
| In the text | |
|
Fig. 7 Distance of the dust layers along the line of sight of observed cluster directions inferred from visual inspection (light red squares) and BISP-1 algorithm (black points). The thick black line around the black point corresponds to the 16th and 84th percentiles of the cloud distance, and the thin line represents the 2.5 and 97.5 percentile ranges. The cluster distances are marked by different colored symbols at their respective Galactic latitude positions. The vertical lines represent the location of the Spiral arms: the Local arm (cyan), the Perseus arm (yellow), and the Outer arm (red). |
| In the text | |
|
Fig. 8 Variation in the degree of polarization (top panel) and polarization angle (bottom panel) with rp𝑔eo for all the stars (members and nonmembers) observed in the direction of the anticenter. The black points with error bars represent the average P and θ values in rp𝑔eo distance bins of 500 pc width. The error bars correspond to the standard deviation in the P and θ values in each distance bin. The distance to the spiral arms is marked by vertical lines using the same colors as in Fig. 7. |
| In the text | |
|
Fig. 9 Weighted average degree of polarization (top panel) and polarization angle (bottom panel) vs. the distance of each cluster in different colored symbols. The shaded ellipse corresponds to the weighted standard deviation in the corresponding axes. |
| In the text | |
|
Fig. A.1 Variation of the degree of polarization (P, a), and polarization angle (θ, b) as a function of distance, rp𝑔eo for Kronberger 1 cluster direction. The probable cluster member stars are marked by the red open circles. The solid blue line in panel (b) represents the orientation of the Galactic plane in this direction, and the vertical gray lines in both panels correspond to the expected distance to the foreground clouds. |
| In the text | |
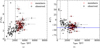 |
Fig. A.2 Same as Fig. A.1 but towards Berkeley 69 cluster direction. |
| In the text | |
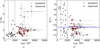 |
Fig. A.3 Same as Fig. A.1 but towards Berkeley 71 cluster direction. |
| In the text | |
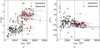 |
Fig. A.4 Same as Fig. A.1 but towards King 8 cluster direction. |
| In the text | |
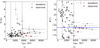 |
Fig. A.5 Same as Fig. A.1 but towards Berkeley 19 cluster direction. |
| In the text | |
Current usage metrics show cumulative count of Article Views (full-text article views including HTML views, PDF and ePub downloads, according to the available data) and Abstracts Views on Vision4Press platform.
Data correspond to usage on the plateform after 2015. The current usage metrics is available 48-96 hours after online publication and is updated daily on week days.
Initial download of the metrics may take a while.