Fig. 6
Download original image
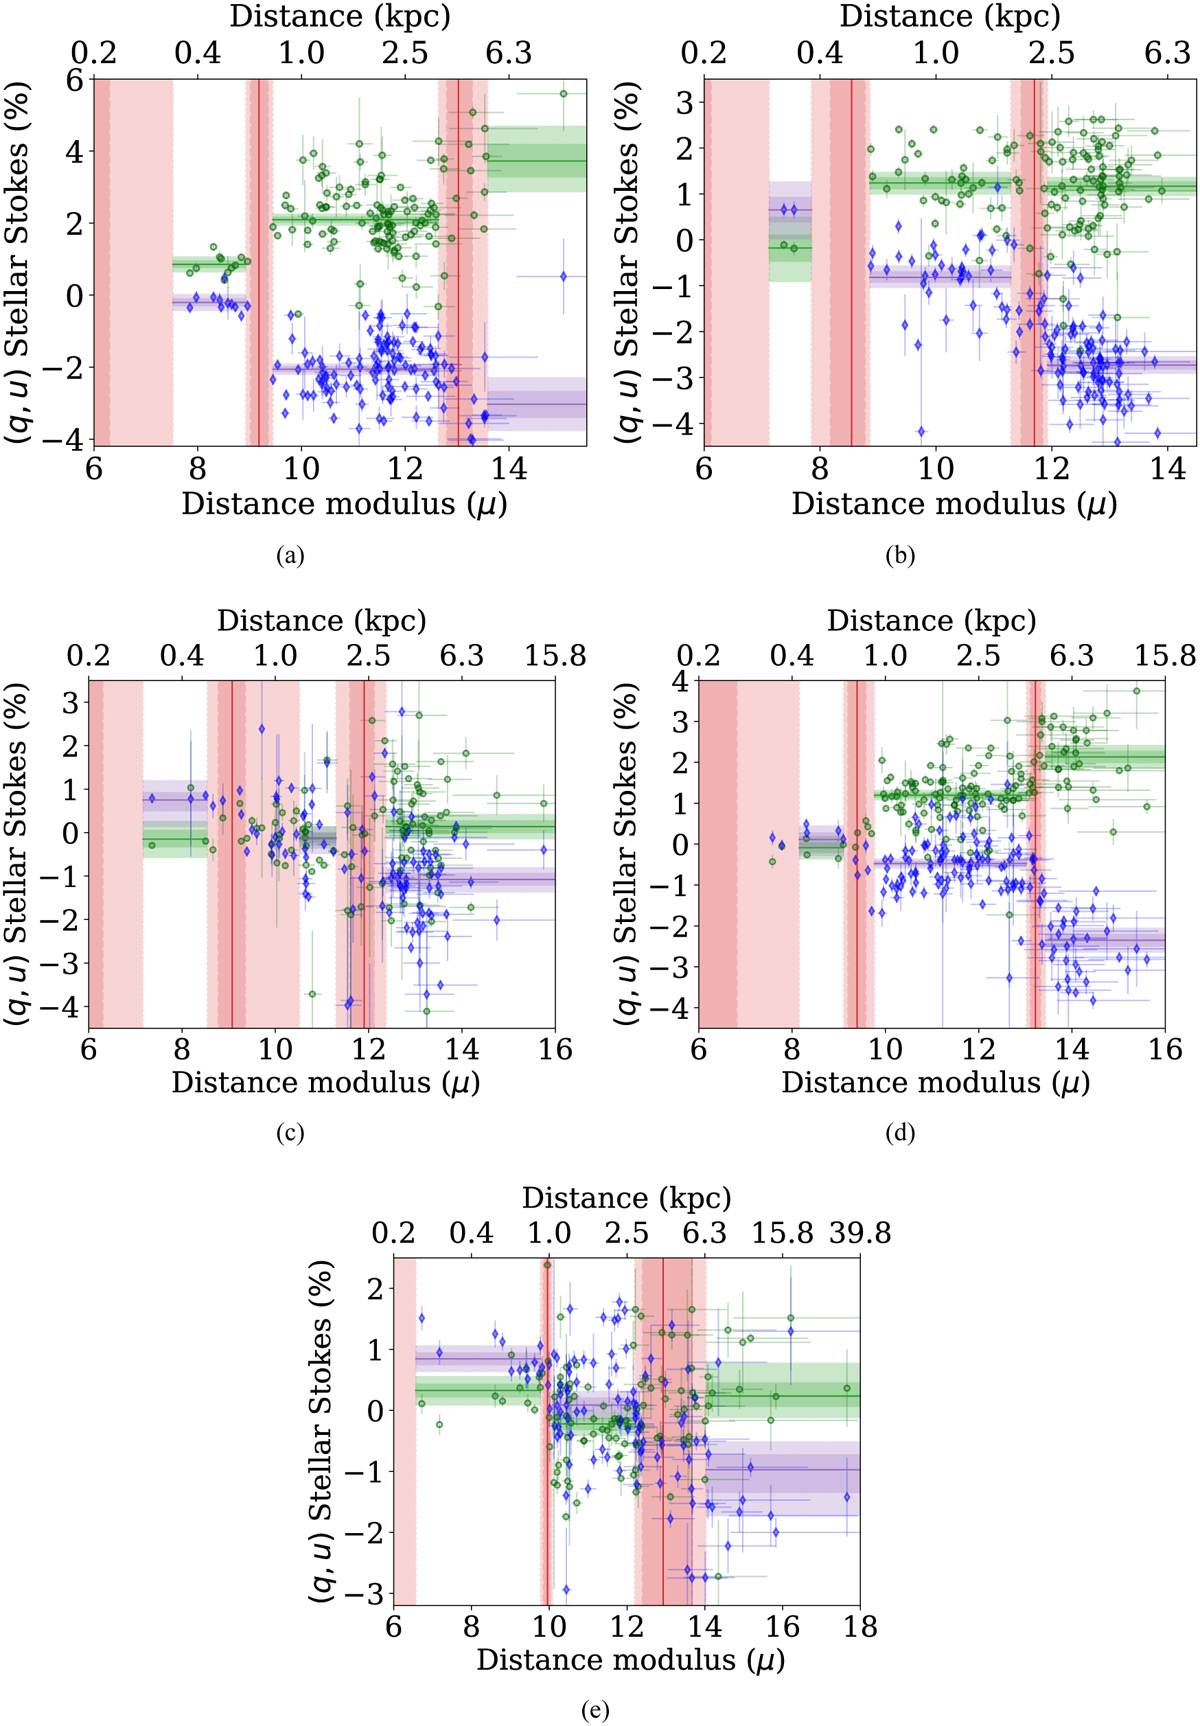
Distribution of q (in green) and u (in blue) parameter of the stars as a function of their distance modulus (µ) or distance toward Kronberger 1 in (a), Berkeley 69 in (b), Berkeley 71 in (c), King 8 in (d), and Berkeley 19 in panel (e). The solid vertical red line indicates the median of the posterior distribution on the cloud distance, and the light and dark shaded area denotes the range of 2.5 to 97.5 percentiles and 16 to 84 percentiles of the distribution. The green and purple horizontal lines indicate the median value of q and u from the posterior distribution of the mean Stokes parameters of the foreground dust clouds. The shaded areas represent the 2.5 to 97.5 and 16 to 84 percentiles of the distributions.
Current usage metrics show cumulative count of Article Views (full-text article views including HTML views, PDF and ePub downloads, according to the available data) and Abstracts Views on Vision4Press platform.
Data correspond to usage on the plateform after 2015. The current usage metrics is available 48-96 hours after online publication and is updated daily on week days.
Initial download of the metrics may take a while.