Fig. 5
Download original image
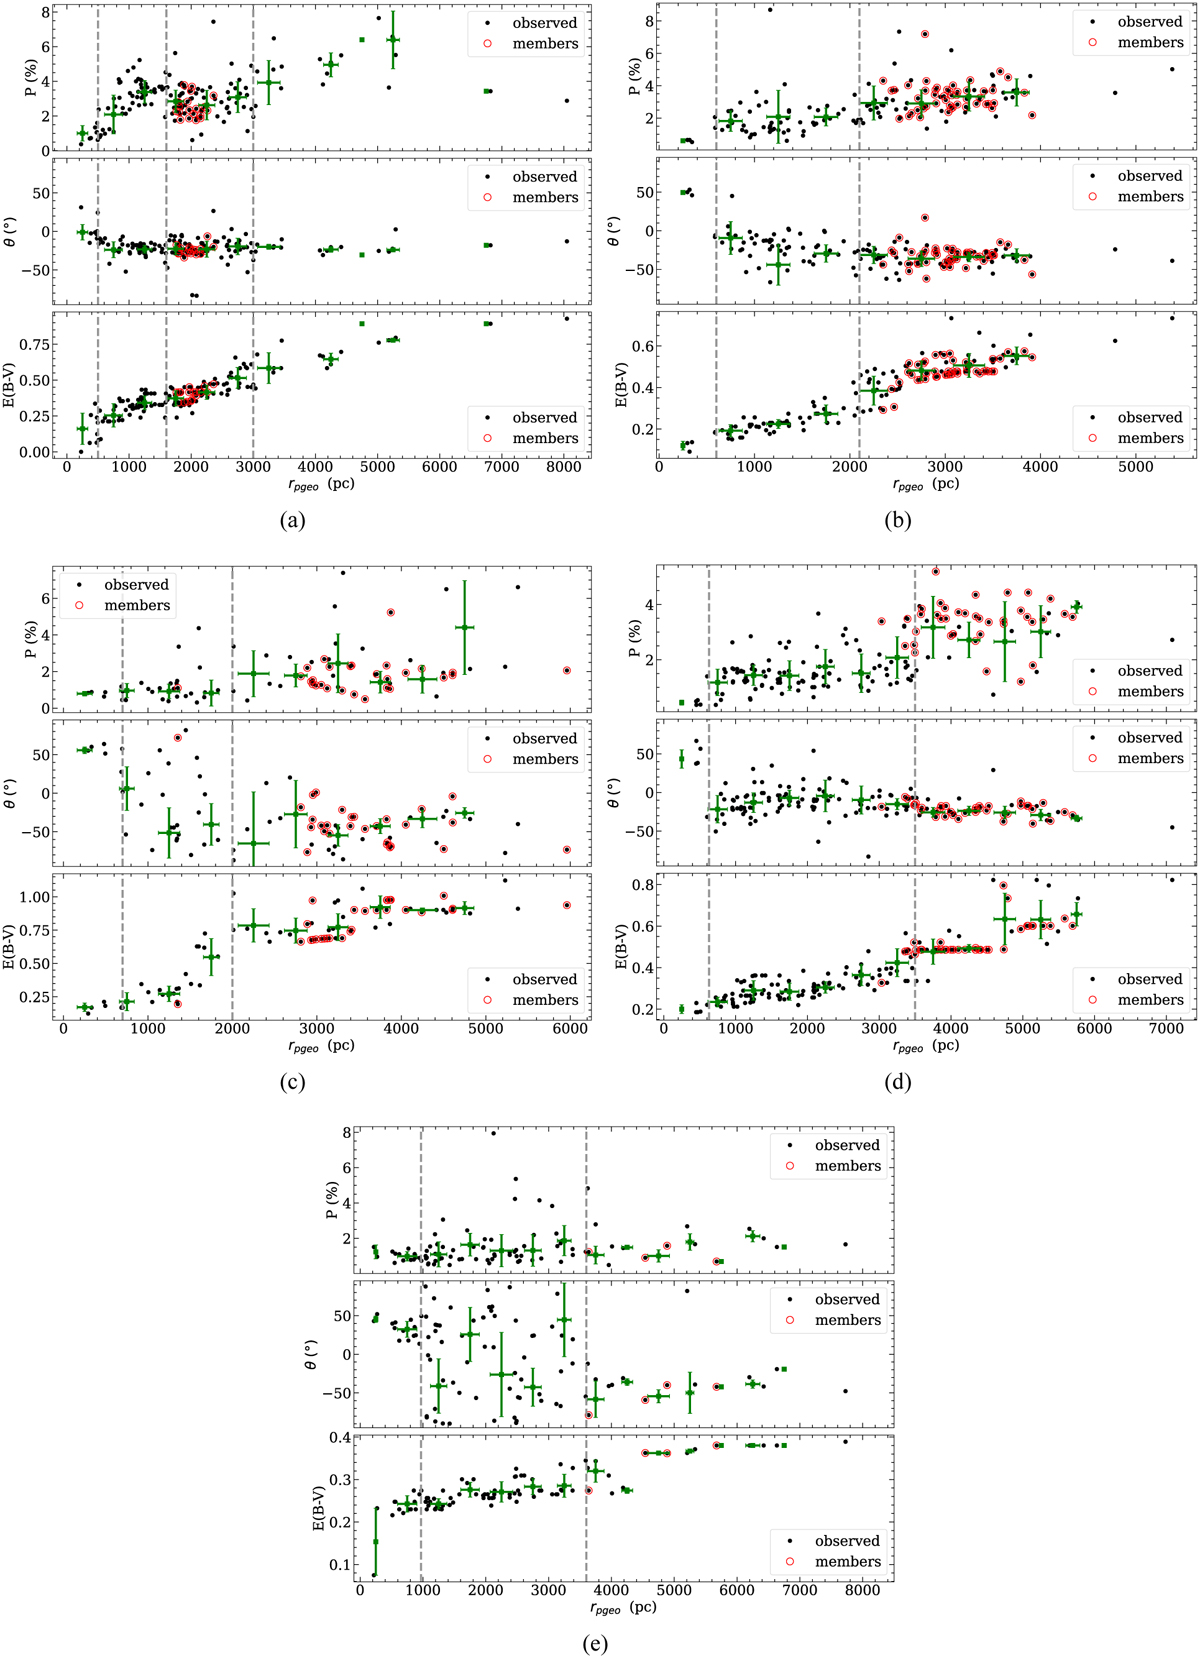
Variation in the degree of polarization (P), polarization angle (θ), and reddening E(B–V) as a function of distance rpgeo for the clusters. Panel a shows Kronberger 1, panel b Berkeley 69, panel c Berkeley 71, panel d King 8, and panel e Berkeley 19. The vertical dashed lines in each panel denote the location of the foreground dust layers derived from visual inspection.
Current usage metrics show cumulative count of Article Views (full-text article views including HTML views, PDF and ePub downloads, according to the available data) and Abstracts Views on Vision4Press platform.
Data correspond to usage on the plateform after 2015. The current usage metrics is available 48-96 hours after online publication and is updated daily on week days.
Initial download of the metrics may take a while.