Fig. 4
Download original image
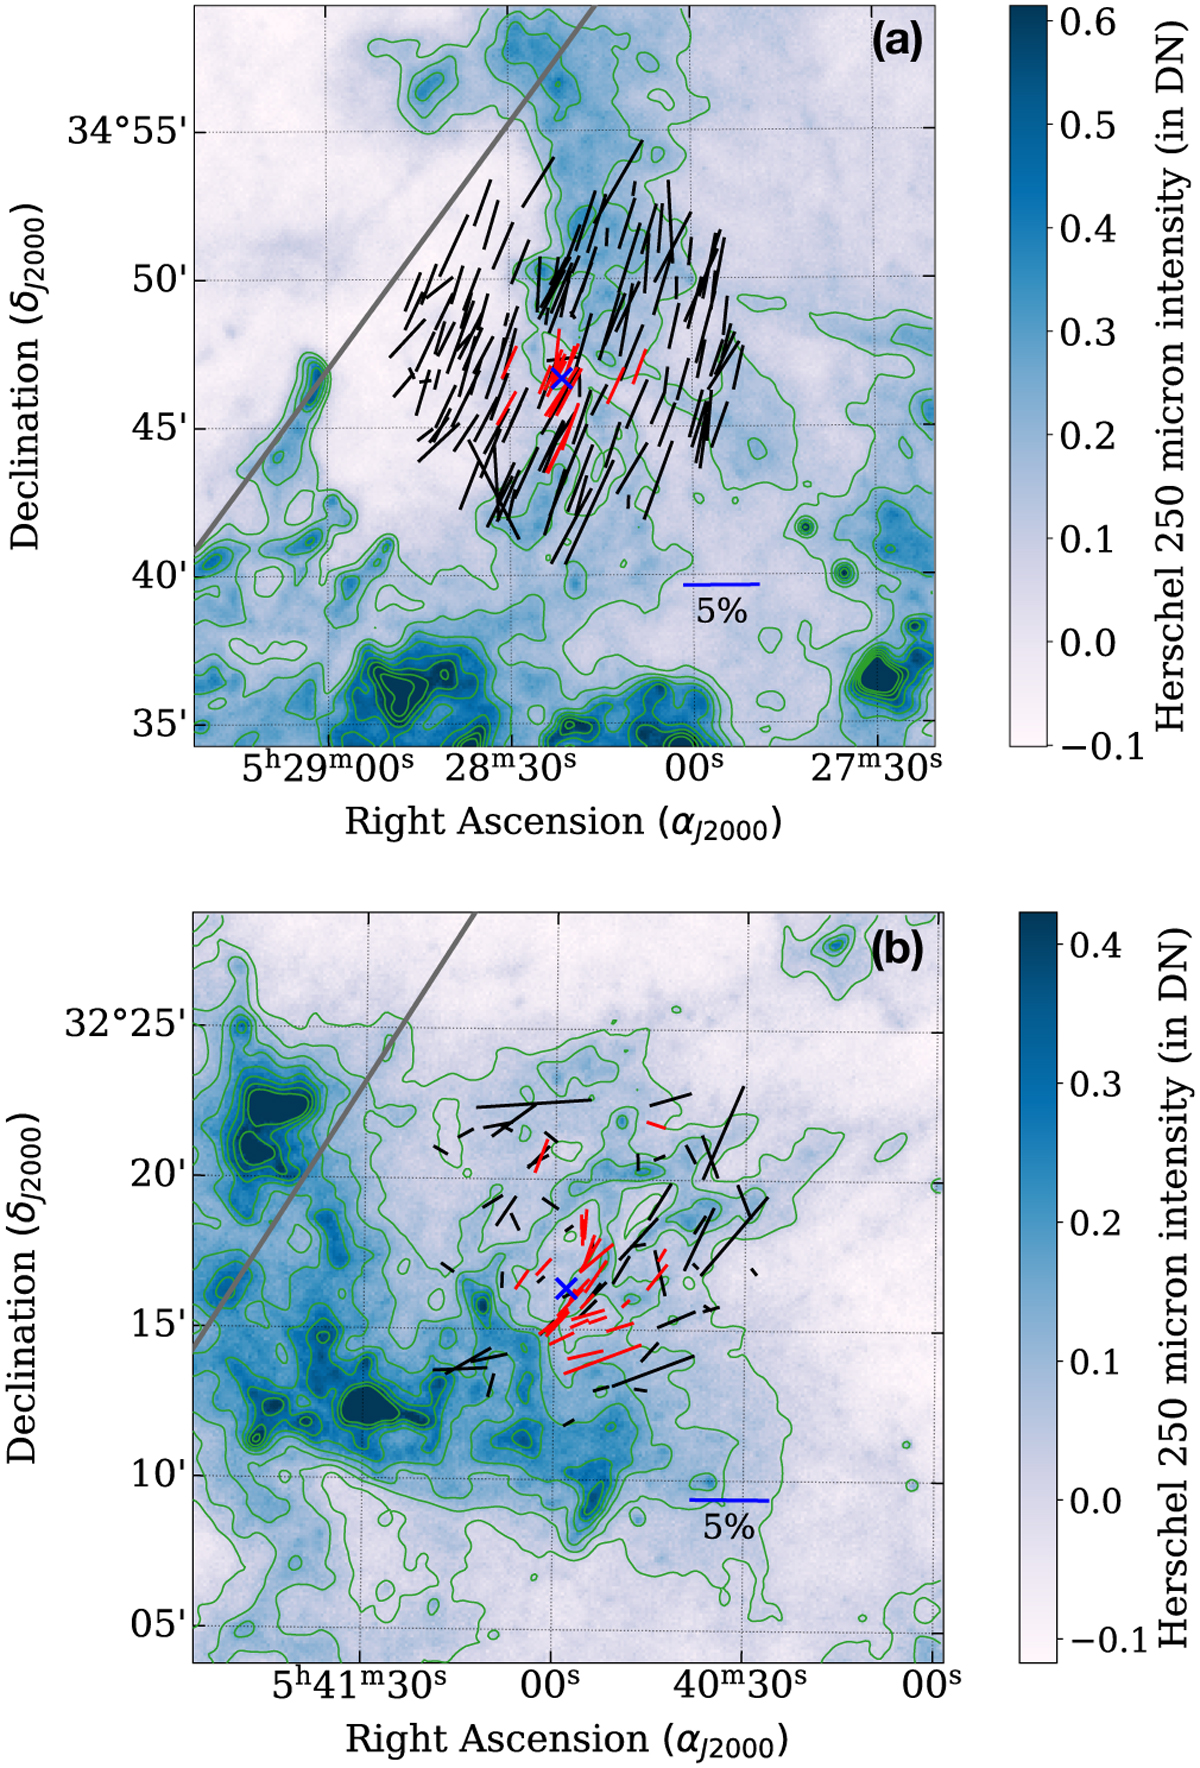
Herschel 250 µm dust map of Kronberger 1 in panel a and Berkeley 71 in panel b. The contours correspond to the constant Herschel 250 µm intensity. The polarization measurements are overplotted on the dust map, and the color-coding and orientation are similar to Fig. 1. A 5% polarization line perpendicular to celestial north is also added in the bottom corner on the right side.
Current usage metrics show cumulative count of Article Views (full-text article views including HTML views, PDF and ePub downloads, according to the available data) and Abstracts Views on Vision4Press platform.
Data correspond to usage on the plateform after 2015. The current usage metrics is available 48-96 hours after online publication and is updated daily on week days.
Initial download of the metrics may take a while.