| Issue |
A&A
Volume 689, September 2024
|
|
|---|---|---|
| Article Number | A269 | |
| Number of page(s) | 14 | |
| Section | Extragalactic astronomy | |
| DOI | https://doi.org/10.1051/0004-6361/202449966 | |
| Published online | 20 September 2024 | |
Central oxygen abundances in the spiral galaxies of the MaNGA survey: Galaxies with central starbursts
1
Institute of Theoretical Physics and Astronomy, Vilnius University, Sauletekio av. 3, 10257 Vilnius, Lithuania
2
Main Astronomical Observatory, National Academy of Sciences of Ukraine, 27 Akademika Zabolotnoho St, 03680 Kiev, Ukraine
Received:
13
March
2024
Accepted:
19
June
2024
Abstract
We examine whether there are deviations of the local central oxygen abundances in spiral galaxies from the general metallicity gradients. We compare the values of the central intersect oxygen abundances estimated from the metallicity gradient based on the integral field unit (IFU) spectroscopy from the Mapping Nearby Galaxies at the Apache Point Observatory (MaNGA) survey and the local central oxygen abundances obtained from the single-fibre observations from the Sloan Digital Sky Survey (SDSS). Special attention is placed on galaxies with recent and currently ongoing central starbursts (cSB galaxies). We selected a sample of 30 cSB galaxies from our total sample of 381 MaNGA galaxies, using the decrease in the Dn4000 index (a stellar age indicator) in the circumnuclear region as the selection criterion. We found that the local central oxygen abundances follow the general metallicity gradients in the galaxies well and agree with the central intersect abundances within uncertainties of the central abundances determinations. Starbursts in the centres of cSB galaxies do not produce noticeable oxygen enrichments. The central starbursts imply that an appreciable amount of gas is present at the centres of cSB galaxies. The gas at the centre of galaxy can serve not only as a raw material for the star formation, but also as a fuel for the activity of the galactic nucleus (AGN). We found that the AGN is the main source of the ionising radiation at the centres of six cSB galaxies in our sample.
Key words: galaxies: abundances / galaxies: ISM / galaxies: spiral / galaxies: starburst
Corresponding author; This email address is being protected from spambots. You need JavaScript enabled to view it. .
© The Authors 2024
 Open Access article, published by EDP Sciences, under the terms of the Creative Commons Attribution License (https://creativecommons.org/licenses/by/4.0), which permits unrestricted use, distribution, and reproduction in any medium, provided the original work is properly cited.
This article is published in open access under the Subscribe to Open model. This email address is being protected from spambots. You need JavaScript enabled to view it. to support open access publication.
1. Introduction
It has been known for some time that the discs of spiral galaxies exhibit negative radial abundance gradients in the sense that the abundance is higher at the centre and decreases with the galactocentric distance (Searle 1971; Smith 1975). The characteristic abundances are used to compare the abundance properties among a sample of spiral galaxies. The oxygen abundance at the centre of a galaxy is the most frequently used choice for the characteristic abundance (Vila-Costas & Edmunds 1992; Tremonti et al. 2004; Pilyugin et al. 2004, 2014, 2019; Curti et al. 2020, among many others). Alternatively, the value of oxygen abundance at the effective (half-light) radius as a characteristic metallicity of the galaxy is also used in many investigations (e.g. Garnett & Shields 1987; Garnett 2002; Sánchez et al. 2013, 2019; Alvarez-Hurtado et al. 2022; Sánchez-Menguiano et al. 2024). The value of oxygen abundance at other radiuses can be also used as a characteristic metallicity of a galaxy. For instance, Zaritsky et al. (1994) defined the characteristic oxygen abundance as the abundance at 0.4 R25, where R25 is the optical (or isophotal) radius of the galaxy. This galactocentric distance is close to the effective radius of the galaxy.
Integral field unit (IFU) spectroscopy for a large sample of spiral galaxies was obtained within a framework of the Mapping Nearby Galaxies at Apache Point Observatory survey (MaNGA, Bundy et al. 2015). Those measurements provide a possibility to determine a distribution of oxygen abundances across the galactic discs and establish radial oxygen abundance distributions. In our previous study (Pilyugin & Tautvaišienė 2024), we considered two sequences of well measured spiral galaxies from the MaNGA survey with different shapes of the radial oxygen abundance distributions. The gradients in those galaxies were approximated by a single or broken linear relation. The binned oxygen abundances (the median values of the abundances in bins of 0.05 dex in R/R25) were used instead of the oxygen abundances in individual spaxels in order to minimise the influence of the spaxels with unreliable abundances in determining the radial abundance distribution. The majority of the binned oxygen abundances are close to the O/H – R relation, with the mean deviation in the O/H from the relation being less than ∼0.01 dex. However, appreciable deviations from the O/H – R relation can take place in the spaxels near the galactic centres. These deviations can be attributed to uncertainties in the oxygen abundance determinations in those spaxels (Pilyugin & Tautvaišienė 2024). Therefore, those spaxels are rejected in the determination of the radial abundance gradient, and the central oxygen abundance in a galaxy is estimated as the intersect value of the determined radial abundance distribution. Belfiore et al. (2017) noted that the observed metallicities in spaxels near the galactic centre can be affected by the ‘beam-smearing’ effect of a point spread function (PSF). The point spread function of the MaNGA measurements is estimated to have a full width at the half maximum (FWHM) of 2.5 arcsec or five pixels (Bundy et al. 2015; Belfiore et al. 2017). For low R25/PSF ratios and high galaxy inclinations, the error in the oxygen abundance at the centre can be as high as ∼0.04 dex.
On the other hand, it cannot be excluded that the deviation of the central oxygen abundance from the general radial gradient can be real under some conditions. Indeed, some giant spiral galaxies undergo star formation bursts in their centres or have undergone such events in the recent past. It is important to investigate whether such galaxies have had their central oxygen abundances altered. Values of the Dn(4000) index (which is an indicator of the stellar age) increase with the decrease in the radius in the central regions of majority of giant spiral galaxies. In a number of giant spiral galaxies, the values of the Dn(4000) index at the central region increase with decreasing galactocentric distance up to some radius, and then start to decrease towards the centre. This suggests an appreciable recent star formation in centres of those galaxies. We refer to those galaxies as central starburst galaxies (cSB galaxies). If the star burst alters the (local) oxygen abundance at the centre of spiral galaxy, then the intersect oxygen abundance does not correspond to the real central abundance in the cSB galaxy. Unfortunately, the uncertainties in the oxygen abundances in spaxels near the centre estimated on the base of the MaNGA observations are an obstacle to distinguishing whether the deviation of the observed central abundance from the general gradient is real or false.
A single-fibre spectroscopy of centres for a large number of galaxies (including the MaNGA galaxies) was carried out within the Sloan Digital Sky Survey (SDSS, York et al. 2000). A comparison between the intersect values of the central abundances based on the MaNGA measurements and oxygen abundances estimated from the SDSS measurements offers an opportunity to reveal the deviation in the oxygen abundance at the centre of spiral galaxy from the general radial metallicity gradient, if such a deviaton does indeed exist.
A significant star formation rate at the galactic centre implies that an appreciable amount of gas is present at (or flows on) the centre of galaxy. It is believed (e.g. Heckman & Best 2014) that the nuclei of most, and quite possibly all, massive galaxies host a central supermassive black hole (SMBH). The gas at the centre of galaxy can serve not only as the raw material for the star formation but also as the fuel to the active galactic nucleus (AGN). We can expect that both main excitation mechanisms (i.e. starburst or AGN) can be found at the centres of giant spiral cSB galaxies. The classification of spaxel spectra using the Baldwin-Phillips-Terlevich diagnostic diagram (BPT diagram, Baldwin et al. 1981) and examination of distributions of spaxels with different BPT types of the radiation in the circumnuclear regions can reveal an interplay between the star formation and AGN in those galaxies. The use of the equivalent width of the emission Hα line versus velocity dispersion diagram (WHaD diagram, Sánchez et al. 2024) as an alternative diagnostic of different ionising sources can demonstrate an interplay between the star formation and AGN in those galaxies. This can also clarify the origin of the deviations of the oxygen abundances in spaxels near the centre from the general gradient in some MaNGA galaxies.
In this work, we examine whether there are deviations of the local central oxygen abundances in spiral galaxies from the general metallicity gradients. We verify the validity of the central intersect oxygen abundances determined from the MaNGA observations by comparing them with the central oxygen abundances estimated from the fibre SDSS spectra. Special attention is paid to the cSB galaxies. We examine sources of the ionising radiation (starburst or AGN) at the centres of cSB galaxies in two ways: (1) by constructing the distributions of spaxels with different BPT types of the radiation in the circumnuclear regions and (2) by using an alternative diagnostic (WHaD diagram) of different ionising sources. The paper is organised in the following way: the data are described in Section 2, Section 3 presents a discussion, and Section 4 provides a summary.
2. Data
2.1. Sample
Our investigation is based on galaxies from the MaNGA survey (Bundy et al. 2015). Using the publicly available spectroscopy (Data Release 17, Abdurro’uf et al. 2022), we determined maps and radial distributions of properties in 381 MaNGA galaxies. For the current study, we selected a sample of galaxies using the criteria described below.
We selected galaxies whose curves for the isovelocities in the measured gas velocity fields correspond to a set of parabola-like curves (i.e. an hourglass-like appearance of the rotation disc). This condition offers the possibility of selecting a sample of disc galaxies and to determine the orientation of the galaxy in space (the pixel coordinates of the galactic rotation centre, position angle of the major kinematic axis, and inclination angle of a galaxy) and the rotation curve. These geometrical parameters are necessary in determination of the galactocentric distances of spaxels. This criterion also allows us to reject strongly interacting and merging galaxies.
Galaxies with an inclination angle larger than ∼70° were rejected because a fit of the Hα velocity field in galaxies with a high ratio of the major to minor axis can produce unrealistic values of the inclination angle (Epinat et al. 2008); as a result, the estimated galactocentric distances of the spaxels located far from the major axis could then involve large uncertainties. In addition, the interpretation of the abundance in an individual spaxel may be questioned because the spaxel spectra involve radiations that originated at different galactocentric distances. At the same time, galaxies with a small inclination (face-on galaxies) are included in our sample. The inclination angle determined for the face-on galaxy may involve a significant uncertainty. The uncertainty in the inclination angle of the face-on galaxy results in a small uncertainty in the galactocentric distances of spaxels, but results in a significant uncertainty in the obtained rotation velocity. Therefore, the rotation velocities are not considered in the current study. Instead, the stellar mass of the galaxy and its size (optical radius) are used as global parameters.
The MaNGA galaxies mapped with 91 and 127-fibre IFU, covering 27 5 and 32
 5 on the sky (with a large number of spaxels over the galaxy image) are taken into consideration. Only the galaxies where the spaxels with measured emission lines are well distributed across galactic discs, covering more than ∼0.75 R25, are considered. This condition provides a possibility to estimate more or less reliable values of the kinematic angles, the optical radius, and the radial distributions of different characteristics.
The emission line parameters of the spaxel spectra for our sample of galaxies were taken from the MaNGA Data Analysis Pipeline (DAP) measurements. We determined the characteristics of out sample of galaxies using the last version of DAP measurements: ‘manga-n-n-MAPS-SPX-MILESHC-MASTARSSP.fits.gz’1 for the spectral data and the data reduction pipeline (DRP) measurements: ‘manga-n-n-LOGCUBE.fits.gz’2 for the photometric data. Determinations of the geometrical parameters of galaxies (i.e. coordinates of the centre, position angle of the major axis, inclination angle, and isophotal radius), construction of the maps, and the radial distributions of different characteristics across galaxies were carried out in the same manner described in our previous papers (Pilyugin et al. 2018, 2019, 2021; Pilyugin & Tautvaišienė 2024).
2.2. Sample of galaxies with central starbursts (cSB galaxies)
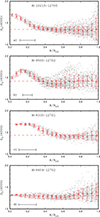 |
Fig. 1. Examples of different behaviour of the Dn(4000) indices along the galactic radius. Panel a: M-10215-12705, an example of galaxy with the increasing Dn(4000) towards the centre at the central region. Panels b,c: M-9500-12702 (panel a) and M-8335-12701 (panel b), examples of galaxies where the Dn(4000) at the central region increases up to some radius and then decreases towards the centre. Panel d: M-8454-12702, an example of the galaxy with a small variation in the values of Dn(4000) indices along the radius. In each panel, the grey points denote Dn(4000) indices in the individual spaxels, the red circles mark the median values of the Dn(4000) in bins of 0.05 in the fractional radius R/R25, the bars show a scatter in Dn(4000) about the median value in the bins, and the red dashed line shows the median value of the Dn(4000) indices in all spaxels within the optical radius. The horizontal bar indicates the point spread function in the MaNGA measurements. |
The Dn(4000) index is an indicator of the stellar age. The decrease in Dn(4000) at the galactic centre offers evidence that an appreciable star formation occur at the centre of the galaxy recently or at the recent past. Thus, the decrease in Dn(4000) at the centre of the galaxy can be used as a criterion to select galaxies with the central starbursts (cSB galaxy). There is also another possibility to determine the (luminosity-weighed) ages of stellar populations in spaxels of the MaNGA galaxies; for instance, as applied by Sánchez et al. (2022), namely, by fitting the spaxel spectrum with a combination of simple stellar population spectra. Pilyugin & Tautvaišienė (2024) compared the stellar ages based on the spectral index Dn(4000) and luminosity-weighed ages of the stellar populations in spaxels of the MaNGA galaxies and showed that the behaviours of the values of both stellar ages along the radius is similar. Thus, in this work, we used the radial distribution of the Dn(4000) indices to select a sample of cSB galaxies.
General characteristics of our sample of the MaNGA galaxies with central starbursts (cSB galaxies)
In Fig. 1, we show examples of three different types of the Dn(4000) index behaviours along galactic radius. The position of the spaxel in the disc is specified by the fractional radius, Rg, normalised to the isophotal (or optical) radius Rg = R/R25. Panel (a) in Fig. 1 shows the Dn(4000) index as a function of radius for the MaNGA galaxy M-10215-12705, which is a Sbc galaxy with a stellar mass of log(M⋆/M⊙) = 11.087 and a physical optical radius of R25 = 22.83 kpc. Then, M-10215-12705 is an example of galaxy with the increase in Dn(4000) towards the centre in the central region. This behaviour of Dn(4000) along the radius is typical for giant spiral galaxies.
Panel (b) in Fig. 1 shows Dn(4000) as a function of the radius for the MaNGA galaxy M-9500-12702, which is a SBab galaxy with the stellar mass of log(M⋆/M⊙) = 10.744 and the physical optical radius of R25 = 13.68 kpc. M-9500-12702 is an example of galaxy where Dn(4000) at the central region increases with decrease in the radius up to a certain value, and then decreases towards the centre. Panel (c) in Fig. 1 shows another example of galaxy where Dn(4000) at the central region increases with decrease in the radius up to a certain value, and then decreases towards the centre. The MaNGA galaxy M-8335-12701 is a galaxy of the stellar mass of log(M⋆/M⊙) = 10.973 and of the physical optical radius of R25 = 17.92 kpc. Panel (d) in Fig. 1 shows Dn(4000) as a function of radius for the MaNGA galaxy M-8454-12702, which is a SBbc galaxy with the stellar mass of log(M⋆/M⊙) = 11.136 and of the physical optical radius of R25 = 20.67 kpc. Then, M-8454-12702 is an example of galaxy with a small variation in the Dn(4000) indices along the radius.
It should be noted that the scatter in the Dn(4000) indices in individual spaxels at a given galactocentric distance can significantly increase with the radius and the binned values can increase along the radius in the outer parts in many galaxies. We can assume that measurements of Dn(4000) in individual spaxels in the outer parts of galaxies can involve large uncertainties. The increase in the binned Dn(4000) with the radius (at least a major part of this increase) is not real and ought to be attributed to the uncertainties in Dn(4000) measurements in individual spaxels.
We selected a sample of 30 cSB galaxies in which the Dn(4000) indices at central regions increase with the decrease in the radius up to some radius, then decrease towards the centre (radial Dn(4000) distributions shown in the panels (b) and (c) of Fig. 1). The radial distributions of the Dn(4000) indices, the suface brightness in the Hα emission line, the oxygen abundances and maps of the distribution of the radiation of different BPT types across the image of galaxy for our sample of the cSB galaxies are shown in Figs. A.1–A.5 in the appendix3.
Table 1 lists the general characteristics of each cSB galaxy of our sample. The first column gives the MaNGA name for each galaxy. The distance is reported in Column 2. The distances to the galaxies were adopted from the NASA/IPAC Extragalactic Database (NED)4. The NED distances use the flow corrections for Virgo, the Great Attractor, and Shapley Supercluster infall (adopting a cosmological model with H0 = 73 km/s/Mpc, Ωm = 0.27, and ΩΛ = 0.73). The reported errors in distances are less than 10%. The stellar mass is given in Column 3. We have chosen the spectroscopic Msp masses of the SDSS and Baryon Oscillation Spectroscopic Survey in SDSS-III (BOSS, see Dawson et al. 2013). The spectroscopic masses are taken from the table STELLARMASSPCAWISCBC03, and were determined using the Wisconsin method (Chen et al. 2012) with the stellar population synthesis models from Bruzual & Charlot (2003). The reported errors in the values of the stellar mass are usually within 0.15–0.2 dex. The isophotal radius R25 in arcsecond, determined here, is listed in Column 4. The isophotal radius in kiloparsecs, obtained from the isophotal radius in arcsecond (Column 4) and the adopted distance (Column 2), is listed in Column 5. The central intersect oxygen abundance 12+log(O/H)0, intersect estimated from the metallicity gradient determined on the base of the IFU spectroscopy from the MaNGA is reported in Column 6. The local central oxygen abundance 12+log(O/H)SDSS obtained from the single-fibre observations from the SDSS is given in Column 7. The configuration of the distribution of the BPT types of the radiation at the centre (SF – H II region-like spectra at the centre, INT – intermediate type spectra, AGN – AGN-like spectra, SF+INT – the inner region of the H II-region-like radiation is surrounded by a ring of radiation of the intermediate type) is reported in Column 8. The presence of a bar at the centre of galaxy according to the HyperLeda5 database (Makarov et al. 2014) is indicated in Column 9. The environment (isolated galaxy or a group member) according to Tempel et al. (2018) is reported in Column 10.
The enhancement of specific star formation in central regions of galaxies can be attributed to the galaxy-galaxy interactions (e.g. Barrera-Ballesteros et al. 2015; Guo et al. 2016; Thorp et al. 2019). We examined whether the central starbursts in galaxies of our sample are linked to their present-day environment or to the presence of the bar. Overall, 26 cSB galaxies of our sample are in a catalogue of galaxy groups and clusters (Tempel et al. 2018); furthermore, 16 cSB galaxies are members of galaxy groups, and 10 galaxies are classified as isolated galaxies. The bars present at the centres of 14 cSB galaxies (in 7 isolated galaxies and in 7 galaxies that are members of the groups) according to the morphological classification from the HyperLeda. Thus, there is no distinctive link of the central starburst in a galaxy to its present-day environment or to the presence of the bar. This suggests that either there is another reason responsible for the central starburst; alternatively, the central starbursts are not uniform in their origin and may instead originate from different pathways.
3. Discussion
3.1. Radiation of different BPT types in the circumnuclear regions of cSB galaxies
A significant star formation rate at the centre of galaxy implies that an appreciable amount of gas is available (flowing on) at the centre of the cSB galaxy. It is believed (e.g. Heckman & Best 2014) that the nuclei of most (and possibly all) massive galaxies host a central SMBH. It has been known for a long time that active galactic nuclei (AGNs) are powered by the gas accretion onto SMBHs (Zel’dovich 1964; Salpeter 1964; Lynden-Bell 1969). The gas at the centre of galaxy can serve not only as a raw material for the star formation but also as a fuel for the active galactic nucleus. Thus, we can expect both main excitation mechanisms (i.e. starburst or AGN) to be found at the centres of cSB galaxies.
The intensities of strong emission lines can be used to separate different types of spaxel spectra according to their main excitation mechanism (i.e. starburst or AGN). A widely used spectral classification of emission-line spectra is the [O III]λ5007/Hβ versus [N II]λ6584/Hα diagnostic diagram suggested by Baldwin et al. (1981). The BPT classification diagram can be seen in Fig. 2. Kauffmann et al. (2003) found an empirical demarcation line between the star-forming and AGN spectra in the BPT diagram (solid line in Fig. 2). This demarcation line can be interpreted as an upper limit of pure star forming spectra. The spectra located left (below) the demarcation line of Kauffmann et al. (2003) are referred to here as the H II region-like (or the SF-like) spectra (blue points in Fig. 2). Kewley et al. (2001) determined a theoretical demarcation line between the star forming and AGN spectra in the BPT diagram (short-dashed line in Fig. 2). This demarcation line is a theoretical upper limit for starburst models on the diagnostic diagram. The spectra located right (above) the demarcation line of Kewley et al. (2001) is referred to as the AGN-like spectra (black points in Fig. 2). The spectra located between the demarcation lines of Kauffmann et al. (2003) and Kewley et al. (2001) are referred to as the intermediate (INT) spectra (red points in Fig. 2). In the literature, those spectra are also referred to as composite or transition spectra (e.g. Davies et al. 2014a; Pons & Watson 2014, 2016). The long-dashed line in Fig. 2 is the dividing line between Seyfert galaxies and low-ionisation nuclear emission line regions (LINERs) defined by Cid et al. (2010). It should be noted that the exact location of the dividing line between starbursts (H II regions) and AGNs in the BPT diagram is still debatable (see, e.g. Kewley et al. 2001; Kauffmann et al. 2003; Stasińska et al. 2006, 2008; Herpich et al. 2016).
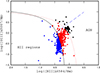 |
Fig. 2. Example of BPT diagrams for the individual spaxels in a galaxy. The individual spaxels with the H II-region-like spectra are denoted by the blue symbols, the spaxels with AGN-like spectra are shown by the dark symbols, and the red symbols are the spaxels with intermediate spectra. The solid and short-dashed curves mark the demarcation line between AGNs and H II regions defined by Kauffmann et al. (2003) and Kewley et al. (2001), respectively. The long-dashed line is the dividing line between Seyfert galaxies and LINERs defined by Cid et al. (2010). |
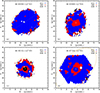 |
Fig. 3. Four configurations of the distribution of spaxels with spectra of different BPT types in the circumnuclear regions of cSB galaxies. The BPT radiation types for individual spaxels are colour-coded. The yellow circle shows the kinematic centre of the galaxy, the line indicates a position of the major kinematic axis of the galaxy, and the ellipse is the optical radius. |
There are four configurations obtained for the distribution of the radiation of different BPT types in the circumnuclear regions of cSB galaxies (see Fig. 3). In the first (SF), the central area involves spaxels with the H II region-like radiation only, as seen in panel (a) in Fig. 3. In the second, (INT), the radiation at the centre of a galaxy is the intermediate BPT type, as seen in panel (b) in Fig. 3. In the third (AGN), the innermost region of the AGN-like radiation is surrounded by a ring of radiation of the intermediate type, as seen in panel (c) in Fig. 3. In the fourth (SF+INT), the inner region of the H II region-like radiation is surrounded by a ring of radiation of the intermediate type, as seen in panel (d) in Fig. 3.
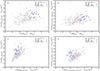 |
Fig. 4. Central sufrace brightness of Hα and oxygen [O III]λ5007 emission lines in galaxies with the circumnuclear regions of the SF and SF+INT BPT types. Panel a: Central surface brightness ΣHα, centre as a function of galaxy’s stellar mass. The grey circles denote all the galaxies, the red plus signs mark the cSB galaxies with the circumnuclear regions of the SF BPT type, and blue crosses show the cSB galaxies with the circumnuclear regions of the SF+INT BPT type. The green square is the MaNGA galaxy M-8454-12702. Panel b: Same as panel (a) but for the oxygen [O III]λ5007 emission line. Panel c: Central surface brightness ΣHα, centre as a function of the median surface brightness ΣHα, median. The designations are the same as in panel (a). Panel d: Same as panel (c) but for the oxygen [O III]λ5007 emission line. |
The radiation distributions of different BPT types in the circumnuclear regions of our sample of cSB galaxies are shown in panels of column (d) in Figs. A.1–A.5 in the appendix. Seven cSB galaxies show the SF configuration of the radiation distribution, two cSB galaxies show INT configuration, the AGN configuration is found in six cSB galaxies, and the SF+INT configuration is revealed in fifteen cSB galaxies. Thus, the SF radiation makes dominant contribution to the excitation of 22 cSB galaxies (SF and SF+INT configurations), while the AGN radiation dominates in the excitation of 6 cSB galaxies.
The position of the object on the BPT diagram is a widely used method of identifying the ionising source of nebular emission. However, the credibility of the classification of the ionising source of the region using only the BPT diagram has been questioned (e.g. Sánchez et al. 2014; Lacerda et al. 2018; D’Agostino et al. 2019; Sánchez 2020; Sánchez et al. 2021, 2024). In particular, it was found that the demarcation line of Kauffmann et al. (2003) in the BPT diagram does not provide the complete selection of the regions ionised by SF. From one side, Sánchez et al. (2014) noted that some H II regions can be found above the demarcation line of Kauffmann et al. (2003). From another side, SF can be not the only ionising source in some objects below this demarcation line. Kauffmann & Heckman (2009) created a set of mixing line ‘trajectories’ by averaging the emission-line luminosities of the star-forming and AGN objects in different proportions and found that the object locates below the demarcation line of Kauffmann et al. (2003) when the contribution from SF is greater than half of the total [O III] luminosity.
The intermediate spectra of spaxels in the circumnuclear region (e.g. a ring of radiation of the intermediate type around the innermost region of the AGN-like radiation) can be explained by the AGN-SF mixing where both the SF and AGN radiations make a contribution to the gas excitation (Kauffmann & Heckman 2009; Davies et al. 2014a, 2014b, 2016; Pilyugin et al. 2020). The proportion of the SF and AGN radiation contributions change smoothly with radius, from the AGN-like sources in spaxel spectra at the galactic centre, to the SF-like sources in spaxel spectra at larger galactocentric distances. Many galaxies involve spaxels of the intermediate spectra located far from the centres of galaxies (e.g. Belfiore et al. 2016; Hviding et al. 2018; Parkash et al. 2019). This offers evidence that the intermediate spectra in those spaxels are not produced by AGNs, instead, a source of the ionising photons in those spaxels can be attributed to the hot, low-mass evolved (postasymptotic giant branch) stars (HOLMES) (Stasińska et al. 2006, 2008; Sarzi et al. 2010; Yan & Blanton 2012; Singh et al. 2013). Belfiore et al. (2016) noted that sources of ionising photons in spaxels of the intermediate spectra near the centres of some galaxies can be also attributed to the HOLMES. Sánchez et al. (2014) noted that some H II regions can be found above the demarcation line of Kauffmann et al. (2003). Thus, the area in the BPT diagram between the demarcation curves of Kauffmann et al. (2003) and Kewley et al. (2001), as revealed by the intermediate spectra, is populated by the objects related to different ionising sources.
New methods for distinguishing the ionising source by use of another diagnostic indicators have been considered. One suggestion was to use the equivalent width of the emission Hα line, EWHα, (Cid et al. 2010, 2011; Sánchez et al. 2014, 2021, 2024; Lacerda et al. 2018) and the gas velocity dispersion, σhα, (D’Agostino et al. 2019; Johnston et al. 2023; Sánchez et al. 2024) as diagnostic indicators in addition to the emission-line ratios which are at the base of the BPT diagnostic diagram. Recently, Sánchez et al. (2024) proposed a new method that explores the location of different ionising sources in a diagram, which compares equivalent width of the emission Hα line, EWHα, and gas velocity dispersion, σhα, (WHaD diagram). These authors defined different areas in which the ionising source could be classified as: (1) SF: ionisation due to young-massive OB stars, related to recent star-formation activity; (2) sAGNs and wAGNs: ionisation due to strong (weak) AGNs, and other sources of ionisation such as high-velocity shocks; and (3) Ret: ionisation due to hot old low-mass evolved stars (post-AGBs), associated with retired regions within galaxies (in which there is no star-formation). In particular, they classified as SF those sources with a EWHα> 6 Å and σHα< 57 km/s.
In the current study, we have estimated the oxygen abundances in all the spaxels with the H II region-like spectra according to the BPT classification, that is, in the spaxels located below the demarcation line of Kauffmann et al. (2003) in the BPT diagram. We also carried out the WHaD classification. The comparison between the BPT and WHaD diagrams for our sample of the cSB galaxies is shown in Figs. B.1–B.3 in the appendix. The radial distributions of the oxygen abundances for individual spaxels in the cSB galaxies are shown by grey points in the panels of column (c) in Figs. A.1–A.5. The spaxels that show the H II region-like spectra according to the BPT classification, but do not identify in the SF area in the WHaD diagram, are marked by green plus signs in the panels of column (c) in Figs. A.1–A.5. The classification according to the WHaD diagram is taken into consideration in the discussion of the results.
3.2. Surface brightness in the emission lines at the centres of cSB galaxies
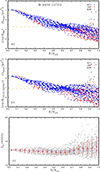 |
Fig. 5. Radial disributions of the sufrace brightness in the Hα and oxygen [O III]λ5007 emission lines and Dn(4000) index in the MaNGA galaxy M-8454-12702. Panel a: Surface brightness ΣHα as a function of radius. The blue symbols denote the spaxels with the H II region-like spectra, dark symbols mark the spaxels with the AGN-like spectra, and the red symbols are the spaxels with the intermediate spectra. The golden dashed line shows the median value ΣHα, median of the surface brightness in the spaxels with the optical radius of the galaxy. Panel b: Same as panel (a) but for the oxygen [O III]λ5007 emission line. Panel c: Dn(4000) index as a function of radius. The grey points denote Dn(4000) indeces in the individual spaxels, red circles mark the median values of the Dn(4000) in bins of 0.05 in the fractional radius R/R25, bars show the scatter in the Dn(4000) about the median value in the bins, and the blue dashed line shows the median value of the Dn(4000) in all the spaxels within optical radius. |
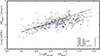 |
Fig. 6. Star formation rate as a function of the stellar mass of the galaxy. The grey circles denote all the galaxies, blue plus signs mark the cSB galaxies with the circumnuclear regions of the SF BPT type, blue crosses show the cSB galaxies with the circumnuclear regions of the SF+INT BPT type, red plus signs are the cSB galaxies with the circumnuclear regions of the INT BPT type, and red crosses show the cSB galaxies with the circumnuclear regions of the AGN BPT type. The green square is the MaNGA galaxy M-8454-12702. The SFR – M⋆ relations for the MaNGA galaxies obtained by Cano-Díaz et al. (2019) are shown by the dashed line for the early-type spirals and by the solid line for the late-type spirals. The dotted line denotes the SFR – M⋆ relation for the present-day epoch from Speagle et al. (2014). |
Here, we compare the surface brightness in the emission lines at the centres of cSB and other galaxies. The observed line fluxes in the spaxel spectra were corrected for the interstellar reddening and their absolute fluxes are estimated for the adopted distance to the galaxy. The surface brightness in the Hα and [O III]λ5007 emission lines are estimated for each spaxels taking into account the galaxy inclination (reduced to the face-on position). The radial distributions of the surface brightness in the Hα line for our sample of the cSB galaxies are shown in panels of column (b) in Figs. A.1–A.5. An inspection of those figures shows that the typical feature of the radial distributions of the Hα surface brightness in a cSB galaxy is a well defined central peak. The Hα flux of a region is a widely used indicator of the current star formation rate (Kennicutt 1998). The central peaks in the Hα surface brightness in galaxies selected on the base of the radial Dn(4000) index distributions confirm that the starbursts take place at the centres of the cSB galaxies. It should be noted that the central peaks in the Hα surface brightness can be partly attributed to the presence of the AGN-like source at the centre of the galaxy (see discussion below). Strictly speaking, the Hα flux is an indicator of the current star formation rate in regions with the H II region-like radiation. The AGN makes a dominant contribution to the high Hα surface brightness at the centre of the cSB galaxy with the AGN-like radiation in the circumnuclear region.
To compare the surface brightness in the cSB and other galaxies, we specify the radial distribution of the surface brightness in the Hα line in a galaxy using two values. The median value of the Hα surface brightness in five spaxels nearest to the centre is adopted as the Hα surface brightness at the centre of the galaxy, ΣHα, centre. We also estimated the median values of the Hα surface brightness for all the spaxels within the optical radius of the galaxy, ΣHα, median. In a similar way, we determined the central Σ[OIII]λ5007, centre and median Σ[OIII]λ5007, median surface brightness in the oxygen emission line [O III]λ5007.
Panel (a) of Fig. 4 shows the central Hα surface brightness, ΣHα, centre, as a function of the stellar mass for the galaxies with the H II region-like radiation at the centre. The grey circles denote the galaxies from our total sample, red plus signs mark the cSB galaxies with the circumnuclear regions of the SF BPT type, and blue crosses show the cSB galaxies with the circumnuclear regions of the SF+INT BPT type. The cSB galaxies of our sample are massive galaxies, log(M⋆/M⊙)≳ 10.5 (Fig. 4). Inspection of panel (a) of Fig. 4 shows that the central Hα surface brightness, ΣHα, centre, of cSB galaxies tend to be shifted towards the high surface brightness for galaxies of the given stellar masses. Consequently, the rates of the star formation of cSB galaxies tend to be shifted towards the high star formation rate for galaxies of a given stellar mass. However, the star formation rates at the centres of the cSB galaxies are not extraordinary high. Instead, they are comparable to the central star formation rates in other galaxies. Moreover, the star formation rates at centres of some other galaxies (e.g. in the galaxy M-8454-12702, marked by the green square in Fig. 4) are significantly higher than that in the cSB galaxies. In Fig. 5, we show the radial distributions of the sufrace brightness in the Hα and oxygen [O III]λ5007 emission lines and Dn(4000) indices in the MaNGA galaxy M-8454-12702. Panel (c) of Fig. 5 shows that there is no the local decrease in the Dn(4000) indices at the centre of M-8454-12702. Instead, the Dn(4000) values are low across the whole galaxy. Therefore, the galaxy M-8454-12702 does not satisfy to our criterion for the selection of the cSB galaxies. The surface brightness, ΣHα, changes smoothly along the radius without a well defined central peak, panel (a) of Fig. 5. Thus, the behaviour of ΣHα with the radius confirms that the M-8454-12702 is not a galaxy with the central starburst; rather, it is a starburst galaxy. The surface brightness, Σ[OIII]λ5007, also changes smoothly along the radius without a well defined central peak, panel (b) of Fig. 5. It should be noted that the M-8454-12702 is a massive (log(M⋆/M⊙) = 11.229) galaxy.
Figure 6 shows the global star formation rate as a function of the galaxy stellar mass. We estimate the global star formation rate from the Hα luminosity of a galaxy LHα using the calibration relation of Kennicutt (1998), reduced by Brinchmann et al. (2004) for the Kroupa initial mass function (Kroupa 2001):
 (1)
(1)
The Hα luminosity of a galaxy, LHα, was determined as a sum of the Hα luminosities of the spaxels with H II-region-like spectra within the optical radius. The SFR – M⋆ diagram for MaNGA galaxies has been considered by Sánchez et al. (2018, 2022), Cano-Díaz et al. (2019). The SFR – M⋆ relations separate for the star-forming early-type spiral galaxies (which comprises the galaxies of the S0a, Sa, Sab, and Sb morphological types) and late-type (Sbc, Sc, Scd, Sm, and Irr) spirals were suggested in Cano-Díaz et al. (2019). Those relations are shown in Fig. 6 by dashed and solid lines. Speagle et al. (2014) investigated the evolution of the star-forming galaxy of main sequence in the star formation rate – stellar mass diagram using a compilation of 25 studies from the literature. They found the ‘consensus’ relation SFR = f(M⋆, t):
 (2)
(2)
where t is the age of the Universe in Gyr, stellar mass M⋆ is in the solar mass unit, and the SFR is in the solar mass per year. Their SFR – M⋆ relation for the present-day epoch (t = 13.6 Gyr) is shown by the dotted line in Fig. 6. The locations of galaxies of our sample in the SFR – M⋆ diagram are in agreement with the relations from Cano-Díaz et al. (2019) and Speagle et al. (2014). Inspection of Fig. 6 shows that the values of the global star formation rate of cSB galaxies tend to be shifted towards the lower value of the star formation rate for galaxies of a given stellar mass in contrast to the behaviour of the cSB galaxies in the central Hα surface brightness (central star formation rate) – stellar mass diagram in panel (a) of Fig. 4.
Panel (b) of Fig. 4 shows the central surface brightness in the oxygen line, Σ[OIII]λ5007, centre, as a function of the stellar mass for the galaxies with the H II region-like radiation at the centre. Examination of the Σ[OIII]λ5007, centre – M⋆ diagram (panel (b) of Fig. 4) confirms the conclusions derived from the analysis of the ΣHα, centre – M⋆ diagram (panel (a) of Fig. 4).
Panel (c) of Fig. 4 shows central Hα surface brightness ΣHα, centre as a function of the median surface brightness ΣHα, median for the galaxies with the H II region-like radiation at the centre. Inspection of panel (c) of Fig. 4 shows that the cSB galaxies with the SF+INT configuration of the radiation in the circumnuclear regions are located in the upper envelope of the band outlined by the other galaxies in the ΣHα, centre – ΣHα, median diagram. However, such a shift is less evident (if at all present) for the cSB galaxies with the SF configuration of the radiation in the circumnuclear regions. Panel (d) of Fig. 4 shows the central surface brightness in the oxygen line Σ[OIII]λ5007, centre as a function of the median surface brightness, Σ[OIII]λ5007, median, for the galaxies with the H II region-like radiation at the centre. An examination of the Σ[OIII]λ5007, centre – Σ[OIII]λ5007, median diagram results in similar conclusions as in the analysis of the ΣHα, centre – ΣHα, median diagram.
Thus, the above considerations suggest the following properties of a typical cSB galaxy with the H II region-like radiation at the centre. This is a massive, log(M⋆/M⊙)≳ 10.5, well evolved galaxy with the reduced, on average, global current star formation rate compared to galaxies of a given stellar masses. The radial distributions of the Hα surface brightness (star formation rate) shows a well defined central peak. The star formation rate at the centre is comparable to the central star formation rates in other galaxies of a given masses but the excess of the star formation rate at the centre over the median star formation rate across the galaxy is higher than in other galaxies of a given median star formation rate.
The spectra of the spaxels at the centres of the cSB galaxies with the circumnuclear regions of the SF+INT BPT type correspond to the H II region-like type according to the BPT classification. However, those spaxels are of the wAGN (or sAGN in some cases) type, according to the WHaD classification (Figs. B.1–B.3) because of the values of the gas velocity dispersion, σHα, in spaxels exceeding 57 km/s, which is the threshold value for the SF object in the WHaD classification (Sánchez et al. 2024). This suggests that both the SF and AGN-like radiation can make a contributions to the excitation of gas in those spaxels. We consider whether the shift of the central surface brightness in the oxygen line, Σ[OIII]λ5007, centre, towards the upper envelope of the band in the Σ[OIII]λ5007, centre – Σ[OIII]λ5007, median (and ΣHα, centre – ΣHα, median) diagram can be attributed to the contribution of the AGN-like source. Taking into account that the spectrum is of the SF type according to the BPT classification (i.e. object is located below the demarcation line of Kauffmann et al. 2003) when the contribution from SF is greater than half of the total [O III] luminosity (Kauffmann & Heckman 2009); thus, we can expect that the shift caused by the contribution of the AGN-like source is less than 0.3 dex. A close examination of panel (d) of Fig. 4 shows that the total shifts of the central surface brightness in the oxygen line Σ[OIII]λ5007, centre of the cSB galaxies with the circumnuclear regions of the SF+INT BPT type towards the upper envelope of the band in the Σ[OIII]λ5007, centre – Σ[OIII]λ5007, median diagram can be significantly larger than 0.3 dex and, consequently, only a part of the shift (but not the total shift) can be attributed to the contribution of the AGN-like source.
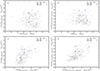 |
Fig. 7. Central sufrace brightness in the Hα and oxygen [O III]λ5007 emission lines in galaxies with the circumnuclear regions of the INT and AGN BPT types. Panel a: Central surface brightness ΣHα, centre as a function of stellar mass of galaxy. The grey circles denote all the galaxies, red plus signs mark the cSB galaxies with the circumnuclear regions of the INT BPT type, and blue crosses show the cSB galaxies with the circumnuclear regions of the AGN BPT type. Panel b: Same as panel (a) but for the oxygen [O III]λ5007 emission line. Panel c: Central surface brightness ΣHα, centre as a function of the median surface brightness ΣHα, median. The designations are the same as in panel (a). Panel d: Same as panel (c) but for the oxygen [O III]λ5007 emission line. |
Figure 7 shows the ΣHα, centre – M⋆ diagram, panel (a), the Σ[OIII]λ5007, centre – M⋆ diagram, panel (b), the ΣHα, centre – ΣHα, median diagram, panel (c), and the Σ[OIII]λ5007, centre – Σ[OIII]λ5007, median diagram, panel (d), for galaxies with the AGN-like and intermediate radiation in the circumnuclear regions. An inspection of Fig. 7 shows that the shift of the central surface brightness in the cSB galaxies towards the higher values is noticeable in the Σ[OIII]λ5007, centre – Σ[OIII]λ5007, median diagram only, as seen in panel (d) of Fig. 7.
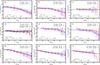 |
Fig. 8. Comparison of the radial distributions of oxygen abundances in the galaxy determined from the independent MaNGA observations of the same galaxy. In each panel, the symbols denote the median values of the O/H in bins of 0.05 in the fractional radius, R/R25, and the bars show the scatter in O/H about the median value in the bins. The lines show the relations we determined for the radial abundance distributions. The horizontal bar indicates the point spread function in the MaNGA measurements. |
The properties of the cSB galaxies with the AGN and INT types of the radiation in circumnuclear regions are somewhat controversial. From one side, the decrease in the Dn(4000) indices (stellar ages) at the centre of such galaxies offers evidence on the central starburst. From another side, the AGN (but not the starburst) is a dominant source of the ionising radiation in the circumnuclear region. This can reveal evidence that the central starburst in such galaxy occurred some time ago and is faded this time; therefore the star radiation makes a small, (and even no) contribution to the ionising radiation in the circumnuclear region.
3.3. Central oxygen abundances in MaNGA galaxies
We have estimated the oxygen abundances in the spaxels with the H II region-like spectra using the R calibration from Pilyugin & Grebel (2016). The radial distributions of the oxygen abundances for individual spaxels in the cSB galaxies are shown by grey points in the panels of column (c) in Figs. A.1–A.5 in the appendix. In order to minimise the influence of the spaxels with unreliable abundances in determining the radial abundance distribution, we did not use the abundances in individual spaxels, but the median values of the abundances in bins of 0.05 in R/R25 (the red circles in the panels of column (c) in Figs. A.1–A.5). The majority of the binned oxygen abundances follow well the general metallicity gradient in the disc. Yet, an appreciable deviation from the general trend can take place in bins near the centre (e.g. panel (c12) in Fig. A.2, panel (c16) in Fig. A.3, and panel (c27) in Fig. A.5), near the isophotal radius of the galaxy (e.g. panel (c3) in Fig. A.1, panel (c12) in Fig. A.2, and panel (c19) in Fig. A.3), and near the transition from the zone of the H II region-like radiation to the zone of the AGN(INT)-like radiation (e.g. panels (c8) and (c9) in Fig. A.2, panel (c30) in Fig. A.5). The deviations of those bins from the general metallicity gradient can be attributed to the uncertainties in the oxygen abundance determinations, and those bins are rejected in the determinations of the radial abundance gradients. The gradients in the galaxies were approximated by a single or broken linear relation (shown by the lines in panels of column (c) in Figs. A.1–A.5 for cSB galaxies) and the central oxygen abundance in a galaxy is estimated as an intersect value of the determined radial abundance distribution.
Two independent MaNGA observations are available for eight galaxies from our total sample and three independent MaNGA observations (M-8274-12703, M-8256-12703, and M-8451-12704) are available for one galaxy. A comparison between values of the central intersect oxygen abundances derived from different observations of the same galaxy provides a possibility to estimate uncertainties in the central intersect oxygen abundances obtained from the MaNGA measurements. Fig. 8 shows the comparison of the radial oxygen abundance distributions determined from independent MaNGA observations of the same galaxy for nine galaxies. The mean value of the central oxygen abundances determined from independent measurements can be considered as ‘true’ central oxygen abundance and the difference between the value of the central abundance determined from the individual observation and the mean value can be considered as the uncertainty in the central oxygen abundance determination from the MaNGA measurements. The uncertainties in the central oxygen abundance determination are within 0.01 dex for seven galaxies and are between 0.01 and 0.02 dex for two galaxies, Fig. 8.
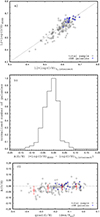 |
Fig. 9. Comparison the central intersect oxygen abundances estimated from the metallicity gradient determined on the base of the IFU spectroscopy from the MaNGA, (O/H)0, intersect, and the local central oxygen abundances obtained from the single-fibre observations from the SDSS, (O/H)SDSS. Panel a: (O/H)SDSS as a function of the (O/H)0, intersect. The grey circles denote all the galaxies, the blue plus signs mark the cSB galaxies, and the line is one-to-one correspodance. Panel b: Normalised histogram of the differences Δ(O/H) = log(O/H)SDSS – log(O/H)0, intersect for our sample of galaxies. Panel c: Difference Δ(O/H) as a function of the gradient slope. The grey circles denote all the galaxies, the red plus signs mark the cSB galaxies, The red circles denote the median values of the ΔO/H in bins of 0.1 in the gradient slope, and the bars show the scatter in the ΔO/H about the median value in the bins. |
The obtained uncertainties in the central oxygen abundance specify the uncertainty (robustness) of the abundances determined through the used calibration rather than the absolute uncertainties. It is known that there are large systematic discrepancies between the abundance values produced by different published calibrations (e.g. see Figure 29 in Sánchez et al. 2022). At the present time there is no commonly accepted absolute scale for metallicities of H II regions. It should be noted that the oxygen abundances determined through the R calibration are compatible to the metallicity scale of H II regions defined by the H II regions with abundances obtained through the direct Te method. All the abundances considered in the current study are obtained using the same calibration what justifies to make conclusion about agreement (disagreement) between them.
It was noted above that if the oxygen abundances in the bins near the centre show the deviations from the general radial abundance gradient then those bins are rejected in the determination of the radial abundance gradient. Belfiore et al. (2017) noted that the observed metallicities in the spaxels near the centre of a galaxy can be affected by the ‘beam-smearing’ effect of the point spread function (PSF). The point spread function of the MaNGA measurements is estimated to have a full width at half maximum of 2.5 arcsec or five pixels (Bundy et al. 2015; Belfiore et al. 2017). For low R25/PSF ratios and high galaxy inclinations, the error in the oxygen abundance at the centre of a galaxy can be as large as ∼0.04 dex. On the other hand, it cannot be excluded that the deviation of the central oxygen abundance from the general radial gradient can be real under some conditions. An appreciable episode of star formation occurred at the present-day or at the recent past in the centres of the cSB galaxies. If a starburst alters the (local) oxygen abundance at the centre of spiral galaxy, then the intersect oxygen abundance does not correspond to the real central abundance in the cSB galaxy.
The consideration of the alternative classification of the spaxel spectra using the WHaD diagram of Sánchez et al. (2024) can shed light on the origin of the deviation of the spaxels from the general gradient. The radial distributions of the oxygen abundances for individual spaxels in the cSB galaxies are shown by grey points in the panels of column (c) in Figs. A.1–A.5. The spaxels which show the H II region-like spectra according to the BPT classification but not locate in the SF area in the WHaD diagram (for the brevity sake we refer to those spectra as non-confirmed H II region-like spectra) are marked by green plus signs. Examination of panels of column (c) in Figs. A.1–A.5 shows that the binned oxygen abundance deviates from the general gradient if the bin involves spaxels with non-confirmed H II region-like spectra. This justifies the rejection of the binned oxygen abundances with large deviations in the determination of the radial abundance gradient in the galaxy.
However, not all the spaxels with the non-confirmed H II region-like spectra demonstrate deviations from the general metallicity gradient (panels of column (c) in Figs. A.1–A.5). The following fact should also be noted, namely, if the deviation of abundance in the spaxel with the non-confirmed H II region-like spectrum from the general metallicity gradient is caused by the contribution of the AGN-like radiation to the ionisation then we can expect the maximum deviations of the abundances in the spaxels at the centre of the galaxy. It is not the case for some galaxies. For example, in the galaxy M-8569-12701, the maximum deviations of the oxygen abundances from the general trend show the spaxels at radii 0.2 ≲R/R25≲ 0.3, while the oxygen abundances in the spaxels at R/R25 ≲ 0.2 are close to the general trend (panel (c08) in Fig. A.2). Similarly, in the galaxy M-8724-12701, the maximum deviations of the oxygen abundances from the general trend show the spaxels at radii 0.1 ≲R/R25≲ 0.2, while the oxygen abundances in the spaxels at R/R25≲ 0.1 are close to the general trend (panel (c09) in Fig. A.2). Thus, the use of the WHaD classification in addition to the BPT classification allows us to reject the spaxels with suspicious abundances (with a deviations from the general radial metallicity gradient). However, we cannot exclude that a fraction of the spaxels with a realistic abundances is also rejected in this way. It should be emphasised that the spectra at the centres of the cSB galaxies with the circumnuclear regions of the SF BPT type are H II region-like accoording of both the BPT and the WHaD classifications, and the spectra at the centres of the cSB galaxies with the circumnuclear regions of the AGN BPT type are AGN-like type accoording of both the BPT and WHaD classifications (Figs. B.1–B.3). The non-confirmed H II region-like spectra appear at the centres of the cSB galaxies with the circumnuclear regions of the SF+INT BPT type only.
A single-fibre spectroscopy of centres in a large amount of galaxies (including the MaNGA galaxies) was carried out within the Sloan Digital Sky Survey (SDSS, York et al. 2000). This provides an independent estimation of the oxygen abundances. The comparison between two independent estimations of the oxygen abundance (the intersect values of the central abundances based on the MaNGA measurements and oxygen abundances estimated from the SDSS measurements) can tell us something about the validity of the obtained central abundances in MaNGA galaxies and about the agreement of the oxygen abundance at the centre of spiral galaxy with the general radial metallicity gradient. The H II region-like SDSS spectra with measurements of all the emission lines necessary for the oxygen abundance determination are available for the centres of 166 galaxies of our sample. The emission line measurements were taken from the table titled ‘galSpecLine6’. The SDSS-based oxygen abundances were estimated using the R calibration from Pilyugin & Grebel (2016).
Panel (a) of Fig. 9 shows the comparison between the central intersect oxygen abundances estimated from the metallicity gradient determined on the base of the IFU spectroscopy from the MaNGA, (O/H)0, intersect, and the local central oxygen abundances obtained from the single-fibre observations from the SDSS, (O/H)SDSS. Panel (b) of Fig. 9 shows the normalised histogram of differences Δ(O/H) = log(O/H)SDSS – log(O/H)0, intersect for our sample of galaxies. The uncertainty of the oxygen abundance estimated through the R calibration from the individual measurement is within ∼0.1 dex (Pilyugin & Grebel 2016). The uncertainties in the central intersect oxygen abundance determinations are within ∼0.02 dex, Fig. 8. Inspection of panel (a) and (b) of Fig. 9 shows the differences Δ(O/H) are within those uncertainties. However, the differences are not perfectly random, there is some excess of the negative values of the differences (the (O/H)SDSS is lower than (O/H)0, intersect).
We can assume that this asymmetry in the Δ(O/H) distribution can be caused by the aperture effect. The SDSS spectra are obtained through 3-arcsec-diameter fibres. The angular diameters of the bulk of the MaNGA galaxies of our sample lie within the diapason from 20 to 30 arcseconds. The SDSS fibre covers up to 10-15% of the galaxy radius (for the face-on case). The SDSS fibre spectrum involves not only the radiation from the very centre but also the radiation of the circumnuclear region of radius of 0.1–0.15R25. For a galaxy with a steep abundance gradient, the oxygen abundance estimated from the SDSS fibre spectrum will be lower than the oxygen abundance at the centre of the galaxy. If this is the case then the negative values of the Δ(O/H) should be found in galaxies with the steep abundance gradients. Panel (c) of Fig. 9 shows the Δ(O/H) as a function of the slope of the radial oxygen abundance gradient in the galaxy. Close examination of panel (c) of Fig. 9 shows that the Δ(O/H) value correlates with the slope of the gradient in the galaxy, the median value of the Δ(O/H) changes from −0.004 dex for galaxies of the gradients in the diapason from −0.1 to 0.0 dex/R25 to −0.036 dex for galaxies of the gradients in the diapason from −0.4 to −0.3 dex/R25. Thus, the asymmetry in the Δ(O/H) distribution can be attributed to the aperture effect.
The locations of the cSB galaxies in the Δ(O/H) – M⋆ diagram (panel (a) of Fig. 9) and in the Δ(O/H) – grad(O/H) diagram (panel (c) of Fig. 9) are marked by the blue plus signs. The median value of Δ(O/H) for the cSB galaxies is 0.006 dex. Thus, the median value of the deviations of the local central abundance from the general metallicity gradient in the cSB galaxies is negligibly small, within the uncertainties in the intersect oxygen abundance determinations.
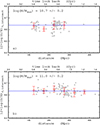 |
Fig. 10. Central intersect oxygen abundance (O/H)0, intersect as a function of the distance (look back time). Panel a: Central intersect oxygen abundance as a function of the distance (look back time) for galaxies with masses 10.5 < log(M⋆/M⊙) < 10.9. The grey circles denote the abundances in individual galaxies, the red circles mark the median values of the abundances for galaxies in bins of 50 Mpc in the distance, and the bars show the scatter in the abundances about the median value in the bins. The line is the median value of abundances for all galaxies from this mass interval. Panel b: The same as panel (a) but for galaxies with masses 10.9 < log(M⋆/M⊙) < 11.3. |
The negligibly small local enrichment of the centres of the cSB galaxies in oxygen by the starbursts can be indirectly verified by the following consideration. The distances to galaxies in our sample lie in the diapason from ∼120 Mpc to ∼350 Mpc, depending on the value of stellar mass. This provides a possibility to estimate the enrichment in oxygen at the centres of galaxies for 0.5 – 0.8 Gyr. Figure 10 shows the central oxygen abundance (O/H)0, intersect as a function of the distance (look back time) for galaxies of the masses from two intervals of stellar masses. The grey circles in each panel of Fig. 10 denote the abundances in individual galaxies, the red circles mark the median values of the abundances for galaxies in the distance bins of 50 Mpc. The line is the median value of abundances for all galaxies from this mass interval. An inspection of Fig. 10 shows that there is no a systematic variation of the oxygen abundance in massive galaxies for 0.5 – 0.8 Gyr. This means that the contribution of the star formation at the current epoch in the centres of massive galaxies to the oxygen enrichment is negligibly low. This is in agreement with the conclusion obtained from the analysis of the N/O – O/H diagram for a sample of well measured MaNGA galaxies (Pilyugin & Tautvaišienė 2024).
The chemical enrichment history of galaxies of different masses were investigated using two strategies. First, the oxygen abundance evolution with redshift of the galaxies has been considered (e.g. Thuan et al. 2010; Moustakas et al. 2011; Pilyugin & Thuan 2011; Rodrigues et al. 2016). Second, the chemical enrichment history in the galaxy (or in a region of the galaxy) can be determined through the fitting of the observed spectrum by the spectra of a set of simple stellar populations of different ages and metallicities. Using this approach, the chemical enrichment histories were determined in the CALIFA (the Calar Alto Legacy Integral Field Area (CALIFA) survey, Sánchez et al. 2012, 2016; García-Benito et al. 2015) galaxies (Camps-Fariña et al. 2021), and in the MaNGA galaxies (Camps-Fariña et al. 2022). It has been found in all those studies that there is no an appreciable oxygen enrichment in the centres of massive galaxies (log M⋆/M⊙≳ 10.5) for last ∼3 Gyrs. Our conclusion is in line with this result.
Thus, the central intersect oxygen abundances estimated from the metallicity gradient determined on a base of the IFU spectroscopy from the MaNGA and the local central oxygen abundances obtained from the single-fibre observations from the SDSS agrees within uncertainties for our sample of galaxies. In particular, the deviations of the local central abundance from the general metallicity gradient in the cSB galaxies are negligible small, if any. A contribution of the current starbursts in the centres of massive galaxies to the oxygen enrichment is low.
4. Conclusions
We examined whether there are deviations of the local central oxygen abundance in spiral galaxies from the general metallicity gradient giving a special attention to the galaxies with central starbursts. We have constructed the maps and radial distributions of different characteristics in a sample of 381 MaNGA galaxies using the publicly available spectral measurements. We also selected a sample of 30 galaxies with central starbursts (cSB galaxies) among galaxies of our sample. The decrease in the Dn(4000) index (indicator of the stellar age) in the circumnuclear region is used as the criterion to select the cSB galaxies.
The oxygen abundances in the spaxels with the H II region-like spectra according to the standard BPT classification were estimated using the R calibration from Pilyugin & Grebel (2016). The radial distribution of binned oxygen abundances (the median values of the abundances in bins of 0.05 dex in R/R25) was approximated by the single or broken linear relation and the central intersect oxygen abundance was determined. The bins that show a deviation from the general metallicity gradients (in particular, the bins near the centre of the galaxy) were rejected in the gradient determinations. Those bins involve the spaxels whose spectra are H II region-like according to the standard BPT classification but do not locate in the area of the SF regions in the WHaD diagram, an alternative classification suggested recently by Sánchez et al. (2024) We estimated the local central oxygen abundances in 166 galaxies of our sample using the single-fibre spectral observations from the SDSS. We found that the central intersect abundances estimated from the metallicity gradient determined on the base of the IFU spectroscopy from the MaNGA and the local central abundances obtained from the single-fibre observations from the SDSS agree within uncertainties for our sample of galaxies. In particular, the deviations of the local central abundance from the general metallicity gradient in the cSB galaxies are negligibly small, if any.
The central sturburst implies that an appreciable amount of gas presents at the centre of galaxy. The gas at the centre of galaxy can serve not only as the raw material for the star formation, but also as the fuel to the active galactic nucleus (AGN). We found that the AGN is the main source of the ionising radiation in the circumnuclear regions of six cSB galaxies.
The cSB galaxies of our sample with the H II region-like radiation at the centre show the following properties: the cSB galaxy is a massive, log(M⋆/M⊙)≳ 10.5, well evolved galaxy with reduced (on average) global current star formation rate in comparison to galaxies of similar stellar masses. The radial distribution of the Hα surface brightness shows a well defined central peak. Part of the central surface brightness enhancement can be attributed to the contribution of the AGN-like source but the star formation is the main sourse of the ionising radiation. The star formation rate at the centre of cSB galaxy is comparable to the central star formation rates in other galaxies of a given masses, but the excess of the star formation rate at the centre over the median star formation rate across the galaxy is higher than in other galaxies due to the reduced global star formation rates in the cSB galaxies. The contribution of the current starburst in the centre of cSB galaxy to the oxygen enrichment is negligibly small.
The properties of the cSB galaxies with the AGN (and INT) types of the radiation in circumnuclear regions are somewthat controversial. From one side, the decrease in the Dn(4000) indices at the centre of such galaxy offers evidence on the central starburst. From the other side, the AGN is the main source of the ionising radiation in the circumnuclear region. This may serve as evidence that the central starburst in such galaxy is on the faded stage (or has ended) and therefore the star radiation makes a small (if any at all) contribution to the ionising radiation in the circumnuclear region.
There is no any distinctive link of the central starburst in the galaxy to its present-day environment or to the presence of the bar. This suggests that either there is another reason responsible for the central starburst or that the central starbursts are not uniform in their origin and may instead originate from different pathways.
The NASA/IPAC Extragalactic Database (NED) is operated by the Jet Populsion Laboratory, California Institute of Technology, under contract with the National Aeronautics and Space Administration. http://ned.ipac.caltech.edu/
Acknowledgments
We are grateful to the anonymous referee for his/her constructive comments. L.S.P acknowledges support from the Research Council of Lithuania (LMTLT) (grant no. P-LU-PAR-23-28). This research has made use of the NASA/IPAC Extragalactic Database (NED), which is funded by the National Aeronautics and Space Administration and operated by the California Institute of Technology. We acknowledge the usage of the HyperLeda database (http://leda.univ-lyon1.fr). Funding for SDSS-III has been provided by the Alfred P. Sloan Foundation, the Participating Institutions, the National Science Foundation, and the U.S. Department of Energy Office of Science. The SDSS-III web site is http://www.sdss3.org/. Funding for the Sloan Digital Sky Survey IV has been provided by the Alfred P. Sloan Foundation, the U.S. Department of Energy Office of Science, and the Participating Institutions. SDSS-IV acknowledges support and resources from the Center for High-Performance Computing at the University of Utah. The SDSS web site is www.sdss.org. SDSS-IV is managed by the Astrophysical Research Consortium for the Participating Institutions of the SDSS Collaboration including the Brazilian Participation Group, the Carnegie Institution for Science, Carnegie Mellon University, the Chilean Participation Group, the French Participation Group, Harvard-Smithsonian Center for Astrophysics, Instituto de Astrofísica de Canarias, The Johns Hopkins University, Kavli Institute for the Physics and Mathematics of the Universe (IPMU) / University of Tokyo, Lawrence Berkeley National Laboratory, Leibniz Institut für Astrophysik Potsdam (AIP), Max-Planck-Institut für Astronomie (MPIA Heidelberg), Max-Planck-Institut für Astrophysik (MPA Garching), Max-Planck-Institut für Extraterrestrische Physik (MPE), National Astronomical Observatories of China, New Mexico State University, New York University, University of Notre Dame, Observatário Nacional/MCTI, The Ohio State University, Pennsylvania State University, Shanghai Astronomical Observatory, United Kingdom Participation Group, Universidad Nacional Autónoma de México, University of Arizona, University of Colorado Boulder, University of Oxford, University of Portsmouth, University of Utah, University of Virginia, University of Washington, University of Wisconsin, Vanderbilt University, and Yale University.
References
- Abdurro’uf, Accetta, K., Aerts, C., et al. 2022, ApJS, 259, 35 [NASA ADS] [CrossRef] [Google Scholar]
- Alvarez-Hurtado, P., Barrera-Ballesteros, J. K., Sánchez, S. F., et al. 2022, ApJ, 929, 47 [NASA ADS] [CrossRef] [Google Scholar]
- Baldwin, J. A., Phillips, M. M., & Terlevich, R. 1981, PASP, 93, 5 [Google Scholar]
- Barrera-Ballesteros, J. K., Sánchez, S. F., García-Lorenzo, B., et al. 2015, A&A, 579, A45 [NASA ADS] [CrossRef] [EDP Sciences] [Google Scholar]
- Belfiore, F., Maiolino, R., Maraston, C., et al. 2016, MNRAS, 461, 3111 [Google Scholar]
- Belfiore, F., Maiolino, R., Tremonti, C., et al. 2017, MNRAS, 469, 151 [Google Scholar]
- Brinchmann, J., Charlot, S., White, S. D. M., et al. 2004, MNRAS, 351, 1151 [Google Scholar]
- Bruzual, G., & Charlot, S. 2003, MNRAS, 344, 1000 [NASA ADS] [CrossRef] [Google Scholar]
- Bundy, K., Bershady, M. A., Law, D. R., et al. 2015, ApJ, 798, 7 [Google Scholar]
- Camps-Fariña, A., Sánchez, S. F., Lacerda, E. A. D., Carigi, L., García-Benito, R., Mast, D., & Galbany, L. 2021, MNRAS, 504, 3478 [CrossRef] [Google Scholar]
- Camps-Fariña, A., Sánchez, S. F., Mejía-Narváez, A., et al. 2022, ApJ, 933, 44 [CrossRef] [Google Scholar]
- Cano-Díaz, M., Ávila-Reese, V., Sánchez, S. F., et al. 2019, MNRAS, 488, 3929 [Google Scholar]
- Chen, Y.-M., Kauffmann, G., Tremonti, C. A., et al. 2012, MNRAS, 421, 314 [NASA ADS] [Google Scholar]
- Cid, Fernandes R., Stasińska, G., Schlickmann, M. S., et al. 2010, MNRAS, 403, 1036 [NASA ADS] [CrossRef] [Google Scholar]
- Cid, Fernandes R., Stasińska, G., Mateus, A., & Vale, Asari N. 2011, MNRAS, 413, 1687 [NASA ADS] [CrossRef] [Google Scholar]
- Curti, M., Mannucci, F., Cresci, G., & Maiolino, R. 2020, MNRAS, 491, 944 [Google Scholar]
- D’Agostino, J. J., Kewley, L. J., Groves, B. A., et al. 2019, MNRAS, 485, L38 [CrossRef] [Google Scholar]
- Davies, R. L., Rich, J. A., Kewley, L. J., & Dopita, M. A. 2014a, MNRAS, 439, 3835 [Google Scholar]
- Davies, R. L., Kewley, L. J., Ho, I.-T., & Dopita, M. A. 2014b, MNRAS, 444, 3961 [NASA ADS] [CrossRef] [Google Scholar]
- Davies, R. L., Groves, B., Kewley, L. J., et al. 2016, MNRAS, 462, 1616 [NASA ADS] [CrossRef] [Google Scholar]
- Dawson, K. S., Schlegel, D. J., Ahn, C. P., et al. 2013, AJ, 145, 10 [Google Scholar]
- Epinat, B., Amram, P., Marcelin, M., et al. 2008, MNRAS, 388, 500 [Google Scholar]
- García-Benito, R., Zibetti, S., Sánchez, S. F., et al. 2015, A&A, 576, A135 [Google Scholar]
- Garnett, D. R. 2002, ApJ, 581, 1019 [NASA ADS] [CrossRef] [Google Scholar]
- Garnett, D. R., & Shields, G. A. 1987, ApJ, 317, 82 [NASA ADS] [CrossRef] [Google Scholar]
- Guo, R., Hao, C.-N., Xia, X.-Y., Wei, P., & Guo, X. 2016, Res. Astron. Astrophys., 16, 113 [Google Scholar]
- Heckman, T. M., & Best, P. N. 2014, ARA&A, 52, 589 [Google Scholar]
- Herpich, F., Mateus, A., Stasińska, G., Cid, Fernandes R., & Vale, Asari N. 2016, MNRAS, 462, 1826 [NASA ADS] [CrossRef] [Google Scholar]
- Hviding, R. E., Brammer, G. B., Momcheva, I. G., et al. 2018, ApJ, 868, 16 [NASA ADS] [CrossRef] [Google Scholar]
- Johnston, V. D., Medling, A. M., Groves, B., et al. 2023, ApJ, 954, 77 [NASA ADS] [CrossRef] [Google Scholar]
- Kauffmann, G., & Heckman, T. M. 2009, MNRAS, 397, 135 [NASA ADS] [CrossRef] [Google Scholar]
- Kauffmann, G., Heckman, T. M., Tremonti, C., et al. 2003, MNRAS, 346, 1055 [Google Scholar]
- Kennicutt, R. C. 1998, ARA&A, 36, 189 [NASA ADS] [CrossRef] [Google Scholar]
- Kewley, L. J., Dopita, M. A., Sutherland, R. S., Heisler, C. A., & Trevena, J. 2001, ApJ, 556, 121 [Google Scholar]
- Kroupa, P. 2001, MNRAS, 322, 231 [NASA ADS] [CrossRef] [Google Scholar]
- Lacerda, E. A. D., Cid, Fernandes R., Couto, G. S., et al. 2018, MNRAS, 474, 3727 [NASA ADS] [CrossRef] [Google Scholar]
- Lynden-Bell, D. 1969, Nature, 223, 690 [NASA ADS] [CrossRef] [Google Scholar]
- Makarov, D., Prugniel, P., Terekhova, N., Courtois, H., & Vauglin, I. 2014, A&A, 570, A13 [NASA ADS] [CrossRef] [EDP Sciences] [Google Scholar]
- Moustakas, J., Zaritsky, D., Brown, M., et al. 2011, ApJ, submitted [arXiv:1112.3300] [Google Scholar]
- Parkash, V., Brown, M. J. I., Jarrett, T. H., Fraser-McKelvie, A., & Cluver, M. E. 2019, MNRAS, 485, 3169 [NASA ADS] [CrossRef] [Google Scholar]
- Pilyugin, L. S., & Grebel, E. K. 2016, MNRAS, 457, 3678 [NASA ADS] [CrossRef] [Google Scholar]
- Pilyugin, L. S., & Tautvaišienė, G. 2024, A&A, 682, A41 [NASA ADS] [CrossRef] [EDP Sciences] [Google Scholar]
- Pilyugin, L. S., & Thuan, T. X. 2011, ApJ, 726, L23 [NASA ADS] [CrossRef] [Google Scholar]
- Pilyugin, L. S., Vílchez, J. M., & Contini, T. 2004, A&A, 425, 849 [NASA ADS] [CrossRef] [EDP Sciences] [Google Scholar]
- Pilyugin, L. S., Grebel, E. K., & Kniazev, A. Y. 2014, AJ, 147, 131 [NASA ADS] [CrossRef] [Google Scholar]
- Pilyugin, L. S., Grebel, E. K., Zinchenko, I. A., et al. 2018, A&A, 613, A1 [NASA ADS] [CrossRef] [EDP Sciences] [Google Scholar]
- Pilyugin, L. S., Grebel, E. K., Zinchenko, I. A., Nefedyev, Y. A., & Vílchez, J. M. 2019, A&A, 623, A122 [NASA ADS] [CrossRef] [EDP Sciences] [Google Scholar]
- Pilyugin, L. S., Grebel, E. K., Zinchenko, I. A., et al. 2020, A&A, 639, A96 [NASA ADS] [CrossRef] [EDP Sciences] [Google Scholar]
- Pilyugin, L. S., Cedrés, B., Zinchenko, I. A., et al. 2021, A&A, 653, A11 [NASA ADS] [CrossRef] [EDP Sciences] [Google Scholar]
- Pons, E., & Watson, M. G. 2014, A&A, 568, A108 [NASA ADS] [CrossRef] [EDP Sciences] [Google Scholar]
- Pons, E., & Watson, M. G. 2016, A&A, 594, A72 [NASA ADS] [CrossRef] [EDP Sciences] [Google Scholar]
- Rodrigues, M., Foster, C., Taylor, E. N., et al. 2016, A&A, 590, A18 [NASA ADS] [CrossRef] [EDP Sciences] [Google Scholar]
- Salpeter, E. E. 1964, ApJ, 140, 796 [NASA ADS] [CrossRef] [Google Scholar]
- Sánchez, S. F. 2020, ARA&A, 58, 99 [Google Scholar]
- Sánchez, S. F., Kennicutt, R. C., Gil de Paz, A., et al. 2012, A&A, 538, A8 [Google Scholar]
- Sánchez, S. F., Rosales-Ortega, F. F., Jungwiert, B., et al. 2013, A&A, 554, A58 [NASA ADS] [CrossRef] [EDP Sciences] [Google Scholar]
- Sánchez, S. F., Rosales-Ortega, F. F., Iglesias-Páramo, J., et al. 2014, A&A, 563, A49 [CrossRef] [EDP Sciences] [Google Scholar]
- Sánchez, S. F., García-Benito, R., Zibetti, S., et al. 2016, A&A, 594, A36 [Google Scholar]
- Sánchez, S. F., Avila-Reese, V., Hernandez-Toledo, H., et al. 2018, Rev. Mex. Astron. Astrofis., 54, 217 [Google Scholar]
- Sánchez, S. F., Barrera-Ballesteros, J. K., López-Cobá, C., et al. 2019, MNRAS, 484, 3042 [CrossRef] [Google Scholar]
- Sánchez, S. F., Walcher, C. J., Lopez-Cobá, C., et al. 2021, Rev. Mex. Astron. Astrofis., 57, 3 [Google Scholar]
- Sánchez, S. F., Barrera-Ballesteros, J. K., Lacerda, E., et al. 2022, ApJS, 262, 36 [CrossRef] [Google Scholar]
- Sánchez, S. F., Lugo-Aranda, A. Z., Sánchez, Almeida J., et al. 2024, A&A, 682, A71 [NASA ADS] [CrossRef] [EDP Sciences] [Google Scholar]
- Sánchez-Menguiano, L., Sánchez, Almeida J., Sánchez, S. F., & Muñoz-Tuñón, C. 2024, A&A, 681, A121 [NASA ADS] [CrossRef] [EDP Sciences] [Google Scholar]
- Sarzi, M., Shields, J. C., Schawinski, K., et al. 2010, MNRAS, 402, 2187 [Google Scholar]
- Searle, L. 1971, ApJ, 168, 327 [Google Scholar]
- Singh, R., van de Ven, G., Jahnke, K., et al. 2013, A&A, 558, A43 [NASA ADS] [CrossRef] [EDP Sciences] [Google Scholar]
- Smith, H. E. 1975, ApJ, 199, 591 [NASA ADS] [CrossRef] [Google Scholar]
- Speagle, J. S., Steinhardt, C. L., Capak, P. L., & Silverman, J. D. 2014, ApJS, 214, 15 [Google Scholar]
- Stasińska, G., Cid Fernandes, R., Mateus, A., Sodré, L., & Asari, N. V. 2006, MNRAS, 371, 972 [Google Scholar]
- Stasińska, G., Vale, Asari N., Cid, Fernandes R., et al. 2008, MNRAS, 391, L29 [Google Scholar]
- Tempel, E., Kruuse, M., Kipper, R., et al. 2018, A&A, 618, A81 [NASA ADS] [CrossRef] [EDP Sciences] [Google Scholar]
- Thorp, M. D., Ellison, S. L., Simard, L., Sánchez, S. F., & Antonio, B. 2019, MNRAS, 482, L55 [Google Scholar]
- Thuan, T. X., Pilyugin, L. S., & Zinchenko, I. A. 2010, ApJ, 712, 1029 [NASA ADS] [CrossRef] [Google Scholar]
- Tremonti, C. A., Heckman, T. M., Kauffmann, G., et al. 2004, ApJ, 613, 898 [Google Scholar]
- Vila-Costas, M. B., & Edmunds, M. G. 1992, MNRAS, 259, 121 [NASA ADS] [CrossRef] [Google Scholar]
- Yan, R., & Blanton, M. R. 2012, ApJ, 747, 61 [NASA ADS] [CrossRef] [Google Scholar]
- York, D. G., Adelman, J., Anderson, J. E., Jr, et al. 2000, AJ, 120, 1579 [Google Scholar]
- Zaritsky, D., Kennicutt, R. C., Jr, & Huchra, J. P. 1994, ApJ, 420, 87 [NASA ADS] [CrossRef] [Google Scholar]
- Zel’dovich, Y. B. 1964, Sov. Phys. Dokl., 9, 195 [NASA ADS] [Google Scholar]
All Tables
General characteristics of our sample of the MaNGA galaxies with central starbursts (cSB galaxies)
All Figures
|
Fig. 1. Examples of different behaviour of the Dn(4000) indices along the galactic radius. Panel a: M-10215-12705, an example of galaxy with the increasing Dn(4000) towards the centre at the central region. Panels b,c: M-9500-12702 (panel a) and M-8335-12701 (panel b), examples of galaxies where the Dn(4000) at the central region increases up to some radius and then decreases towards the centre. Panel d: M-8454-12702, an example of the galaxy with a small variation in the values of Dn(4000) indices along the radius. In each panel, the grey points denote Dn(4000) indices in the individual spaxels, the red circles mark the median values of the Dn(4000) in bins of 0.05 in the fractional radius R/R25, the bars show a scatter in Dn(4000) about the median value in the bins, and the red dashed line shows the median value of the Dn(4000) indices in all spaxels within the optical radius. The horizontal bar indicates the point spread function in the MaNGA measurements. |
| In the text | |
|
Fig. 2. Example of BPT diagrams for the individual spaxels in a galaxy. The individual spaxels with the H II-region-like spectra are denoted by the blue symbols, the spaxels with AGN-like spectra are shown by the dark symbols, and the red symbols are the spaxels with intermediate spectra. The solid and short-dashed curves mark the demarcation line between AGNs and H II regions defined by Kauffmann et al. (2003) and Kewley et al. (2001), respectively. The long-dashed line is the dividing line between Seyfert galaxies and LINERs defined by Cid et al. (2010). |
| In the text | |
|
Fig. 3. Four configurations of the distribution of spaxels with spectra of different BPT types in the circumnuclear regions of cSB galaxies. The BPT radiation types for individual spaxels are colour-coded. The yellow circle shows the kinematic centre of the galaxy, the line indicates a position of the major kinematic axis of the galaxy, and the ellipse is the optical radius. |
| In the text | |
|
Fig. 4. Central sufrace brightness of Hα and oxygen [O III]λ5007 emission lines in galaxies with the circumnuclear regions of the SF and SF+INT BPT types. Panel a: Central surface brightness ΣHα, centre as a function of galaxy’s stellar mass. The grey circles denote all the galaxies, the red plus signs mark the cSB galaxies with the circumnuclear regions of the SF BPT type, and blue crosses show the cSB galaxies with the circumnuclear regions of the SF+INT BPT type. The green square is the MaNGA galaxy M-8454-12702. Panel b: Same as panel (a) but for the oxygen [O III]λ5007 emission line. Panel c: Central surface brightness ΣHα, centre as a function of the median surface brightness ΣHα, median. The designations are the same as in panel (a). Panel d: Same as panel (c) but for the oxygen [O III]λ5007 emission line. |
| In the text | |
|
Fig. 5. Radial disributions of the sufrace brightness in the Hα and oxygen [O III]λ5007 emission lines and Dn(4000) index in the MaNGA galaxy M-8454-12702. Panel a: Surface brightness ΣHα as a function of radius. The blue symbols denote the spaxels with the H II region-like spectra, dark symbols mark the spaxels with the AGN-like spectra, and the red symbols are the spaxels with the intermediate spectra. The golden dashed line shows the median value ΣHα, median of the surface brightness in the spaxels with the optical radius of the galaxy. Panel b: Same as panel (a) but for the oxygen [O III]λ5007 emission line. Panel c: Dn(4000) index as a function of radius. The grey points denote Dn(4000) indeces in the individual spaxels, red circles mark the median values of the Dn(4000) in bins of 0.05 in the fractional radius R/R25, bars show the scatter in the Dn(4000) about the median value in the bins, and the blue dashed line shows the median value of the Dn(4000) in all the spaxels within optical radius. |
| In the text | |
|
Fig. 6. Star formation rate as a function of the stellar mass of the galaxy. The grey circles denote all the galaxies, blue plus signs mark the cSB galaxies with the circumnuclear regions of the SF BPT type, blue crosses show the cSB galaxies with the circumnuclear regions of the SF+INT BPT type, red plus signs are the cSB galaxies with the circumnuclear regions of the INT BPT type, and red crosses show the cSB galaxies with the circumnuclear regions of the AGN BPT type. The green square is the MaNGA galaxy M-8454-12702. The SFR – M⋆ relations for the MaNGA galaxies obtained by Cano-Díaz et al. (2019) are shown by the dashed line for the early-type spirals and by the solid line for the late-type spirals. The dotted line denotes the SFR – M⋆ relation for the present-day epoch from Speagle et al. (2014). |
| In the text | |
|
Fig. 7. Central sufrace brightness in the Hα and oxygen [O III]λ5007 emission lines in galaxies with the circumnuclear regions of the INT and AGN BPT types. Panel a: Central surface brightness ΣHα, centre as a function of stellar mass of galaxy. The grey circles denote all the galaxies, red plus signs mark the cSB galaxies with the circumnuclear regions of the INT BPT type, and blue crosses show the cSB galaxies with the circumnuclear regions of the AGN BPT type. Panel b: Same as panel (a) but for the oxygen [O III]λ5007 emission line. Panel c: Central surface brightness ΣHα, centre as a function of the median surface brightness ΣHα, median. The designations are the same as in panel (a). Panel d: Same as panel (c) but for the oxygen [O III]λ5007 emission line. |
| In the text | |
|
Fig. 8. Comparison of the radial distributions of oxygen abundances in the galaxy determined from the independent MaNGA observations of the same galaxy. In each panel, the symbols denote the median values of the O/H in bins of 0.05 in the fractional radius, R/R25, and the bars show the scatter in O/H about the median value in the bins. The lines show the relations we determined for the radial abundance distributions. The horizontal bar indicates the point spread function in the MaNGA measurements. |
| In the text | |
|
Fig. 9. Comparison the central intersect oxygen abundances estimated from the metallicity gradient determined on the base of the IFU spectroscopy from the MaNGA, (O/H)0, intersect, and the local central oxygen abundances obtained from the single-fibre observations from the SDSS, (O/H)SDSS. Panel a: (O/H)SDSS as a function of the (O/H)0, intersect. The grey circles denote all the galaxies, the blue plus signs mark the cSB galaxies, and the line is one-to-one correspodance. Panel b: Normalised histogram of the differences Δ(O/H) = log(O/H)SDSS – log(O/H)0, intersect for our sample of galaxies. Panel c: Difference Δ(O/H) as a function of the gradient slope. The grey circles denote all the galaxies, the red plus signs mark the cSB galaxies, The red circles denote the median values of the ΔO/H in bins of 0.1 in the gradient slope, and the bars show the scatter in the ΔO/H about the median value in the bins. |
| In the text | |
|
Fig. 10. Central intersect oxygen abundance (O/H)0, intersect as a function of the distance (look back time). Panel a: Central intersect oxygen abundance as a function of the distance (look back time) for galaxies with masses 10.5 < log(M⋆/M⊙) < 10.9. The grey circles denote the abundances in individual galaxies, the red circles mark the median values of the abundances for galaxies in bins of 50 Mpc in the distance, and the bars show the scatter in the abundances about the median value in the bins. The line is the median value of abundances for all galaxies from this mass interval. Panel b: The same as panel (a) but for galaxies with masses 10.9 < log(M⋆/M⊙) < 11.3. |
| In the text | |
Current usage metrics show cumulative count of Article Views (full-text article views including HTML views, PDF and ePub downloads, according to the available data) and Abstracts Views on Vision4Press platform.
Data correspond to usage on the plateform after 2015. The current usage metrics is available 48-96 hours after online publication and is updated daily on week days.
Initial download of the metrics may take a while.