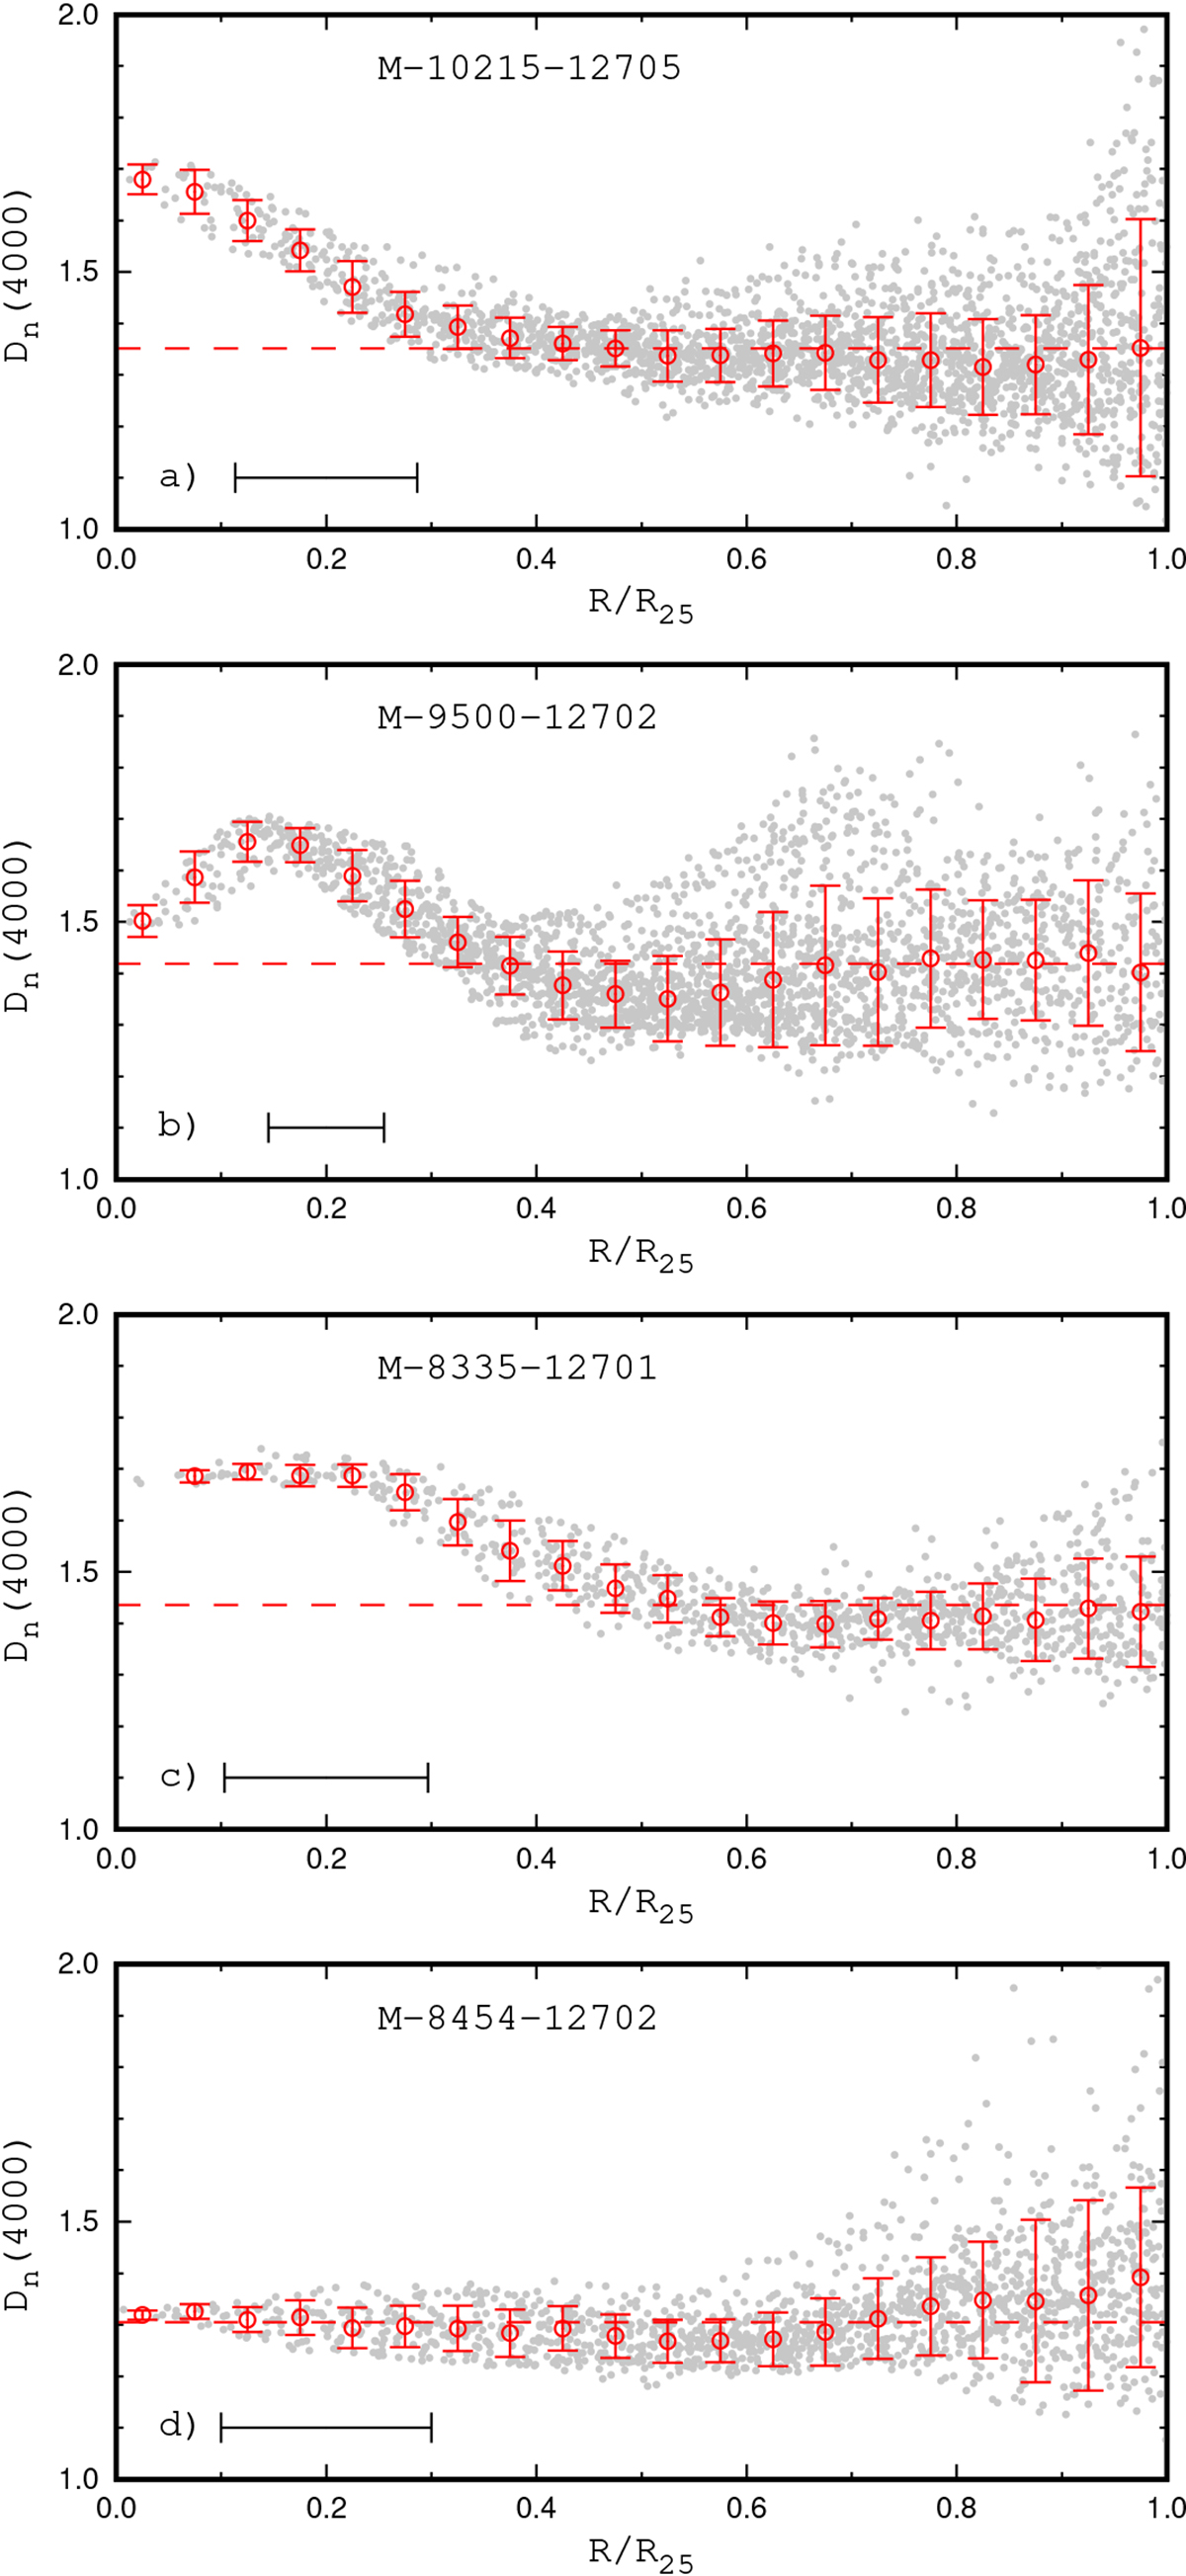
Fig. 1.
Download original image
Examples of different behaviour of the Dn(4000) indices along the galactic radius. Panel a: M-10215-12705, an example of galaxy with the increasing Dn(4000) towards the centre at the central region. Panels b,c: M-9500-12702 (panel a) and M-8335-12701 (panel b), examples of galaxies where the Dn(4000) at the central region increases up to some radius and then decreases towards the centre. Panel d: M-8454-12702, an example of the galaxy with a small variation in the values of Dn(4000) indices along the radius. In each panel, the grey points denote Dn(4000) indices in the individual spaxels, the red circles mark the median values of the Dn(4000) in bins of 0.05 in the fractional radius R/R25, the bars show a scatter in Dn(4000) about the median value in the bins, and the red dashed line shows the median value of the Dn(4000) indices in all spaxels within the optical radius. The horizontal bar indicates the point spread function in the MaNGA measurements.
Current usage metrics show cumulative count of Article Views (full-text article views including HTML views, PDF and ePub downloads, according to the available data) and Abstracts Views on Vision4Press platform.
Data correspond to usage on the plateform after 2015. The current usage metrics is available 48-96 hours after online publication and is updated daily on week days.
Initial download of the metrics may take a while.