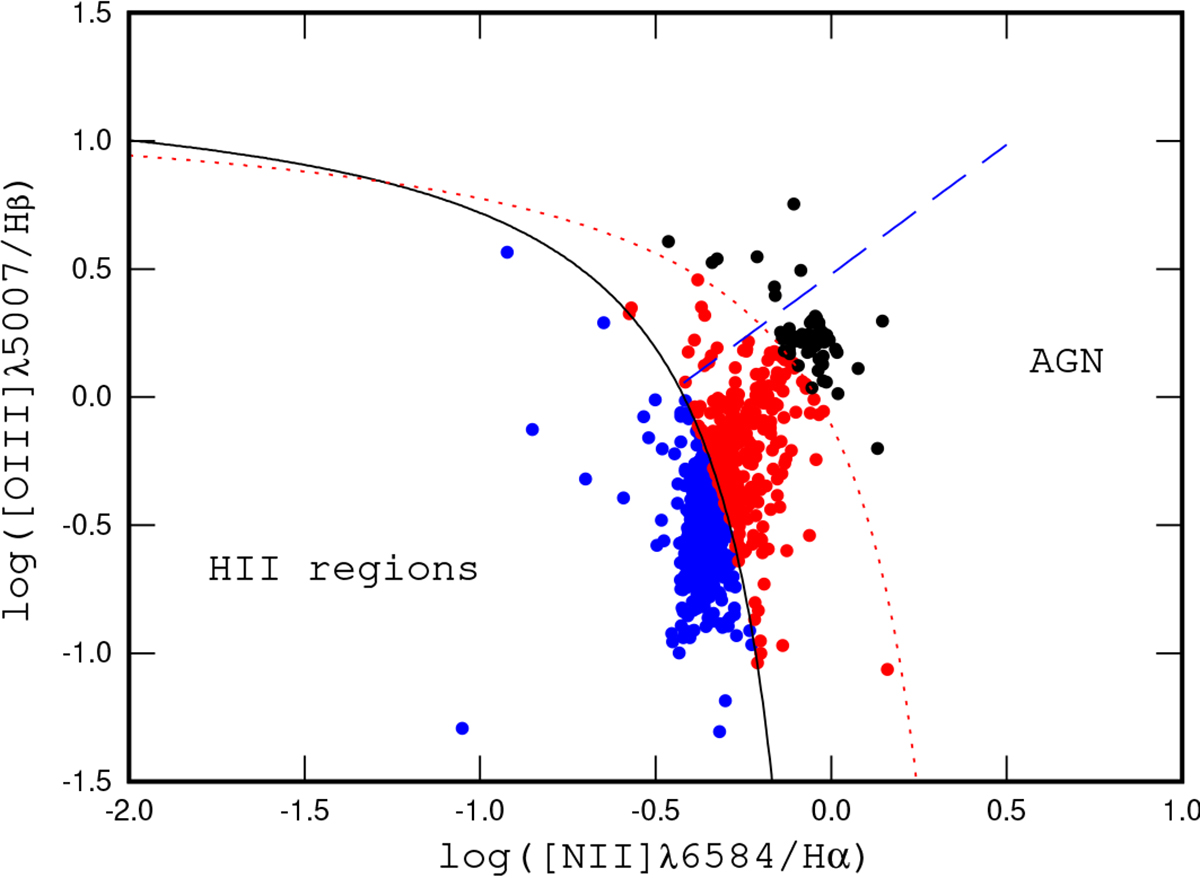
Fig. 2.
Download original image
Example of BPT diagrams for the individual spaxels in a galaxy. The individual spaxels with the H II-region-like spectra are denoted by the blue symbols, the spaxels with AGN-like spectra are shown by the dark symbols, and the red symbols are the spaxels with intermediate spectra. The solid and short-dashed curves mark the demarcation line between AGNs and H II regions defined by Kauffmann et al. (2003) and Kewley et al. (2001), respectively. The long-dashed line is the dividing line between Seyfert galaxies and LINERs defined by Cid et al. (2010).
Current usage metrics show cumulative count of Article Views (full-text article views including HTML views, PDF and ePub downloads, according to the available data) and Abstracts Views on Vision4Press platform.
Data correspond to usage on the plateform after 2015. The current usage metrics is available 48-96 hours after online publication and is updated daily on week days.
Initial download of the metrics may take a while.