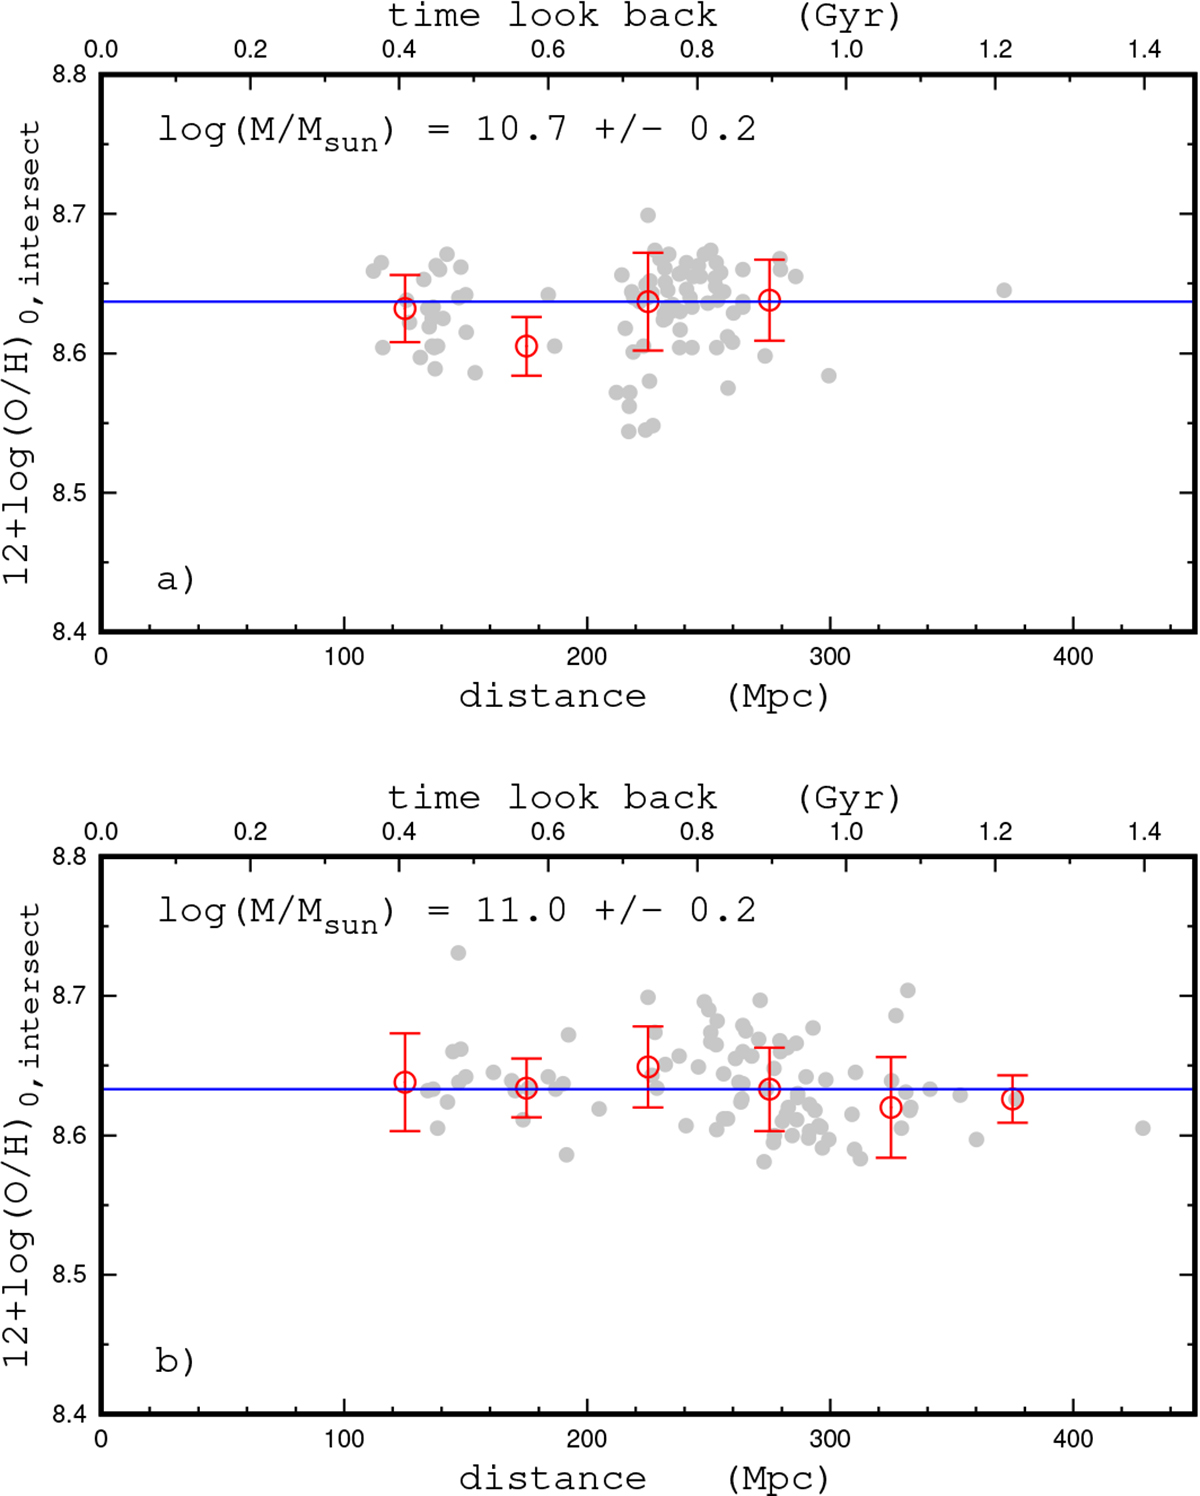
Fig. 10.
Download original image
Central intersect oxygen abundance (O/H)0, intersect as a function of the distance (look back time). Panel a: Central intersect oxygen abundance as a function of the distance (look back time) for galaxies with masses 10.5 < log(M⋆/M⊙) < 10.9. The grey circles denote the abundances in individual galaxies, the red circles mark the median values of the abundances for galaxies in bins of 50 Mpc in the distance, and the bars show the scatter in the abundances about the median value in the bins. The line is the median value of abundances for all galaxies from this mass interval. Panel b: The same as panel (a) but for galaxies with masses 10.9 < log(M⋆/M⊙) < 11.3.
Current usage metrics show cumulative count of Article Views (full-text article views including HTML views, PDF and ePub downloads, according to the available data) and Abstracts Views on Vision4Press platform.
Data correspond to usage on the plateform after 2015. The current usage metrics is available 48-96 hours after online publication and is updated daily on week days.
Initial download of the metrics may take a while.