Fig. 5.
Download original image
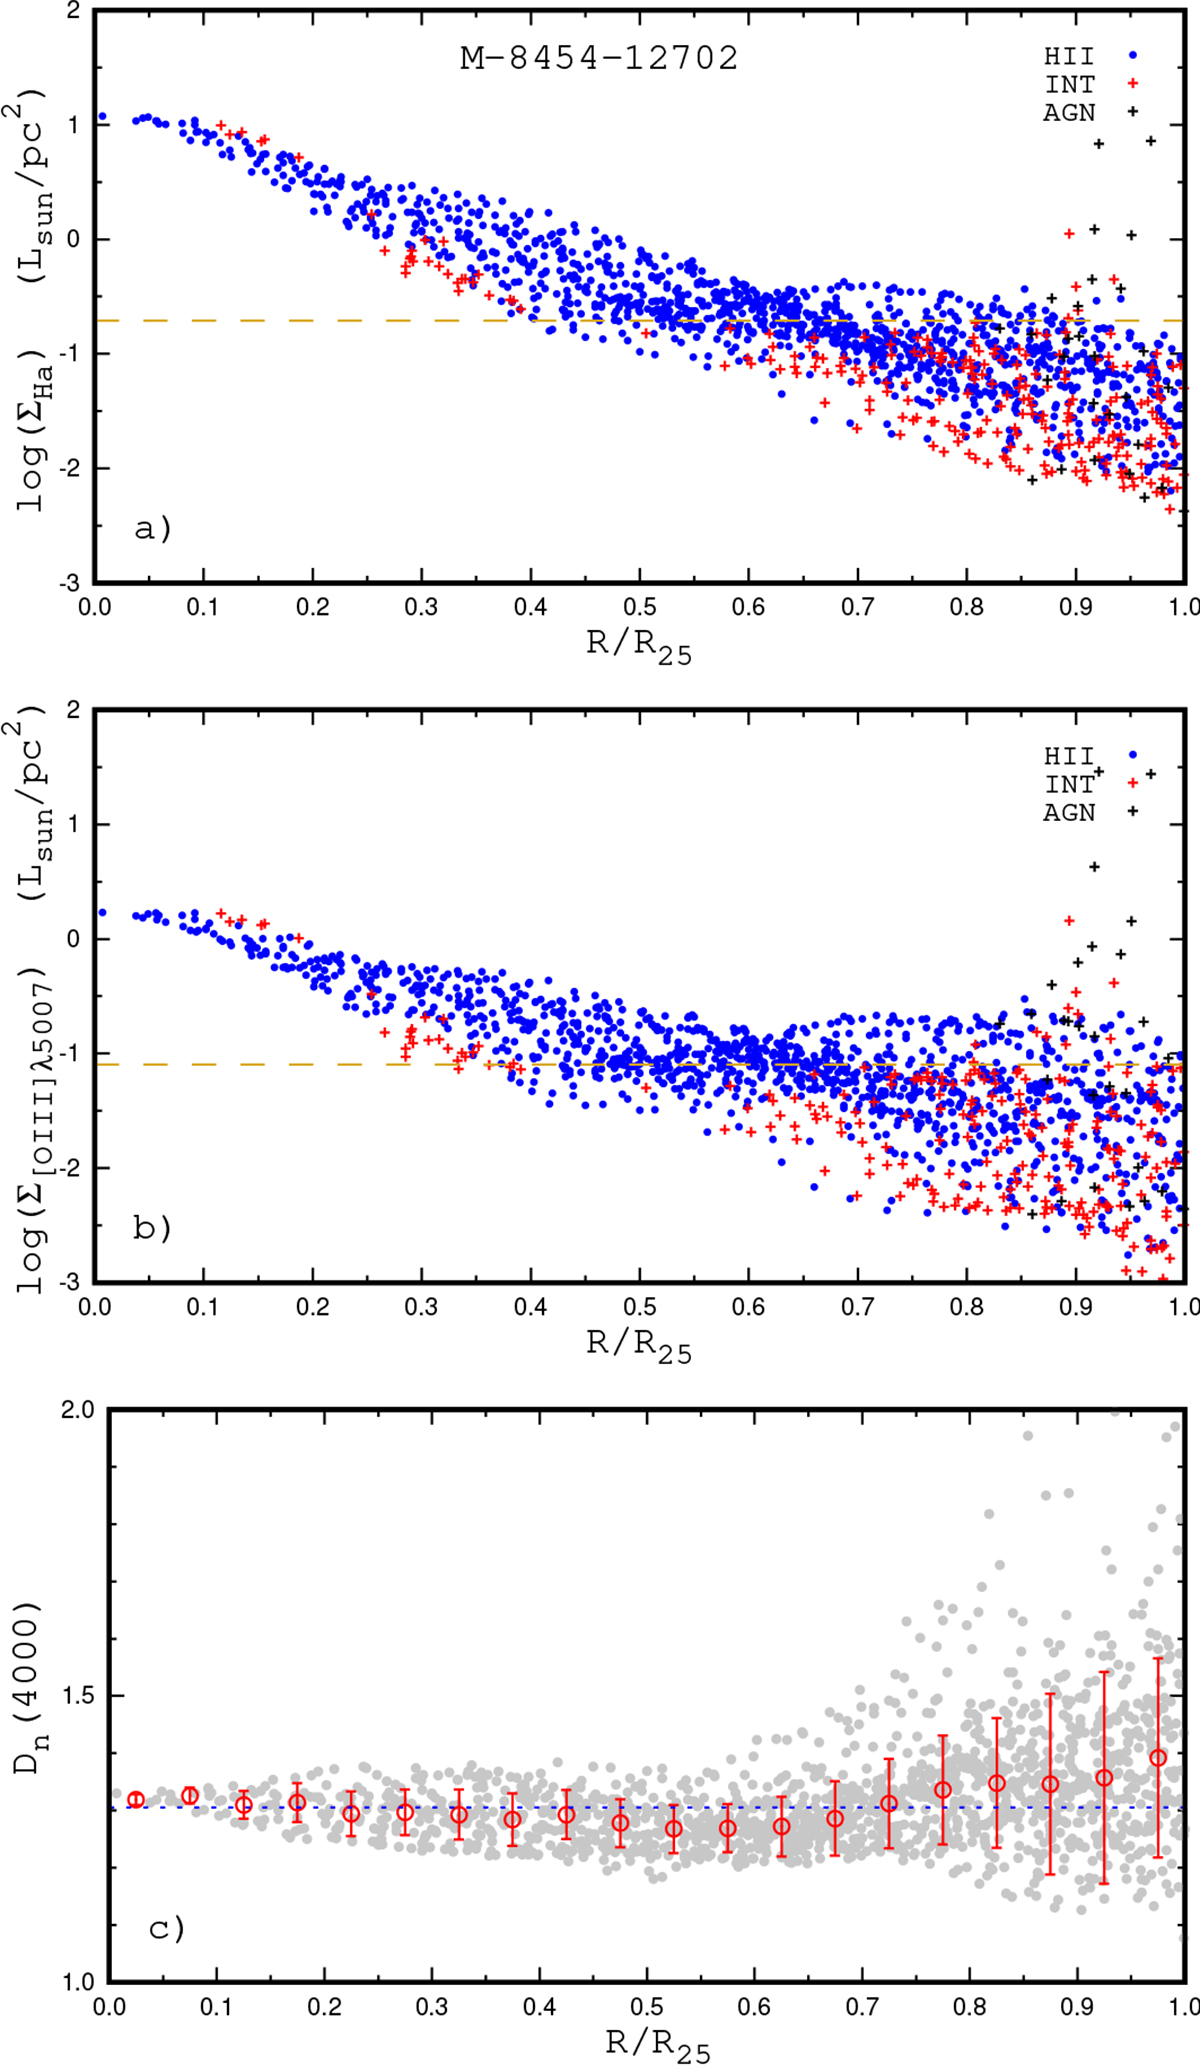
Radial disributions of the sufrace brightness in the Hα and oxygen [O III]λ5007 emission lines and Dn(4000) index in the MaNGA galaxy M-8454-12702. Panel a: Surface brightness ΣHα as a function of radius. The blue symbols denote the spaxels with the H II region-like spectra, dark symbols mark the spaxels with the AGN-like spectra, and the red symbols are the spaxels with the intermediate spectra. The golden dashed line shows the median value ΣHα, median of the surface brightness in the spaxels with the optical radius of the galaxy. Panel b: Same as panel (a) but for the oxygen [O III]λ5007 emission line. Panel c: Dn(4000) index as a function of radius. The grey points denote Dn(4000) indeces in the individual spaxels, red circles mark the median values of the Dn(4000) in bins of 0.05 in the fractional radius R/R25, bars show the scatter in the Dn(4000) about the median value in the bins, and the blue dashed line shows the median value of the Dn(4000) in all the spaxels within optical radius.
Current usage metrics show cumulative count of Article Views (full-text article views including HTML views, PDF and ePub downloads, according to the available data) and Abstracts Views on Vision4Press platform.
Data correspond to usage on the plateform after 2015. The current usage metrics is available 48-96 hours after online publication and is updated daily on week days.
Initial download of the metrics may take a while.