Fig. 9.
Download original image
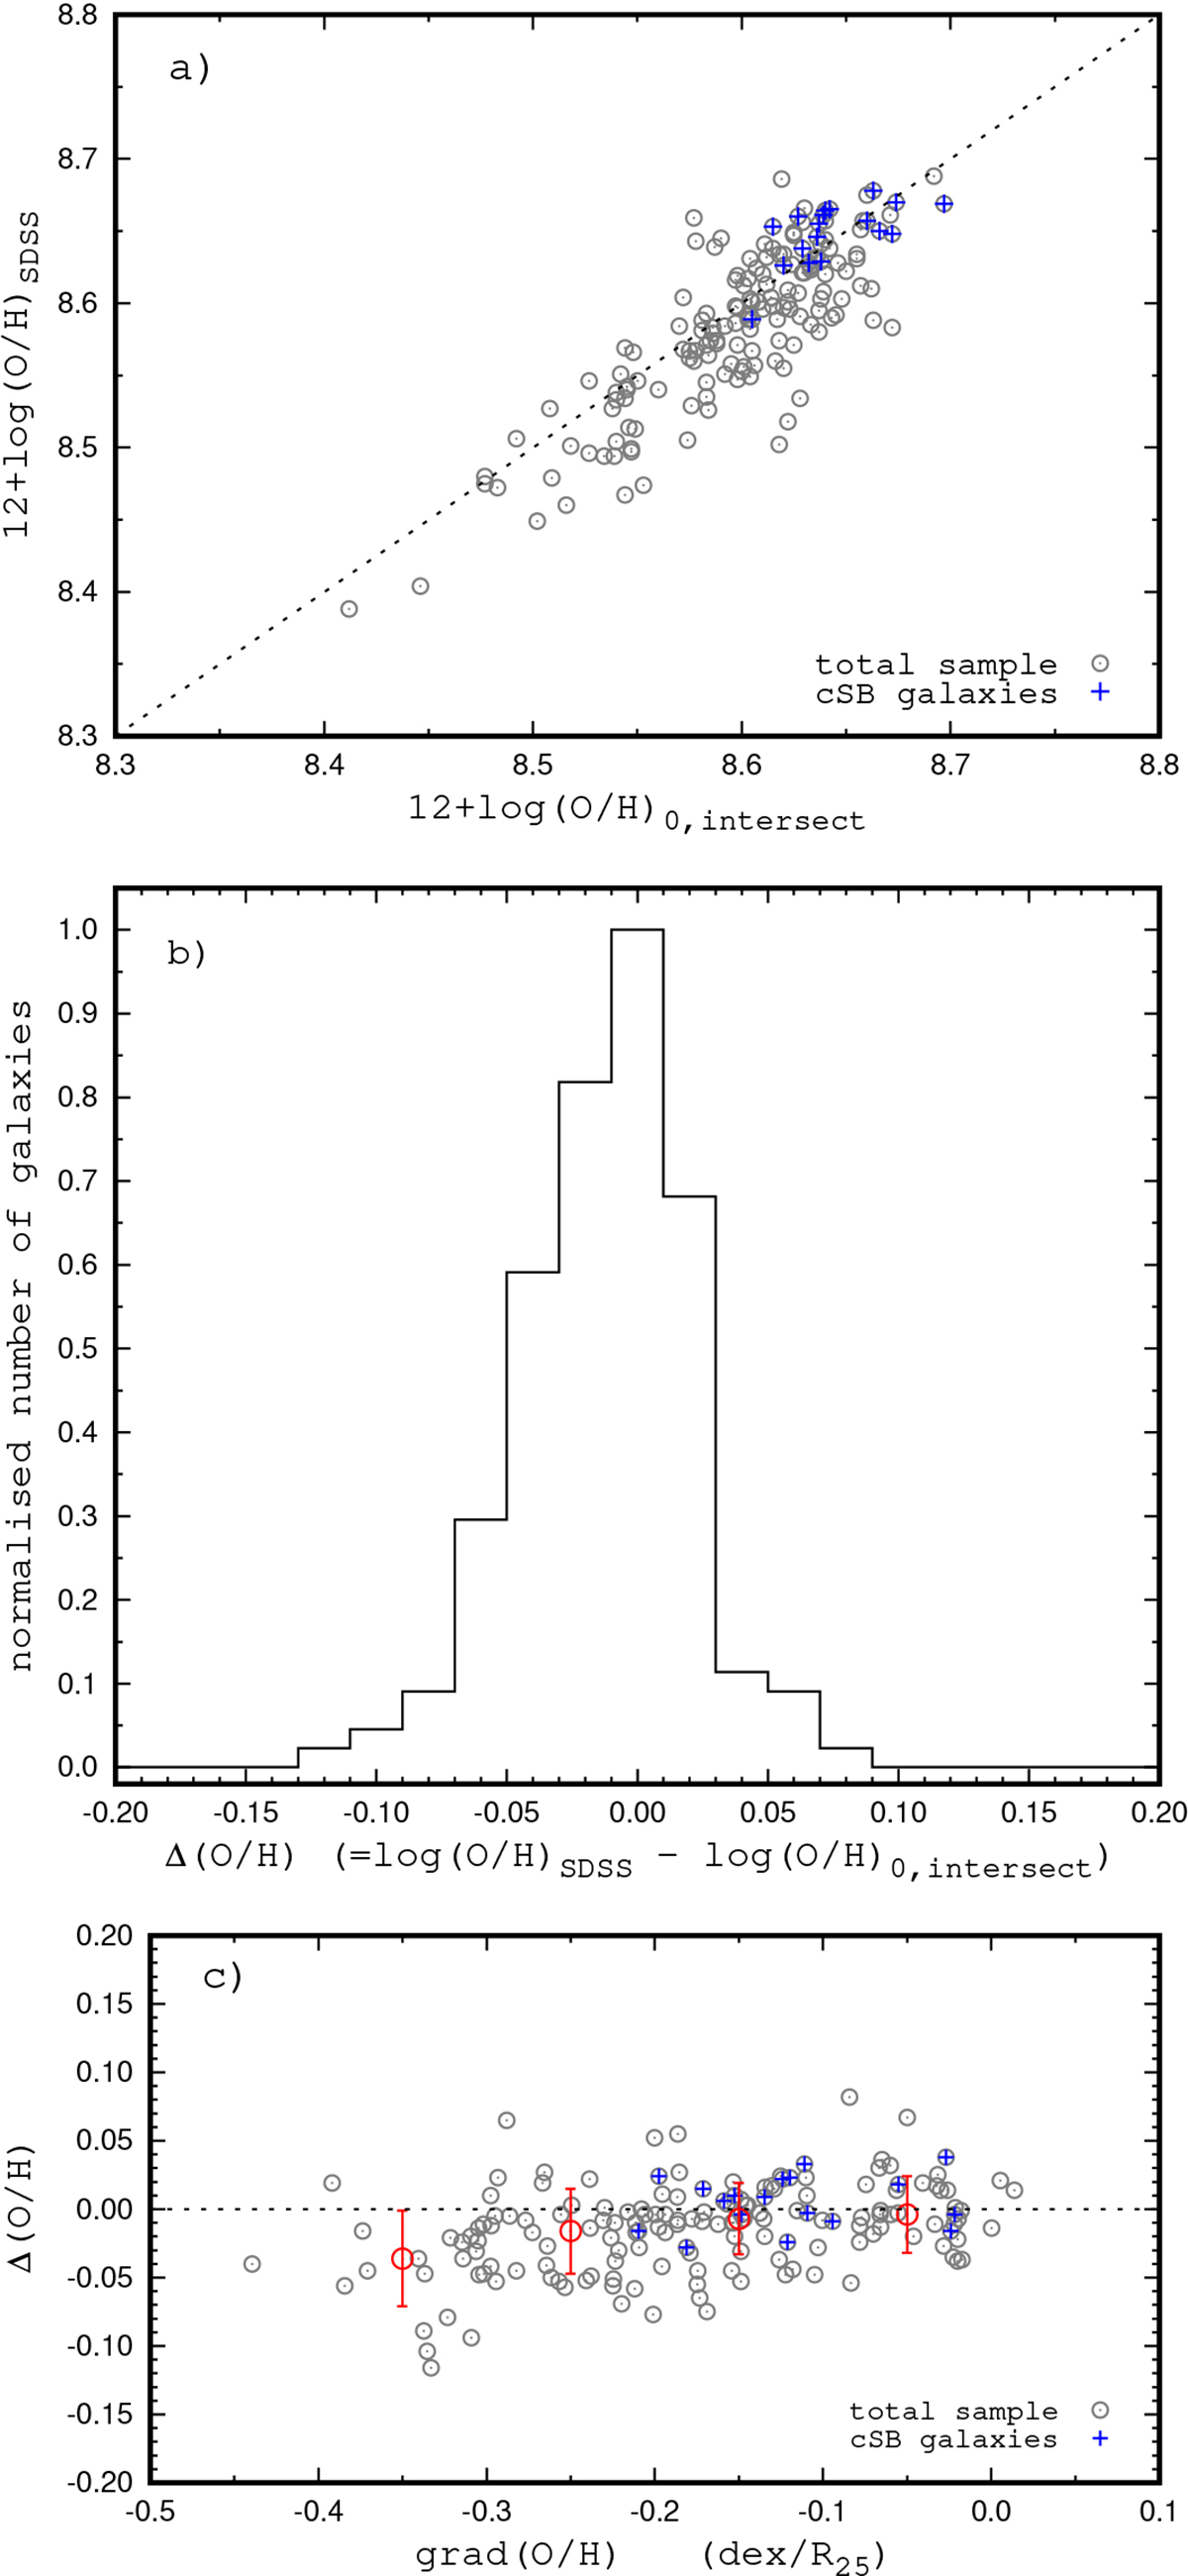
Comparison the central intersect oxygen abundances estimated from the metallicity gradient determined on the base of the IFU spectroscopy from the MaNGA, (O/H)0, intersect, and the local central oxygen abundances obtained from the single-fibre observations from the SDSS, (O/H)SDSS. Panel a: (O/H)SDSS as a function of the (O/H)0, intersect. The grey circles denote all the galaxies, the blue plus signs mark the cSB galaxies, and the line is one-to-one correspodance. Panel b: Normalised histogram of the differences Δ(O/H) = log(O/H)SDSS – log(O/H)0, intersect for our sample of galaxies. Panel c: Difference Δ(O/H) as a function of the gradient slope. The grey circles denote all the galaxies, the red plus signs mark the cSB galaxies, The red circles denote the median values of the ΔO/H in bins of 0.1 in the gradient slope, and the bars show the scatter in the ΔO/H about the median value in the bins.
Current usage metrics show cumulative count of Article Views (full-text article views including HTML views, PDF and ePub downloads, according to the available data) and Abstracts Views on Vision4Press platform.
Data correspond to usage on the plateform after 2015. The current usage metrics is available 48-96 hours after online publication and is updated daily on week days.
Initial download of the metrics may take a while.