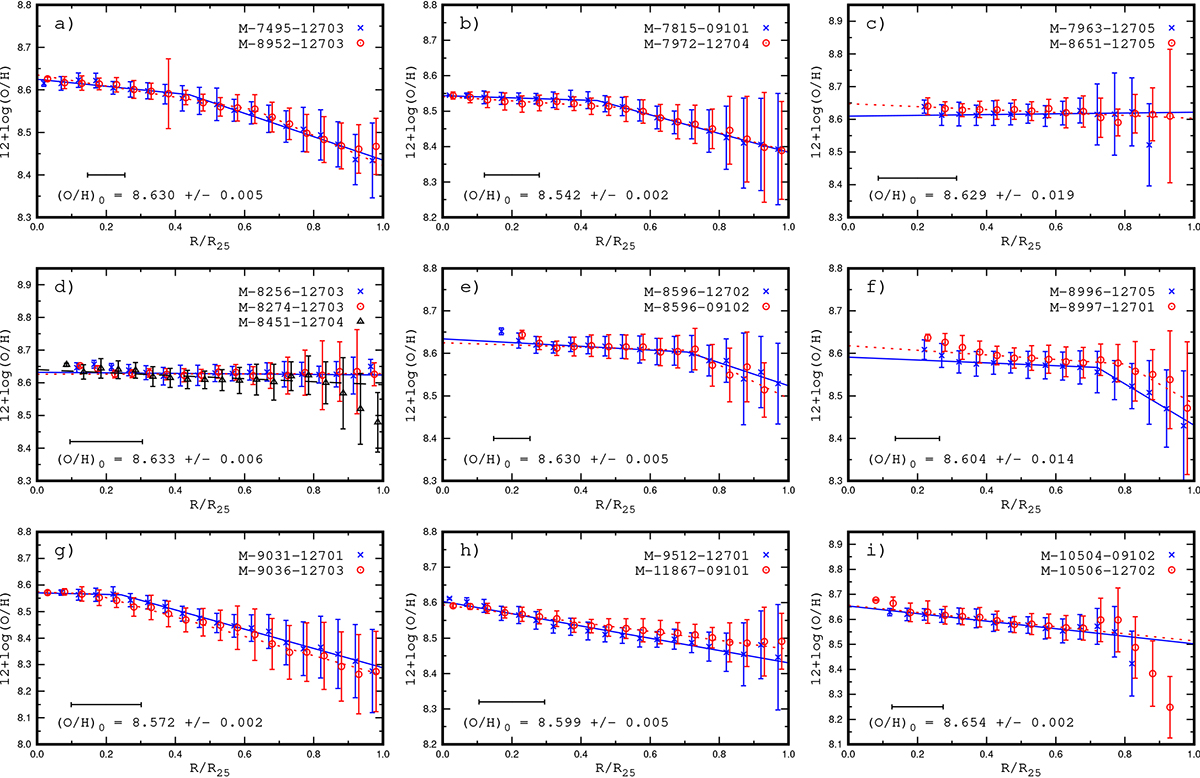
Fig. 8.
Download original image
Comparison of the radial distributions of oxygen abundances in the galaxy determined from the independent MaNGA observations of the same galaxy. In each panel, the symbols denote the median values of the O/H in bins of 0.05 in the fractional radius, R/R25, and the bars show the scatter in O/H about the median value in the bins. The lines show the relations we determined for the radial abundance distributions. The horizontal bar indicates the point spread function in the MaNGA measurements.
Current usage metrics show cumulative count of Article Views (full-text article views including HTML views, PDF and ePub downloads, according to the available data) and Abstracts Views on Vision4Press platform.
Data correspond to usage on the plateform after 2015. The current usage metrics is available 48-96 hours after online publication and is updated daily on week days.
Initial download of the metrics may take a while.