| Issue |
A&A
Volume 687, July 2024
|
|
|---|---|---|
| Article Number | A8 | |
| Number of page(s) | 11 | |
| Section | Interstellar and circumstellar matter | |
| DOI | https://doi.org/10.1051/0004-6361/202450029 | |
| Published online | 24 June 2024 | |
The rotation-tunneling spectrum of 3-hydroxypropenal and confirmation of its detection toward IRAS 16293-2422 B★
1
Astrophysik/I. Physikalisches Institut, Universität zu Köln,
Zülpicher Str. 77,
50937
Köln,
Germany
e-mail: This email address is being protected from spambots. You need JavaScript enabled to view it.
2
Institut de Recherche en Astrophysique et Planétologie (IRAP), Université de Toulouse, UT3-PS, CNRS, CNES,
9 av. du Colonel Roche,
31028
Toulouse Cedex 4,
France
3
Niels Bohr Institute, University of Copenhagen,
Øster Voldgade 5‒7,
1350
Copenhagen K,
Denmark
4
Univ. Lille, PhLAM – Physique des Lasers, Atomes et Molécules, CNRS, UMR 8523,
59000
Lille,
France
5
Univ Rennes, Ecole Nationale Supérieure de Chimie de Rennes, CNRS, ISCR−UMR 6226,
35000
Rennes,
France
Received:
19
March
2024
Accepted:
30
April
2024
Abstract
Context. 3-Hydroxypropenal (HOCHCHCHO) is the lower energy tautomer of malonaldehyde which displays a complex rotation-tunneling spectrum. It was detected somewhat tentatively toward the solar-type protostellar system IRAS 16293-2422 with ALMA in the framework of the Protostellar Interferometric Line Survey (PILS). Several transitions, however, had large residuals, preventing not only their detection, but also the excitation temperature of the species from being determined unambiguously.
Aims. We want to extend the existing rotational line list of 3-hydroxypropenal to shed more light on the recent observational results and to facilitate additional radio astronomical searches for this molecule.
Methods. We recorded and analyzed the rotation-tunneling spectrum of 3-hydroxypropenal in the frequency regions between 150 and 330 GHz and between 400 and 660 GHz. Transitions were searched for in the PILS observations of IRAS 16293-2422. Local thermodynamic equilibrium (LTE) models were carried out and compared to the observations to constrain the excitation temperature. Additional transitions were searched for in other ALMA archival data of the same source to confirm the presence of 3-hydroxypropenal.
Results. More than 7500 different spectral lines, corresponding to more than 11 500 transitions, were assigned in the course of our investigation with quantum numbers 2 ≤ J ≤ 100, Ka ≤ 59, and Kc ≤ 97, resulting in a greatly improved set of spectroscopic parameters. The comparison between the LTE models and the observations yields an excitation temperature of 125 K with a column density N = 1.0 × 1015 cm−2 for this species. We identified seven additional lines of 3-hydroxypropenal that show a good agreement with the model in the ALMA archive data.
Conclusions. The calculated rotation-tunneling spectrum of 3-hydroxypropenal has sufficient accuracy for radio astronomical searches. With the solution of the excitation temperature conundrum and the detection of seven more lines, we consider the detection of 3-hydroxypropenal toward IRAS 16293-2422 as secure.
Key words: molecular data / methods: laboratory: molecular / techniques: spectroscopic / radio lines: ISM / ISM: molecules / astrochemistry
Supplementary data are available at CDS via anonymous ftp to cdsarc.cds.unistra.fr (138.79.128.5) or via https://cdsarc.cds.unistra.fr/viz-bin/cat/J/A+A/687/A8
© The Authors 2024
 Open Access article, published by EDP Sciences, under the terms of the Creative Commons Attribution License (https://creativecommons.org/licenses/by/4.0), which permits unrestricted use, distribution, and reproduction in any medium, provided the original work is properly cited.
This article is published in open access under the Subscribe to Open model. This email address is being protected from spambots. You need JavaScript enabled to view it. to support open access publication.
1 Introduction
Malonaldehyde is the prototype and parent species of β-dicarbonyl compounds of the form RC(O)CH2C(O)R′ (R = R′ = H for malonaldehyde). However, it was found that enol tautomers of these molecules were usually lower in energy because of the formation of intramolecular hydrogen bonds. An interesting question in the special case of R = R′ was if this hydrogen bonding was strong enough to form symmetric hydrogen bonds to both oxygen atoms or if the bonding was weaker to form a hydrogen bond with only one oxygen atom, thus yielding a double minimum potential possibly with tunneling between the two minima. The enol tautomer of malonaldehyde is 3-hydroxypropenal, one of the simplest molecules containing a ring which is closed by a hydrogen bond. Early quantum-chemical calculations yielded contradicting results on its structure; Karlström et al. (1975) found a structure with an asymmetric double minimum potential with a barrier low enough to permit tunneling between the two minima, as presented in the left and right parts of Fig. 1, whereas Isaacson & Morokuma (1975) found a structure with a single, symmetric minimum potential, such as the one shown in the center of Fig. 1.
The rotational spectra of several 3-hydroxypropenal iso-topologs were investigated extensively in order to resolve this conflict. Two sets of transitions with similar spectroscopic parameters, but opposing spin-statistics (3:1 versus 1:3) were identified in an early, preliminary account (Rowe et al. 1976). The second set belonged to a state 16 ± 14 cm−1 higher than that of the first set, compatible with a double minimum potential with tunneling and almost certainly ruling out a symmetric single minimum potential. Comparison of the OO non-bonding distance, determined through 16O/18O substitution, with values from quantum-chemical calculations (Karlström et al. 1975; Isaacson & Morokuma 1975) supported this interpretation. Baughcum et al. (1981) investigated many more isotopic species, extended the measurements into the lower millimeter region, carried out dipole moment measurements, refined the energy difference of the two states to 26 ± 10 cm−1 and observed an absorption band near 21 cm−1 for the main isotopolog, and determined the structural parameters of the asymmetric minimum configuration of 3-hydroxypropenal. Two later studies (Baughcum et al. 1984; Turner et al. 1984) improved the analyses of the rotation-tunneling interaction and reported additional transition frequencies for the main isotopolog (Turner et al. 1984). Baughcum et al. (1984) also evaluated the tunneling barrier height for the main isotopolog as ~6.6 kcal mol−1 or ~2300 cm−1.
Stolze et al. (1983) studied the rotational Zeeman effect of 3-hydroxypropenal and reported field-free transition frequencies for some low-J transitions. Firth et al. (1991) applied tunable far-infrared spectroscopy to extend transition frequencies of the main isotopolog into the submillimeter region. Finally, Baba et al. (1999) reported several transition frequencies between the two tunneling states and evaluated the associated a-dipole moment component through relative intensity measurements in comparison to the rotational transitions within the tunneling states, which obey b-type selection rules.
Recently, Coutens et al. (2022) employed a catalog entry of the Cologne Database for Molecular Spectroscopy, (CDMS, Müller et al. 2005; Endres et al. 2016) to identify 3-hydroxypropenal somewhat tentatively toward the B component of the protostellar system IRAS 16293–2422 (hereafter IRAS16293) in observations with the Atacama Large Millime-ter/submillimeter Array (ALMA) obtained in the Protostellar Interferometric Line Survey (PILS), an unbiased molecular line survey between 329.1 and 362.9 GHz (Jørgensen et al. 2016). The 3-hydroxypropenal catalog entry had one decisive drawback that transition frequencies in the frequency range of the survey with low values of Ka had rather large uncertainties, preventing to establish their presence or absence. Such transitions should be observable in the warm excitation temperature scenario of ~300 K, whereas they should be too weak to be identified in the luke-warm excitation scenario of ~125 K. Both excitation scenarios were found quite commonly for molecules identified in PILS (e.g., Jørgensen et al. 2018).
We have recorded and analyzed the rotation-tunneling spectrum of 3-hydroxypropenal in the millimeter and submillime-ter region in order to establish its excitation temperature in IRAS16293 B, which may lead to greater certainty about the presence of the molecule in this source, and to facilitate further searches for 3-hydroxypropenal in the interstellar medium.
We provide in Sect. 2 the spectroscopic properties of the molecule, in Sect. 3 the experimental details, describe in Sect. 4 the laboratory spectroscopic results, and discuss these in Sect. 5. The astronomical observations are detailed in Sect. 6, and conclusions and outlook are presented in Sect. 7.
 |
Fig. 1 Model of the 3-hydroxypropenal molecule. Carbon atoms are symbolized by gray spheres, hydrogen atoms are indicated by small, light gray spheres, and oxygen atoms by red spheres. The two equivalent minimum structures are shown at the outside while the transition state with C2v symmetry is displayed in the center. |
2 Spectroscopic properties of 3-hydroxypropenal
The 3-hydroxypropenal molecule is a very asymmetric rotor of the prolate type with κ = (2B − A − C)/(A − C) = −0.4441. It has two equivalent configurations of CS symmetry, as displayed schematically in Fig. 1. The barrier to interchange between these two minima is sufficiently low to facilitate tunneling, which leads to a symmetric tunneling state υ = 0+ and an antisymmetric tunneling state υ = 0− 647046.2 MHz higher in energy (Baba et al. 1999). The transition state of C2v symmetry is shown in the center of Fig. 1. The two equivalent H atoms not on the symmetry axis in the transition state lead to ortho/para spin-statistics with relative intensities of 3:1. The ortho levels in υ = 0+ are those with Ka + Kc being odd and in υ = 0− those with Ka + Kc being even.
The dipole moment component for rotational transitions, within υ = 0+ or υ = 0−, is along the b-axis, the symmetry axis of the transition state. Its magnitudes were determined through Stark spectroscopy as µb = (2.59 ± 0.02) D for υ = 0+ and µb = (2.58 ± 0.02) D for υ = 0− (Baughcum et al. 1981). The selection rules are Δ J = 0, ±1 and ΔKa and ΔKc are odd. The strongest transitions are rR-branch transitions with ΔKa = +1 and ΔJ = +1 from the lower to the upper state and Ka close to J. Such transitions were reported by Firth et al. (1991) in their tunable far-infrared study; transitions with very low values of Ka were not reported. Also at lower Ka, pR-branch transitions (ΔKa = −1) are relatively strong as they form asymmetry doublets with the rR-branch transitions having the same J and Kc. The respective pair of transitions is well separated at intermediate Ka and Kc, but the splitting decreases rapidly with decreasing Ka and is collapsed well before Ka = 0. This pairing of asymmetry doublets is called oblate pairing while the respective pairing at high values of Ka is called prolate pairing. The Q-branch transitions (ΔJ = 0) are usually weaker, but higher-J may appear as quite strong compared to lower-J R-branch transitions, which is quite commonly found at lower frequencies. The P-branch transitions (ΔJ = −1) are usually weaker still. Finally, the asymmetry of the molecule causes transitions with ΔKa = ±3 etc. to have non-negligible intensities.
The tunneling of the H atom is along the a-axis; transitions between υ = 0+ and υ = 0− follow therefore a-type selection rules with ΔJ = 0, ±1, ΔKa even, and ΔKc odd. Strong rotation-tunneling transitions are qQ-branch transitions with Ka close to J. The transitions reported by Baba et al. (1999) were mostly of this type as they occur in a rather narrow frequency window quite close to the tunneling frequency. A small number of transitions with somewhat lower values of Ka were not included in their fit because they were weak or blended. And again were transitions with very low values of Ka not reported in that work. Baba et al. (1999) determined µa/µb = 0.14 from relative intensity measurements. This yields µa = 0.36 D; it was assumed that µa is positive, as is commonly done. The intensities of transitions involving at least one perturbed level may, however, be affected by the sign of µa relative to that of µb and that of Fab, as will be discussed in Sect. 4.3. Also relatively strong are qP- and qR-branch transitions having low values of Ka. The qR-branch transitions have frequencies above the tunneling frequency for the most part while qP-branch transitions are usually found below it. Transitions with ΔKa = ±2 etc. gain considerable intensity because of the asymmetry of the 3-hydroxypropenal molecule. In addition, they may borrow additional intensity from rotational transition through tunneling-rotation interaction.
Energy levels in υ = 0+ and υ = 0− with similar energies can interact if they have the same J and if they differ in Ka by an odd number and in Kc by an even number. The interaction is a Coriolis-type interaction, frequently just called Coriolis interaction. It is usually strongest the closer the energies are in the unperturbed case, the smaller ΔKa and ΔKc are, and the higher J and Ka or Kc are. Consequences of the interactions are that the two levels repel each other and mix in character with strength of the interaction. Transitions may be displaced by several gigahertz, and tunneling-rotation transitions can gain also intensity from rotational transitions through the mixing.
3 Experimental details
3.1 Sample preparation
The malonaldehyde synthesis of Trivella et al. (2008) was applied with slight modifications. Acid hydrolysis of 1,1,3,3-tetraethoxypropane (purity > 96%, Sigma Aldrich) followed by treatment with aqueous NaOH gave the sodium salt of malon-aldehyde. This salt suspended in diethyl ether was then acidified with an anhydrous solution of HCl in diethyl ether at −40°C followed by 2 h of stirring at this temperature. Purification was carried out by trap-to-trap distillation with slow heating to room temperature of the solution to give pure malonaldehyde in a trap immersed in a bath cooled to −50°C.
3.2 Spectroscopic measurements
The measurements between 150 and 330 GHz and between 400 and 660 GHz were carried out with the Lille spectrometer (Zakharenko et al. 2015). We employed a quartz tube (10 cm diameter, 200 cm in length) as absorption cell. Throughout the measurement, the sample was submerged in an ethanol cold bath at −15° C, and a minimum flow of the sample vapor was maintained between 2.0 to 2.5 Pa (20–25 µbar). The frequencies were covered with various active and passive frequency multipliers from VDI Inc., and an Agilent synthesizer (12.5–18.25 GHz) was used as the source of radiation. A liquid He-cooled InSb bolometer (QMC Instruments Ltd) was used to detect the absorption signals. The uncertainties of the measured line position were judged on the symmetry of the line-shape and the signal-to-noise ratio (S/N); 15, 20, or 30 kHz were assigned to average lines, 10 and 5 kHz for very symmetric lines with very good S/N, and 50, 70, or 100 kHz for weaker lines, lines with poorer S/N, or lines with less symmetric line-shape, for example, because of the proximity to another line.
4 Laboratory spectroscopic results
4.1 Analysis and fitting
The rotation-tunneling spectrum, such as in the case of 3-hydroxypropenal, is usually treated with a Hamiltonian that is divided into a 2 × 2 matrix. The diagonal elements are commonly two Watson-type rotational Hamiltonians and include the energy of the upper tunneling state; the interaction Hamiltonian is off-diagonal. We applied here Watson’s S reduced Hamiltonian in the prolate Ir representation on the diagonal; see Margulès et al. (2020) for a discussion on the advantages of the S reduction.
The two tunneling states 0+ and 0− together comprise the ground vibrational state υ = 0. Therefore, it can be advantageous to rearrange the Hamiltonians and fit average spectroscopic parameters X = (X(0+) + X(0−))/2 and differences ΔX = (X(0−) − X(0+))/2, as was done by Christen & Müller (2003) in their treatment of the lowest energy conformer of ethylene glycol. Christen & Müller (2003) also pointed out that the differences in spectroscopic parameters can be interpreted as rotational corrections to the energy difference. We follow this interpretation in the present work. We should point out that in our definition of the differences, 0− is higher in energy by 2E than 0+ . The advantage of this formulation is that an average parameter or its difference can be used individually in the fit independent of each other and was particularly noteworthy in a refit of ethanethiol data (Müller et al. 2016). Other investigations applying this approach include hydroxyacetonitrile (Margulès et al. 2017) and some of its minor isotopic species (Margulès et al. 2023) as well as dimethylamine (Müller et al. 2023).
The off-diagonal interaction was described employing Pick-ett’s Reduced Axis System (RAS) (Pickett 1972), as was already done in earlier studies of the rotation-tunneling spectrum of 3-hydroxypropenal. The only non-zero low-order term is Fab(JaJb + JbJa) that may be supplemented with suitable distortion parameters of the form  .
.
Pickett’s programs SPCAT and SPFIT (Pickett 1991) were used to calculate and fit the rotational spectra of 3-hydroxypropenal. We determined the spectroscopic parameters of 3-hydroxypropenal in the usual way. We tested after each round of assignments if one or more spectroscopic parameters would improve the quality of the fit by amounts that warranted keeping the respective parameter in the fit. This procedure helps to keep the number of spectroscopic parameters small while reproducing the transition frequencies already in the fit as well as possible. It is important to try only parameters that are reasonable with respect to those already used in the fit. If at least one parameter improved the quality of the fit sufficiently, we chose the one that improved the quality the most and searched for additional parameters. We tested occasionally if a parameter with relatively large uncertainties can be omitted from the fit without increasing the rms error of the fit by too large amounts.
4.2 Previous data
We describe the previous data, their treatment in the initial fit that was the basis of the version 1 CDMS catalog entry of 3-hydroxypropenal, which in turn was the starting point of our present analysis, and their treatment in the final fit of the present study. The microwave data from Baughcum et al. (1981) up to 40 GHz displayed very small residuals and were assigned uncertainties of 10 kHz in the initial fit as well as in the final fit of this study since no uncertainties were given in that work. The b-type rR- and rQ-branch transitions cover quantum numbers 1 ≤ J ≤ 15 and Ka ≤ 6. The millimeter wave transitions between 55 and 113 GHz were rQ-branch transitions with 6 ≤ J ≤ 29 and 2 ≤ Ka ≤ 11 that were taken with a different spectrometer. Uncertainties of 150 kHz were applied in the initial fit and one transition with J = 37 was omitted because of large residuals. These data were omitted in the final fit of the present work because of transition frequencies with similar quantum numbers with much smaller uncertainties.
Stolze et al. (1983) published microwave transitions between 12 and 25 GHz with Ka ≤ J ≤ 3. They reported uncertainties as being better than 20 kHz. We included them in the initial fit as well as in the final fit from our current investigation with 10 kHz uncertainties.
Turner et al. (1984) reported a moderate number of rR- and rQ-branch transitions between 78 and 85 GHz having 8 ≤ J ≤ 38 and Ka ≤ 14 with estimated uncertainties of 200 kHz. The transition frequencies were used in the initial fit except for three. Their data were omitted from our present final fit for the same reason as above.
The tunable far-infrared data published by Firth et al. (1991) are rR-branch transitions, except for two pR-branch transitions, distributed between 352 and 898 GHz with 20 ≤ J ≤ 50 and 10 ≤ Ka ≤ 44. Uncertainties were reported to be about 400 kHz, which appeared to be too optimistic. We assigned 800 kHz in our initial fit and omitted three transition frequencies because of large residuals nevertheless. We omitted these data in our final fit because of the large uncertainties and because we have remeasured many of these transition more accurately.
The only tunneling-rotation transitions were reported by Baba et al. (1999). They published qQ-branch transitions between 643 and 651 GHz with 8 ≤ J ≤ 35 and 4 ≤ Ka ≤ 30. No uncertainties were given explicitly, but the rms of ~30 kHz for their lines included in the fit was deemed to be commensurate with the uncertainties. We included the data in our initial fit accordingly, but omitted them in our final fit of this study. Not only did we redetermine frequencies of most transitions, often with better uncertainties, but we also noted that the series of transitions with Ka = J − 4 and Ka = J − 5 differed in many cases from our measurements and from the calculated frequencies by 50 kHz and more; only the short series of transitions with Ka = J showed very good agreement with the exception of one line that was not included in their fit and was not assigned in the present work.
4.3 Observed spectrum and assignments
The recorded rotation-tunneling spectrum of 3-hydroxypropenal displayed fluctuations in the S/N, which is commonly observed in millimeter and submillimeter spectroscopy, but the change in S/N is mostly gradual. In combination with a rather rich spectrum, the relative intensity is not only helpful for assignments, but it is also an important tool to judge if a line may be blended. Obviously blended lines were in most cases not included in the line list except for unresolved asymmetry doublets and occasionally accidental blends of lines assignable to the ground vibrational state of 3-hydroxypropenal as long as the line shape was sufficiently symmetric.
Initial assignments were made above 600 GHz because this is the region in which the a-type rotation-tunneling transitions occur which were reported by Baba et al. (1999). However, the transitions easily assignable in the first round were b-type R-branch transitions with 31 ≤ J ≤ 50 and mostly fairly high values of Ka, up to 32. The lowest Ka values by far in this round were those of a Ka = 12–9 transition.
Not all of the assigned transitions could be fit satisfactorily in the first few rounds. Transitions with large residuals were weighted out temporarily as we assumed these residuals were a consequence of correlation among the interaction parameters and between these and the remaining parameters. Eventually, most of these lines were fit well, the remaining ones were omitted as for most of these closer inspection suggested the lines to be blended. Transitions with modest residuals around three to four times of the experimental uncertainties were marked for occasional inspection. Almost all of these were fit well in later fits.
Subsequently, assignments were made between 500 and 660 GHz in several rounds, slowly increasing the quantum number range and also assigning weaker lines. The second round included a-type rotation-tunneling transitions, and soon thereafter, we assigned transitions with low values of Ka at and near the oblate limit, i.e., with Kc near J and J around 80 and 90. A conspicuous clustering of R-branch transitions occurs near the oblate limit, as shown in Fig. 2: transition decreasing in J by one, in Kc by two, and increasing in Ka by one occur very close in frequency, the appearance resembling the origin of a Q-branch.
We assigned transitions in sections decreasing in frequency afterwards. The clustering of R-branch transitions near the oblate limit was a persistent feature, but frequently disrupted for some transitions, as displayed in Fig. 3. The disruption is caused by a ΔKc = 2 interaction which is resonant at J = 45 and Kc = 43 in υ = 0+ and Kc = 45 in υ = 0−. The υ = 0+ transition with  is shifted by ~2 GHz to 331903.2 MHz, in the 330–400 GHz measurement gap.
A plot of the reduced energy E − (B + C) J(J + 1)/2 versus J is shown in Fig. 4. The purely J-depended effects are subtracted off to first order from the rotational energy such that the combined effects of asymmetry, centrifugal distortion, and perturbation are visible for individual Ka series of υ = 0+ and υ = 0−. The ΔKc = 2 interaction is resonant at Kc = 43 for υ = 0+ and Kc = 45 for υ = 0− for 45 ≤ J ≤ 48. The resonant Kc pair increases gradually with J, Kc = 44 and 46 are resonant for 49 ≤ J ≤ 58, Kc = 45 and 47 for 59 ≤ J ≤ 63, Kc = 46 and 48 for 64 ≤ J ≤ 66, and so on. The perturbations are fairly weak and rather local for the lower values of J, the shift in energy is not or only hardly seen in the reduced energy plot. Increasingly larger effects are noticeable in Fig. 4 for J > 50. At least two, often many more transitions were included in the line list for each tunneling state and nearly all J between 45 and 70, at which point many energy levels with similar quantum numbers are perturbed very strongly, and the attribution of energy levels to ΔKc = 2 interactions are complex.
We identified other strong interactions which cause perturbations in several values of J, for example, with ΔKa = 3, which are resonant at J = 35 and Ka = 21 and 18 for υ = 0+ and υ = 0−, respectively, and at J = 49 and 50 for ortho- and para-3-hydroxypropenal, respectively, in the case of Ka = 22 and 19. These resonances are also indicated in Fig. 4. Multiple transitions were assigned for these levels as well as in the vicinity of the resonance for both tunneling states. Other, more local perturbations are best described as connecting levels with ΔKc = 4, ΔKa changes by 5 for one asymmetry side and by 3 for the other. Two examples with multiple transitions in the line list are 3717,21 in υ = 0+ and 3712,25 in υ = 0− or the respective pair 4116,26 and 4111,30. The various perturbations may transfer intensity to rotation-tunneling transitions having ΔKa = 2, 4, and 6.
After having reached the lower frequency limit of 150 GHz in the assignment process, further assignments were made by going up in frequency to the upper limit. The assignments involved often weak lines, but also some stronger lines whose assignments were uncertain initially because they were calculated too far away from their frequency in the experimental spectrum. In addition, few transitions were checked that had relatively large residuals in the fit. Among the weak transitions included in the line list are b-type Q-branch rotational transitions with Ka up to 59. Some of these displayed a fairly strong dependence on the sign choice of µa with µb and Fab chosen to be positive, as can be seen in Fig. 5. The upper trace simulation shows two lines differing in intensity by a factor of ~3.5 whereas in the middle trace simulation the factor is only ~1.5, which is clearly more appropriate. These intensity changes upon sign change of µα were among the largest easily discernible in the spectrum.
Our final line list consisted of 11551 transitions from the present study which correspond to 7551 different frequencies, mostly because of unresolved asymmetry splitting. The quantum numbers J, Ka, and Kc reach values of 100, 59, and 97. The numbers of transitions within υ = 0+ and υ = 0− is 5123 and 5127, respectively, most having ΔKa = ±1, some have ΔKa = 3. There are 1066 transitions from υ = 0+ to υ = 0−, mostly with ΔKa = 0, some with ΔKa = −2, and even fewer with ΔKa = −4 or −6. And finally there are 235 transitions from υ = 0− to υ = 0+, mostly with ΔKa = +4 and +2, but also 16 having ΔKa = +6. The line list also contains 79 lines from Baughcum et al. (1981) and 11 lines from Stolze et al. (1983), see also Sect. 4.2.
The final set of spectroscopic parameters is presented in Table 1. The rms of our lines is 17.4 kHz, and the rms error is 0.838. The rms of the previous data from Baughcum et al. (1981) and from Stolze et al. (1983) is 8.9 kHz and 7.4 kHz, respectively. The rms of 17.3 kHz and the rms error of 0.839 for the total fit are obviously dominated by our data.
The line, parameter, and fit file, along with auxiliary files, are available in the fitting spectra section1 of the CDMS. A calculation of the rotation-tunneling spectrum is deposited in the catalog section2 of the CDMS. The line list with quantum numbers, uncertainties and residuals between observed frequencies and those calculated from the final set of spectroscopic parameters is available from ads.
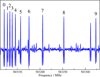 |
Fig. 2 Section of the rotational spectrum of 3-hydroxypropenal. The transitions are within υ = 0− and have |

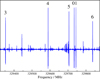 |
Fig. 3 Section of the rotational spectrum of 3-hydroxypropenal. The transitions are within υ = 0+ and have |


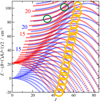 |
Fig. 4 Section of the reduced energy plot of 3-hydroxypropenal. Data points of υ = 0+ are shown in blue, those of υ = 0− in red; selected Ka series are indicated to the left. Resonant interactions with ΔKc = 2 are indicated by yellow circles. They occur at Kc = 43 for υ = 0+ and Kc = 45 for υ = 0− for 45 ≤ J ≤ 48. The resonant Kc pair increases gradually with J, Kc = 44 and 46 are resonant for 49 ≤ J ≤ 58. Two ΔKa = 3 interactions are resonant at Ka = 21/18 and J = 35 as well as Ka = 22/19 and J = 49 for ortho and J = 50 for para, which is signaled by green circles. Further ΔKa = 3 or 5 interactions are usually more local and are not highlighted. |
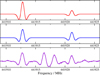 |
Fig. 5 Section of the rotational spectrum of 3-hydroxypropenal in the lower trace. The |

Average spectroscopic parameters X (MHz) and energy E with rotational corrections or changes ΔX from average spectroscopic parameters of 3-hydroxypropenal along with interaction parameters determined in the present study.
5 Discussion of the laboratory spectroscopic results
It is somewhat easier to compare the differences in spectro-scopic parameters with the respective spectroscopic parameters. The lowest order parameters ΔA, ΔB, and ΔC are comparatively large, though still much smaller than A, B, and C because the tunneling barrier is relatively low, and the splitting between υ = 0+ and υ = 0− is relatively large. It is very common that the ratio of the differences in spectroscopic parameters with the respective spectroscpic parameters increases with order of magnitude of the parameters. The differences are only about an order of magnitude smaller in case of the quartics, similar in magnitude for the sextics, and mostly slightly larger in case of the octics. The number of transitions within each tunneling state are much larger than those between the tunneling states. Therefore, it is not surprising that the absolute uncertainties of the changes in the distortion parameters are mostly larger than those of the respective parameters; however, it is opposite in the case of the rotational parameters.
The spectroscopic parameters from the present work are accurate enough for all types of radio observations. A calculation at 300 K up to 1.5 THz contains only very few lines with calculated uncertainties exceeding 0.1 MHz; these very few lines should probably be viewed with some caution. This is very different to the line list prior to this work. A calculated spectrum at 125 K contained several fairly strong transitions with uncertainties of around 10 MHz in the range of the PILS data; these transitions are only about a factor of 5 weaker than the strongest transitions in this range. These are a-type transitions with low values of Ka and ΔKa = 2; their presently calculated frequencies differ by about three times the initial uncertainties. Several other fairly strong transitions had uncertainties around 1 MHz or more, and deviations of up three times these uncertainties are quite common. Stick spectra of the rotational and rotation-tunneling transitions are shown in Fig. 6. While the rotation-tunneling transitions are usually much weaker, relatively strong transitions appear in the 300 to 700 GHz region.
The rotation of the RAS with respect to the principal inertial axis system is derived as sin 2θ = 2Fab/(A − B) (Pickett 1972). Its value of 0.557884 (39)° appears to be a fairly typical one. Data derived for selected other molecules are, for example, 0.8390° (ab-plane) and 1.7892° (bc) for aGg′-ethylene glycol (Christen & Müller 2003), as well as 0.073° (ac) and 0.286° (bc) for propargyl alcohol (Pearson & Drouin 2005).
A comparison of our present spectroscopic parameters with those from previous work is meaningful for low order parameters. The rotation-tunneling interaction was considered by Turner et al. (1984), by Firth et al. (1991), and by Baba et al. (1999). Rotational and quartic centrifugal distortion parameters, the energy difference, the interaction parameter Fab, and its distortion correction Fab,J were determined in all three studies. The agreement among the rotational parameters is good, while the agreement is only good for the quartic parameters from the latest study (Baba et al. 1999) and reasonable in the case of the other two studies. It is instructive to compare the energy differences and interaction parameters from previous work with ours. The energy differences are 647049 (12) MHz (Turner et al. 1984), 647094.9 (51) MHz (Firth et al. 1991), and 647046.208 (19) MHz (Baba et al. 1999), compared to 647046.1871 (37) MHz from our study. The agreement is excellent in the case of the latest study and reasonable for the earlier ones; the smaller uncertainties reflect to some degree the extent of the corresponding data set. The interaction parameters in the same order are 45.51 (4) MHz, 46.01 (2) MHz, and 45.8965 (82) MHz, compared to 45.3158 (32) MHz from our study. The agreement is fairly good in all cases, the somewhat large deviation from the latest study with respect to the combined uncertainties is probably caused by a much larger set of parameters needed to fit our very large data set. Firth et al. (1991) also reported a nearly full set of sextic distortion parameters while Baba et al. (1999) reported a set of four diagonal distortion parameters for each tunneling state plus a value for Fab,K; the agreement with our values is reasonable.
Baughcum et al. (1984) evaluated the tunneling barrier height for the main isotopolog as ~6.6 kcal mol−1 or ~2300 cm−1. While the authors pointed out that the small amount of data for the main isotopic species leads to a great uncertainty of this barrier height, we note that we are not aware of later attempts to determine the barrier height in similar ways with more data, possibly because the methods were deemed to be too simple. The ~6.6 kcal mol−1 may be compared with 4.1 kcal mol−1 or about 1400 cm−1 derived from a theoretical potential energy surface (PES) (Wang et al. 2008).
The accurate derivation of tunneling splittings from theoretical PESs is challenging. Wang et al. (2008) present ground state splittings of 21.6 and 22.6 cm−1 from calculations in Cartesian and normal coordinates, respectively, with estimated uncertaities of 2–3 cm−1. Both values compare very favorably with our present 21.58313759 (12) cm−1, which in turn is very similar to most earlier, less accurate values, as discussed further above. Lüttschwager et al. (2013) determined experimentally tunneling splittings in excited vibrational states of 3-hydroxypropenal and compare the values with those from several theoretical calculations. While the agreement is in all but one instances very good for the ground state splitting, the agreement is less favorable in excited vibrational states.
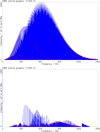 |
Fig. 6 Stick spectra of 3-hydroxypropenal. The upper trace shows the rotational transitions with b-type selection rules, and the lower trace displays the rotation-tunneling transitions with a-type selection rules. |
6 Observations of 3-hydroxypropenal in IRAS16293 B
6.1 Analysis of the ALMA-PILS observations
The 3-hydroxypropenal molecule has been tentatively detected in the solar-type protostar IRAS16293 B by Coutens et al. (2022). The lines have been searched for in PΓLS carried out with ALMA. This survey covers a large spectral range between 329.1 and 362.9 GHz with an angular resolution of 0.5″ (~60 au) and a spectral resolution of 0.244 MHz (~0.2 km s−1). The data reduction process as well as additional characteristics of the observations are presented in Jørgensen et al. (2016). Thanks to its high sensitivity (rms ~ 4–5 mJy beam−1 per km s−1), a large variety of complex organic molecules have been detected in this survey. Local thermodynamic equilibrium (LTE) models have been carried out to reproduce the observations and derive the column densities and excitation temperatures of the different molecules. In particular, different excitation temperatures have been found in this source. Some molecules, such as NH2CHO, NH2CN, CH3OH, HCOOH, CH3OCHO, CH2OHCHO, and CH3CH2OH show a high excitation temperature of 300 K (Coutens et al. 2016, 2018; Jørgensen et al. 2018), while others (c-C2H4O, CH3CHO, CH3OCH3, CH3CCH, CH3CN, C2H5CN) show a lower excitation temperature of 125 K (Lykke et al. 2017; Jørgensen et al. 2018; Calcutt et al. 2018, 2019). Based on the previous catalog of 3-hydroxypropenal lines, it was not possible to distinguish between an excitation temperature of 125 K and 300 K for this species. Indeed, the lines with high Eup that should allow us to constrain the excitation temperature, showed too large frequency uncertainties. Given the very high line density of this survey, it was not possible to know if they were detected. Two column densities were consequently derived: N = 1.0 × 1015 cm−2 for Tex = 125 K and N = 1.8 × 1015 cm−2 for Tex = 300 K.
The results of this new spectroscopic study enable us to search for the lines of 3-hydroxypropenal of high excitation. We ran two LTE models with the previously derived best-fit parameters and compared them to the observations. A similar result is obtained for the 11 lines attributed to 3-hydroxypropenal, which showed moderate Eup values (<300 K) and small frequency uncertainties (see Fig. 2 of Coutens et al. 2022). If we check the full survey, no major issue is seen for the model with Tex = 125 K. However, the model with Tex = 300 K and N = 1.8 × 1015 cm−2 does not reproduce the observations. Indeed, several undetected lines (~30) are predicted above 3σ with this model (see Fig. 7). A better agreement would be obtained if we lower the column density at 1.0 × 1015 cm−2. But several detected lines (Fig. 2 of Coutens et al. 2022) are in that case under-produced in terms of intensity. In summary, an excitation temperature of 125 K is more appropriate than 300 K for this species.
Even if we do not detect any high excitation lines of 3-hydroxypropenal in the PILS data, it is important to note that such a spectroscopic study is useful, not only to constrain the excitation temperature of the molecule in IRAS16293 B but also for its search in other sources with potentially higher excitation temperatures. The shift of some of the high excitation lines of 3-hydroxypropenal is significant. For example, in Fig. 8, we show that previous high excitation transitions that were matching some line emission in IRAS16293 B are now predicted in areas free of lines. A proper line identification of this molecule in other sources is now possible.
6.2 Search for additional transitions of 3-hydroxypropenal in the ALMA archive
We searched the ALMA archive for projects possibly covering additional transitions to further strengthen the assignment of 3-hydroxypropenal toward IRAS16293 B. We used the ATOMIS3 web application (Coutens et al. 2023) to list all the ALMA archival observations that cover transitions of 3-hydroxypropenal with Aij ≥ 5 × 10⁻⁴ s−1 and Eup ≤ 500 K. The angular resolution was limited to the range 0.3–0.7″ so that it is relatively close to the PILS resolution (~0.5″). We requested data with a sensitivity better than 10 mJy beam−1 for a bin width of 1 km s−1 and only selected observational results with a spectral resolution better than 0.5 km s−1. Table 2 summarizes the observational projects that cover such transitions (apart from the PILS project).
After checking the weblog for each project, we downloaded the FITS cubes provided on the ALMA archive for all the listed transitions and extracted the spectra at the position studied in PILS (αJ2000 = 16h32m22s.58, δJ2000 = −24°28′32.8″). For the project 2013.1.00061.S, the data that we used are those reduced by Andreu et al. (in prep.) with a restoring beam of 0.5″ similar to what has been done for PILS. We could clearly see that the continuum was not properly subtracted at the extracted position for two spectral windows of the project 2022.1.00554.S (296.4 and 309.7 GHz). We corrected it by fitting a one-order polynomial fit on the channels that do not seem to show any line emission.
In total, thanks to the ALMA archival data, we detected seven additional lines of 3-hydroxypropenal with a signal-to-noise ratio of about 3σ or more (see Fig. 9). The model derived with the PILS data is in very good agreement with the observations. Figure 10 shows the lines that are not detected. These transitions are not detected either because their predicted intensities are too faint compared to the noise level or because they are blended with other species. Table 2 summarizes for each transition if the line is detected or not with, in the latter case, the reason for the non-detection. With this new spectroscopic study, the seven additional detected transitions and the good agreement of their intensities with the model, the detection of HOCHCHCHO can now be considered as secure. The excitation temperature of ~125 K and the column density of ~1.0 × 1015 cm−2 of this molecule are also reliable, which provides useful constraints for chemical models (Coutens et al. 2022).
7 Conclusions and outlook
We have obtained a very large line list of the tunneling-rotation spectrum of 3-hydroxypropenal in the course of the present investigation that covers large frequency regions and, more importantly, large ranges of quantum numbers. This line list was the basis of an extensive and very accurate set of spectroscopic parameters from which the entire tunneling-rotation spectrum of the molecule in the ground vibrational state can be derived with great accuracy. This new calculation enabled us to settle the issue of the excitation temperature of 3-hydroxypropenal in the warm part of the molecular cloud surrounding the protostar IRAS16293 B, as we were able to rule out Tex ≈ 300 K and establish Tex ≈ 125 K. The detection of seven additional lines in the ALMA archive raised the detection from somewhat tentative to secure. With the new data set, it is now possible to search for 3-hydroxypropenal in star-forming regions with considerably higher Tex.
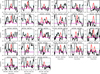 |
Fig. 7 Undetected lines of 3-hydroxypropenal that are predicted above 3σ with the new spectroscopic data and the parameters previously constrained by Coutens et al. (2022) for an excitation temperature Tex = 300 K. The PILS observations are in black. The model in red has been obtained with the best-fit parameters derived by Coutens et al. (2022) for Tex = 300 K, i.e. with a column density N=l.8×l015 cm2. For comparison, the model obtained for Tex = 125 K (N = 1.0 × 1015 cm2) is added in magenta. The cyan dotted line represents the 3 rms level per 0.33 km s−1 (1/3 of the line width). |
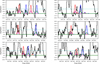 |
Fig. 8 Examples of high excitation transitions of 3-hydroxypropenal that have been significantly shifted with the new spectroscopic study. Models obtained with previous spectroscopy are indicated in blue (Tex = 300 K) and green (Tex = 125 K). The new models are in red (Tex = 300 K) and magenta (Tex = 125 K). The column densities are N = 1.0 × 1015 cm−2 for Tex = 125 K and N = 1.8 × 1015 cm−2 for Tex = 300 K. An absorption due to a nearby bright line is present around 343.14 GHz. The cyan dotted line represents the 3 rms level per 0.33 km s−1 (1/3 of the line width). |
 |
Fig. 9 Detected lines of 3-hydroxypropenal found in the ALMA archive (in black). The model in magenta corresponds to N = 1.0 × 1015 cm−2, Tex = 125 K, a source size of 0.5″ and a FWHM of 1 km s−1. The cyan dotted line represents the 3 rms level per 0.33 km s−1 (1/3 of the line width). |
 |
Fig. 10 Non-detected lines of 3-hydroxypropenal in the ALMA archive (in black). The model in magenta corresponds to N = 1.0 × 1015 cm−2, Tex = 125 K, a source size of 0.5″ and a FWHM of 1 km s−1. The cyan dotted line represents the 3 rms level per 0.33 km s−1 (1/3 of the line width). |
Observations covering transitions of 3-hydroxypropenal in the ALMA archive.
Acknowledgements
This paper makes use of the following ALMA data: ADS/ JAO.ALMA#2013.1.00278.S, ADS/JAO.ALMA#2013.1.00061.S, ADS/JAO. ALMA#2017.1.01565.S, ADS/JAO.ALMA#2021.1.00544.S, and ADS/JAO. ALMA#2022.1.00554.S. ALMA is a partnership of ESO (representing its member states), NSF (USA) and NINS (Japan), together with NRC (Canada) and NSC and ASIAA (Taiwan), in cooperation with the Republic of Chile. The Joint ALMA Observatory is operated by ESO, AUI/NRAO and NAOJ. The work in Lille and Rennes was supported by the Programme National “Physique et Chimie du Milieu Interstellaire” (PCMI) of CNRS Terre @ Univers with CNRS Physique & CNRS Chimie, co-funded by CEA and CNES. HSPM acknowledges support by the Deutsche Forschungsgemeinschaft via the collaborative research centers SFB 956 (project ID 184018867), subproject B3, and SFB 1601 (project ID 500700252), subprojects Inf and A4. AC received funding from the European Research Council (ERC) under the European Union’s Horizon 2020 research and innovation programme (ERC Starting Grant “Chemtrip”, grant agreement no. 949278). JKJ is supported by the Independent Research Fund Denmark (grant number 0135-00123B). Our research benefited from NASA’s Astrophysics Data System (ADS).
References
- Baba, T., Tanaka, T., Morino, I., Yamada, K. M. T., & Tanaka, K. 1999, J. Chem. Phys., 110, 4131 [NASA ADS] [CrossRef] [Google Scholar]
- Baughcum, S. L., Duerst, R. W., Rowe, W. F., Smith, Z., & Wilson, E. B. 1981, J. Am. Chem. Soc., 103, 6296 [CrossRef] [Google Scholar]
- Baughcum, S. L., Smith, Z., Wilson, E. B., & Duerst, R. W. 1984, J. Am. Chem. Soc., 106, 2260 [CrossRef] [Google Scholar]
- Calcutt, H., Jørgensen, J. K., Müller, H. S. P., et al. 2018, A&A, 616, A90 [NASA ADS] [CrossRef] [EDP Sciences] [Google Scholar]
- Calcutt, H., Willis, E. R., Jørgensen, J. K., et al. 2019, A&A, 631, A137 [NASA ADS] [CrossRef] [EDP Sciences] [Google Scholar]
- Christen, D., & Müller, H. S. P. 2003, Phys. Chem. Chem. Phys., 5, 3600 [NASA ADS] [CrossRef] [Google Scholar]
- Coutens, A., Jørgensen, J. K., van der Wiel, M. H. D., et al. 2016, A&A, 590, A6 [Google Scholar]
- Coutens, A., Willis, E. R., Garrod, R. T., et al. 2018, A&A, 612, A107 [NASA ADS] [CrossRef] [EDP Sciences] [Google Scholar]
- Coutens, A., Loison, J. C., Boulanger, A., et al. 2022, A&A, 660, A6 [Google Scholar]
- Coutens, A., Ben Hmida, S., & Glorian, J. M. 2023, in SF2A-2023: Proceedings of the Annual meeting of the French Society of Astronomy and Astrophysics, 311 [Google Scholar]
- Endres, C. P., Schlemmer, S., Schilke, P., Stutzki, J., & Müller, H. S. P. 2016, J. Mol. Spectrosc., 327, 95 [NASA ADS] [CrossRef] [Google Scholar]
- Firth, D. W., Beyer, K., Dvorak, M. A., et al. 1991, J. Chem. Phys., 94, 1812 [NASA ADS] [CrossRef] [Google Scholar]
- Isaacson, A. D., & Morokuma, K. 1975, J. Am. Chem. Soc., 97, 4453 [CrossRef] [Google Scholar]
- Jørgensen, J. K., van der Wiel, M. H. D., Coutens, A., et al. 2016, A&A, 595, A117 [Google Scholar]
- Jørgensen, J. K., Müller, H. S. P., Calcutt, H., et al. 2018, A&A, 620, A170 [Google Scholar]
- Karlström, G., Wennerström, H., Jónsson, B., et al. 1975, J. Am. Chem. Soc., 97, 4188 [CrossRef] [Google Scholar]
- Lüttschwager, N. O. B., Wassermann, T. N., Coussan, S., & Suhm, M. A. 2013, Mol. Phys., 111, 2211 [CrossRef] [Google Scholar]
- Lykke, J. M., Coutens, A., Jørgensen, J. K., et al. 2017, A&A, 597, A53 [NASA ADS] [CrossRef] [EDP Sciences] [Google Scholar]
- Margulès, L., McGuire, B. A., Senent, M. L., et al. 2017, A&A, 601, A50 [NASA ADS] [CrossRef] [EDP Sciences] [Google Scholar]
- Margulès, L., Motiyenko, R. A., & Demaison, J. 2020, J. Quant. Spec. Radiat. Transf., 253, 107153 [CrossRef] [Google Scholar]
- Margulès, L., Coutens, A., Ligterink, N. F. W., et al. 2023, MNRAS, 524, 1211 [CrossRef] [Google Scholar]
- Müller, H. S. P., Schlöder, F., Stutzki, J., & Winnewisser, G. 2005, J. Mol. Struct., 742, 215 [Google Scholar]
- Müller, H. S. P., Belloche, A., Xu, L.-H., et al. 2016, A&A, 587, A92 [NASA ADS] [CrossRef] [EDP Sciences] [Google Scholar]
- Müller, H. S. P., Garrod, R. T., Belloche, A., et al. 2023, MNRAS, 523, 2887 [CrossRef] [Google Scholar]
- Pearson, J. C., & Drouin, B. J. 2005, J. Mol. Spectrosc., 234, 149 [NASA ADS] [CrossRef] [Google Scholar]
- Pickett, H. M. 1972, J. Chem. Phys., 56, 1715 [NASA ADS] [CrossRef] [Google Scholar]
- Pickett, H. M. 1991, J. Mol. Spectrosc., 148, 371 [Google Scholar]
- Rowe, W. F. J., Duerst, R. W., & Wilson, E. B. 1976, J. Am. Chem. Soc., 98, 4021 [CrossRef] [Google Scholar]
- Stolze, M., Hübner, D., & Sutter, D. H. 1983, J. Mol. Struct., 97, 243 [NASA ADS] [CrossRef] [Google Scholar]
- Trivella, A., Coussan, S., & Chiavassa, T. 2008, Synth. Commun., 38, 3285 [CrossRef] [Google Scholar]
- Turner, P., Baughcum, S. L., Coy, S. L., & Smith, Z. 1984, J. Am. Chem. Soc., 106, 2265 [CrossRef] [Google Scholar]
- Wang, Y., Braams, B. J., Bowman, J. M., Carter, S., & Tew, D. P. 2008, J. Chem. Phys., 128, 224314 [NASA ADS] [CrossRef] [Google Scholar]
- Zakharenko, O., Motiyenko, R. A., Margulès, L., & Huet, T. R. 2015, J. Mol. Spectrosc., 317, 41 [NASA ADS] [CrossRef] [Google Scholar]
ALMA archive TOol for Molecular Investigations in Space, https://atomis.irap.omp.eu/
All Tables
Average spectroscopic parameters X (MHz) and energy E with rotational corrections or changes ΔX from average spectroscopic parameters of 3-hydroxypropenal along with interaction parameters determined in the present study.
All Figures
|
Fig. 1 Model of the 3-hydroxypropenal molecule. Carbon atoms are symbolized by gray spheres, hydrogen atoms are indicated by small, light gray spheres, and oxygen atoms by red spheres. The two equivalent minimum structures are shown at the outside while the transition state with C2v symmetry is displayed in the center. |
| In the text | |
|
Fig. 2 Section of the rotational spectrum of 3-hydroxypropenal. The transitions are within υ = 0− and have |
| In the text | |
|
Fig. 3 Section of the rotational spectrum of 3-hydroxypropenal. The transitions are within υ = 0+ and have |
| In the text | |
|
Fig. 4 Section of the reduced energy plot of 3-hydroxypropenal. Data points of υ = 0+ are shown in blue, those of υ = 0− in red; selected Ka series are indicated to the left. Resonant interactions with ΔKc = 2 are indicated by yellow circles. They occur at Kc = 43 for υ = 0+ and Kc = 45 for υ = 0− for 45 ≤ J ≤ 48. The resonant Kc pair increases gradually with J, Kc = 44 and 46 are resonant for 49 ≤ J ≤ 58. Two ΔKa = 3 interactions are resonant at Ka = 21/18 and J = 35 as well as Ka = 22/19 and J = 49 for ortho and J = 50 for para, which is signaled by green circles. Further ΔKa = 3 or 5 interactions are usually more local and are not highlighted. |
| In the text | |
|
Fig. 5 Section of the rotational spectrum of 3-hydroxypropenal in the lower trace. The |
| In the text | |
|
Fig. 6 Stick spectra of 3-hydroxypropenal. The upper trace shows the rotational transitions with b-type selection rules, and the lower trace displays the rotation-tunneling transitions with a-type selection rules. |
| In the text | |
|
Fig. 7 Undetected lines of 3-hydroxypropenal that are predicted above 3σ with the new spectroscopic data and the parameters previously constrained by Coutens et al. (2022) for an excitation temperature Tex = 300 K. The PILS observations are in black. The model in red has been obtained with the best-fit parameters derived by Coutens et al. (2022) for Tex = 300 K, i.e. with a column density N=l.8×l015 cm2. For comparison, the model obtained for Tex = 125 K (N = 1.0 × 1015 cm2) is added in magenta. The cyan dotted line represents the 3 rms level per 0.33 km s−1 (1/3 of the line width). |
| In the text | |
|
Fig. 8 Examples of high excitation transitions of 3-hydroxypropenal that have been significantly shifted with the new spectroscopic study. Models obtained with previous spectroscopy are indicated in blue (Tex = 300 K) and green (Tex = 125 K). The new models are in red (Tex = 300 K) and magenta (Tex = 125 K). The column densities are N = 1.0 × 1015 cm−2 for Tex = 125 K and N = 1.8 × 1015 cm−2 for Tex = 300 K. An absorption due to a nearby bright line is present around 343.14 GHz. The cyan dotted line represents the 3 rms level per 0.33 km s−1 (1/3 of the line width). |
| In the text | |
|
Fig. 9 Detected lines of 3-hydroxypropenal found in the ALMA archive (in black). The model in magenta corresponds to N = 1.0 × 1015 cm−2, Tex = 125 K, a source size of 0.5″ and a FWHM of 1 km s−1. The cyan dotted line represents the 3 rms level per 0.33 km s−1 (1/3 of the line width). |
| In the text | |
|
Fig. 10 Non-detected lines of 3-hydroxypropenal in the ALMA archive (in black). The model in magenta corresponds to N = 1.0 × 1015 cm−2, Tex = 125 K, a source size of 0.5″ and a FWHM of 1 km s−1. The cyan dotted line represents the 3 rms level per 0.33 km s−1 (1/3 of the line width). |
| In the text | |
Current usage metrics show cumulative count of Article Views (full-text article views including HTML views, PDF and ePub downloads, according to the available data) and Abstracts Views on Vision4Press platform.
Data correspond to usage on the plateform after 2015. The current usage metrics is available 48-96 hours after online publication and is updated daily on week days.
Initial download of the metrics may take a while.