| Issue |
A&A
Volume 666, October 2022
|
|
|---|---|---|
| Article Number | A158 | |
| Number of page(s) | 12 | |
| Section | Atomic, molecular, and nuclear data | |
| DOI | https://doi.org/10.1051/0004-6361/202244376 | |
| Published online | 21 October 2022 | |
Millimetre-wave spectroscopy of 2-hydroxyprop-2-enal and an astronomical search with ALMA★
1
Department of Analytical Chemistry, University of Chemistry and Technology,
Technická 5,
166 28
Prague 6, Czech Republic
e-mail: This email address is being protected from spambots. You need JavaScript enabled to view it.
; This email address is being protected from spambots. You need JavaScript enabled to view it.
2
Institut de Recherche en Astrophysique et Planétologie (IRAP), Université de Toulouse, UPS, CNRS, CNES,
9 av. du Colonel Roche,
31028
Toulouse Cedex 4, France
3
Institut des Sciences Moléculaires (ISM), CNRS, Université Bordeaux,
351 cours de la Libération,
33400
Talence, France
4
Niels Bohr Institute, University of Copenhagen,
Øster Voldgade 5–7,
1350
Copenhagen K, Denmark
5
Max-Planck-Institut für Radioastronomie,
Auf dem Hügel 69,
53121
Bonn, Germany
Received:
29
June
2022
Accepted:
30
August
2022
Abstract
Context. Several sugar-like molecules have been found in the interstellar medium (ISM). The molecule studied in this work, 2-hydroxyprop-2-enal, is among the candidates to be searched for, as it is a dehydration product of C3 sugars and contains structural motifs that are typical for some interstellar molecules. Furthermore, it has recently been predicted that it is more abundant in the ISM than its tentatively detected isomer 3-hydroxypropenal.
Aims. So far, only low-frequency microwave data of 2-hydroxyprop-2-enal have been published. The aim of this work is to deepen our knowledge about the millimetre-wave spectrum of 2-hydroxyprop-2-enal, enabling its detailed search towards astronomical objects. In particular, we target the solar-type protostar IRAS 16293-2422 and the star-forming region Sagittarius (Sgr) B2(N).
Methods. The rotational spectrum of 2-hydroxyprop-2-enal was measured and analysed in the frequency regions of 128-166 GHz and 285-329 GHz. The interstellar exploration towards IRAS 16293-2422 was based on the Atacama Large Millimeter/submillimeter Array (ALMA) data of the Protostellar Interferometric Line Survey (PILS). We also used the imaging spectral line survey ReMoCA performed with ALMA towards Sgr B2(N) to search for 2-hydroxyprop-2-enal in the ISM. We modelled the astronomical spectra under the assumption of local thermodynamic equilibrium (LTE).
Results. We provide laboratory analysis of hundreds of rotational transitions of 2-hydroxyprop-2-enal in the ground state and the lowest lying excited vibrational state. We report its non-detection towards IRAS 16293 B. The 2-hydroxyprop-2-enal/3-hydroxypropenal abundance ratio is estimated to be ≲0.9–1.3, in agreement with the predicted value of ~1.4. We report the non-detection of 2-hydroxyprop-2-enal towards the hot molecular core Sgr B2(N1), and we did not detect the related aldehydes 2-hydroxypropanal and 3-hydroxypropenal either. We find that these three molecules are at least nine, four, and ten times less abundant than acetaldehyde in this source, respectively.
Conclusions. Despite the non-detections of 2-hydroxyprop-2-enal, the results of this work represent a significant improvement on previous investigations in the microwave region and meet the requirements for further searches for this molecule in the ISM.
Key words: astrochemistry / ISM: molecules / line: identification / ISM: individual objects: IRAS 16293-2422 / ISM: individual objects: Sagittarius B2 / astronomical databases: miscellaneous
Table 5 is only available at the CDS via anonymous ftp to cdsarc.u-strasbg.fr (130.79.128.5) or via http://cdsarc.u-strasbg.fr/viz-bin/cat/J/A+A/666/A158
© J. Koucký et al. 2022
 Open Access article, published by EDP Sciences, under the terms of the Creative Commons Attribution License (https://creativecommons.org/licenses/by/4.0), which permits unrestricted use, distribution, and reproduction in any medium, provided the original work is properly cited.
This article is published in open access under the Subscribe-to-Open model. This email address is being protected from spambots. You need JavaScript enabled to view it. to support open access publication.
1 Introduction
The discovery of the first interstellar aldehyde, formaldehyde, dates back to 1969 (Snyder et al. 1969). Since then, eight more aldehydes, including their protonated, sulphur, and cyano analogues, have been detected by astronomical observations (McGuire 2022). One of them is 2-hydroxyethanal (Hollis et al. 2000), commonly known as glycolaldehyde, a prebiotic, sugar-related molecule that fulfils the empirical formula CnH2nOn (or Cn(H2O)n), which initiated the search for sugars in the interstellar medium (ISM). Glyceraldehyde, as the next member of the homologous series of carbohydrates, with the formula C3H6O3, has not yet been successfully detected in the ISM (Hollis et al. 2004; Jiménez-Serra et al. 2020). However, its presence there was suggested by laboratory experiments with interstellar ice analogues (Layssac et al. 2020; Fedoseev et al. 2017). The same molecular formula belongs to the other sugar molecule, dihydroxyacetone (glycerone, DHA), a simple ketotriose. It was identified in the Murchison meteorite (Cooper et al. 2001), and therefore awakened interest in its interstellar search. The initial survey was performed using the Caltech Submillimeter Observatory with the tentative detection of nine emission lines in Sagittarius B2 (N-LMH, Widicus Weaver & Blake 2005). However, other studies have not confirmed the presence of DHA there (Jiménez-Serra et al. 2020; Apponi et al. 2006). The longer sugar with four carbon atoms, erythrulose, was another candidate sought in the ISM, although regrettably with a negative outcome (Insausti et al. 2021).
Lactaldehyde (2-hydroxypropanal, or hydroxypropionaldehyde), another oxygen-bearing member of the C3 family of molecules and a methyl derivative of glycolaldehyde, has been sought, so far unsuccessfully, in three star-forming regions (Alonso et al. 2019). Nevertheless, several attempts have been undertaken to discover lactaldehyde isomers with different results. The only three C3H6O2 molecules found in the ISM were ethyl formate (Belloche et al. 2009; Tercero et al. 2013), methyl acetate (Tercero et al. 2013), and hydroxyacetone (Zhou et al. 2020). Three carbon chain aldehydes discovered in the ISM are propanai (Hollis et al. 2004; Goesmann et al. 2015; Lykke et al. 2017; Yarnall et al. 2020), propenal (Dickens et al. 2001; Hollis et al. 2004; Agúndez et al. 2021; Manigand et al. 2021), and propynal (Irvine et al. 1988). Propenal is presumed to be a prebiotic species not only because of its formation during the decomposition of sugars (Moldoveanu 2010; Bermúdez et al. 2013), but also because it acts as an intermediate in the prebiotic synthesis of the amino acid methionine (Van Trump & Miller 1972). Propenal also contains a vinyl group, which is a structural motif present in several interstellar molecules; one of the examples is vinyl alcohol (Turner & Apponi 2001; Agúndez et al. 2021). Propenal and other aldehydes, such as propanal, were extensively studied in the (sub-/)millimetre-wave region. These laboratory studies are not strictly limited to the astronomical applications but also serve to help us better understand the effects in the spectra, such as large amplitude motions or perturbations (Daly et al. 2015; Zingsheim et al. 2017, 2022).
Our molecule of interest, 2-hydroxyprop-2-enal (or 2-hydroxyacrylaldehyde, see Fig. 1), combines the structural motifs of the aforementioned vinyl alcohol and propenal. It belongs to the C3H4O2 family of isomers. The isomerisation enthalpies for several members of this family were calculated by Karton & Talbi (2014). Some stable C3H4O2 isomers – acrylic acid (Calabrese et al. 2015; Alonso et al. 2015; Coutens et al. 2022), vinyl formate (Alonso et al. 2016; Coutens et al. 2022) and 3-hydroxyprop-2-enal (Coutens et al. 2022) – have already been the subject of astrophysical investigations. Another attractive feature of 2-hydroxyprop-2-enal is its tautomeric relationship with methylglyoxal; see Fig. 2. Methylglyoxal was discovered, for example, in pre-cometary ice analogues (de Marcellus et al. 2015). In addition, the prebiotic importance of 2-hydroxyprop-2-enal lies in the methylglyoxal synthetase-dependent decomposition of dihydroxyacetone phosphate, where it is created as a transient intermediate (Rose & Nowick 2002). In addition, it has been suggested that 2-hydroxyprop-2-enal is formed in irradiated methanol and methanol-carbon monoxide ice analogues (Maity et al. 2015). The microwave spectra of 2-hydroxyprop-2-enal were studied for the very first time in 2003 (Lovas et al. 2003) up to 25 GHz. The species was identified as a decomposition product of glyceraldehyde at a nozzle temperature of 135 °C.
The predictions of the rotational transitions to the frequency range of common surveys, such as surveys performed with the Atacama Large Millimeter/submillimeter Array (ALMA), for instance the Re-Exploring Molecular Complexity with ALMA survey (ReMoCA) that covers the frequency range 84–114 GHz (Belloche et al. 2019) or the Protostellar Interferometric Line Survey (PILS) covering 329–363 GHz (Jørgensen et al. 2016), are rather unreliable if they are based on low-frequency data. Despite a slight setback in finding its parent molecules in space, there were other similar species with successful detections in the ISM. The data from the ALMA-PILS survey (Coutens et al. 2022) indicate that 2-hydroxyprop-2-enal is a substantiate candidate molecule for interstellar search.
The outline of the paper is as follows. The experimental details on the preparation of the compound and the measurements are described in Sect. 2. Notes about quantum-chemical calculations are to be found in Sect. 3. The spectral analysis of the ground state and the lowest lying excited vibrational state is provided in Sect. 4. The searches for 2-hydroxyprop-2-enal in the ISM are covered in Sects. 5 and 6. Finally, Sect. 7 is dedicated to our conclusions.
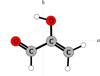 |
Fig. 1 Structure of 2-hydroxyprop-2-enal displayed in the ab inertial plane. |
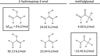 |
Fig. 2 Keto-enol tautomeric relationship of 2-hydroxyprop-2-enal and methylglyoxal. The most stable isomers are highlighted. The structures are accompanied by their relative zero-point corrected energy (with respect to the most stable conformer of 2-hydroxyprop-2-enal) calculated at B3LYP/6-311++G(d,p) level of theory and basis set. |
2 Experiments
2.1 Species preparation
The compound 2-hydroxyprop-2-enal was prepared in situ during the experiment. Initially, we tried two ways to synthesise the species according to the results reported by Lovas et al. (2003). Both were based on dehydration of the parent molecule, that is, glyceraldehyde (HOCH2CH(OH)CHO) or dihydroxyacetone (HOCH2C(O)CH2OH). The precursors were purchased from Sigma Aldrich. Both of them proved to be a good source for producing the desired species in our experiment. Dihydroxyacetone as a precursor turned out to be a cost-effective solution, and therefore all further measurements were carried out with it. The precursor in the solid phase was heated in a glass vessel to approximately 65 °C, so that the rotational lines of 2-hydroxyprop-2-enal were distinguished and dihydroxyacetone did not melt. Apart from the aimed 2-hydroxyprop-2-enal, the spectrum was overflowing with, of course, the unreacted precursor and by-products, such as methanol, ethanol, or transmethylglyoxal. Trans-methylglyoxal was also observed in the original microwave study (Lovas et al. 2003).
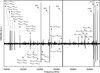 |
Fig. 3 Segment of spectra showing an overview of coalesced and distinguished lines. Arrows pointing upwards belong to the ground state transitions and arrows pointing downwards represent the excited vibrational state. Several transitions of ethanol (EtOH) and methanol (MeOH) are shown as well. |
2.2 Experiment
The spectrum of 2-hydroxyprop-2-enal was recorded with the upgraded Prague semiconductor millimetre-wave spectrometer described elsewhere (Kania et al. 2006) in two spectral ranges (128–166 GHz and 285–329 GHz). The sample pressure in the measuring glass cell varied from 15 to 30 μbar. Two different glass cells with lengths of 2.3 m and 2.8 m were used, and the optical path of the cells was doubled to 4.6 m and 5.6 m, respectively, using a roof-top mirror. For the spectral measurements, we adopted the same procedure as for 2-iminopropanenitrile (Luková et al. 2022), which also revealed relatively low stability in the cell. The sample was introduced to the chamber and was kept there without pumping until the intensity of a selected rotational line decreased by 25% of its original intensity. Subsequently, the measuring cell was evacuated and filled again with the fresh sample. A frequency modulation of 28 kHz and a second harmonic lock-in detection were employed. The accuracy of the isolated measured rotational lines was 30 kHz.
3 Quantum-chemical calculations
Although the values of the rotational constants, together with the quartic centrifugal distortion constants for 2-hydroxyprop-2-enal, are known, we performed quantum-chemical calculations employing the density functional theory (DFT) combined with the B3LYP functional and Pople’s basis set with added polarisation and diffusion functions (6-311++G(d,p)). The structure optimisation, analytical calculations of second energy derivatives followed by their numerical differentiation by finite-difference methods, were performed using very tight convergence criteria and an ultra-fine grid. The harmonic and anharmonic force field calculations up to cubic level led to estimations of, for example, vibrational energies and sextic centrifugal distortion constants that supported the spectral analysis. All calculations were carried out with Gaussian 16 (Frisch et al. 2016). The four lowest-energy conformers of 2-hydroxyprop-2-enal and their spectroscopic properties are shown in Table A.1.
4 Spectroscopic results and discussion
4.1 Ground state
2-hydroxyprop-2-enal belongs to the Cs symmetry point group with a Ray’s asymmetry parameter of κ = −0.6, making it a prolate asymmetric rotor. It is a planar molecule with heavy atoms located in the ab inertial plane, as shown in Fig. 1. The previously determined values of electric dipole moments were |μα| = 1.146(10) D, |μb| = 1.560(12) D, and |μα| = 0 D from symmetry (Lovas et al. 2003). Due to the high density of rotational lines originating not just from 2-hydroxyprop-2-enal, but also from the aforementioned molecules, we started the analysis in the 285 GHz region where easily identifiable groups of transition lines were expected to be observed. In series with low values of the Ka quantum number, each line comprises of two b-type and two a-type transitions, as shown in Fig. 3.
As this quantum number progressively increases, the lines are separated into quadruplets with higher-intensity b-type lines surrounding a-type transitions. With the initial set of transitions being fitted and predictions made, we proceeded to analyse the lower frequency part of the spectrum where we sought resembling quadruplet patterns. Apart from the R-branch transitions, rotational lines belonging to Q-branch transitions were searched and analysed as well. The search was supported by the graphical help of the Loomis-Wood-type plot from Kisiel’s Assignment and Analysis of Broadband Spectra package (Kisiel et al. 2005, 2012). Together with the data from the previous work (Lovas et al. 2003), a total set of 968 rotational transitions was employed in the final fit, out of which 594 belong to the R-branch with 340 a- and 254 b-type transitions, and 374 belong to the g-branch b-type transitions. Lines in close proximity to the transitions of interfering species and lines with deformed shapes in both branches were excluded. The Pickett’s programme package SPFIT/SPCAT (Pickett 1991) with Watson’s A-reduced Hamilto-nian in Ir representation were employed throughout the analysis. The resulting constants are summarised in Table 1.
The analysis of the ground state provides an extended set of spectroscopic constants, which is in excellent agreement with quantum-chemical calculations, as depicted in Table 1. All constants were improved by up to three orders of magnitude and a set of sextic centrifugal distortion constants has been determined for the first time.
The partition functions needed to calculate the column densities or their upper limits are provided in Table 2. The rotational partition functions for different temperatures were obtained from SPCAT covering all rotational states up to j = 100. The vibrational partition functions were calculated using Eq. (3.60) from Gordy & Cook (1984), employing the anharmonic frequencies of 21 vibrational modes shown in Table A.2.
Spectroscopic constants of 2-hydroxyprop-2-enal in the ground state (G.S.) and the lowest lying excited vibrational state (A-reduction, Ir-representation).
Partition functions for the ground state of 2-hydroxyprop-2-enal.
4.2 Excited vibrational state v21 = 1
Our quantum-chemical calculations identified the lowest-frequency vibrational mode v21 as the twisting skeletal vibration with the anharmonic frequency of 196.5 cm−1. The first excited state of this mode was thus expected to be sufficiently populated at the temperature of the experiment. The predictions of its rotational constants relied on theoretical estimations of vibrational-rotational changes of the rotational constants with respect to the ground state from the first column of Table 3. Rotational transitions in v21 = 1 were displaced to higher frequencies from the ground state and the Loomis-Wood-type diagrams greatly facilitated their assignments. Only the most intense and well-distinguished lines were analysed. The dataset for v21 = 1 consists of 487 rotational transitions up to Ka = 20. The R-branch transitions are covered by 110 b-type transitions and 196 a-type transitions. The remaining 181 transitions belong to b-type Q-branch transitions. Not all of the visible series were added to the fit, as the signal-to-noise ratio was rather poor. The resulting spectroscopic constants are given in Table 1 while the list of measured transitions, together with those for the ground vibrational state, are listed in Table 5. The inertial defect Δ = −0.611 uÅ2 obtained from the rotational constants is more negative than its ground-state counterpart (Δ = 0.083 uÅ2), which confirms the out-of-plane character of the v21 vibrational mode.
Most of the values for constants of the v21 = 1 state are in agreement with those for the ground state presented in Table 1. Yet several discrepancies occur: a difference from the values acquired by the ground-state analysis is evident for the quartic centrifugal distortion constant ΔK and for the K-dependent sextic constants. It is possible that the centrifugal distortion constants, which are dependent on this quantum number, display substantial variation with vibrational state as in acrylonitrile (Cazzoli & Kisiel 1988; Kisiel et al. 2009, 2012). However, the possible interaction with the nearby excited vibrational state at 277.4 cm−1, or even a combination of both effects, cannot be excluded either. Unfortunately, the insufficient intensities for other low-lying vibrational states made their analysis impossible, thus hampering a further assessment of this issue. Nevertheless, the Loomis-Wood-type plots corroborate our assignment of the rotational lines.
Differences between rotational constants of v21 = 1 and the ground state of 2-hydroxyprop-2-enal.
5 Search for 2-hydroxyprop-2-enal towards IRAS 16293-2422
5.1 Observations
The Protostellar Interferometric Line Survey is an unbiased spectral survey of the solar-type protostar IRAS 16293-2422, carried out with ALMA between 329.1 and 362.9 GHz with a spectral resolution of ~0.2kms−1 (Jørgensen et al. 2016). The high spatial resolution of ~0.5″ clearly disentangles the emission of the two components A and B, which are separated by ~5″. The data reduction process is detailed in Jørgensen et al. (2016). Thanks to its high sensitivity (rms ~ 4−5 mJy in a bin of 1 kms−1), a large variety of species were detected for the first time in low-mass protostars through this survey (for example, Lykke et al. 2017; Fayolle et al. 2017; Coutens et al. 2018, 2019; Manigand et al. 2020). In particular, several lines were recently assigned to 3-hydroxypropenal, HOCHCHCHO, towards component B (Coutens et al. 2022). The chemical network presented in Manigand et al. (2021) was then updated to include 3-hydroxypropenal and several of its isomers, including 2-hydroxyprop-2-enal (Coutens et al. 2022). The chemical model was in good agreement with the column density derived for 3-hydroxypropenal (within a factor of five), and with the upper limits derived for vinyl formate (C2H3OCHO) and 2-propenoic acid (C2H3COOH). The spectroscopic data were missing for the other isomers. A high abundance of 2-hydroxyprop-2-enal (6.6 × 10⁻⁴ with respect to CH3OH) was predicted by the model, which suggested that this species could be detectable in this source.
5.2 Non-detection of 2-hydroxyprop-2-enal
Thanks to the spectroscopic measurements obtained in Sect. 4, we consequently searched for 2-hydroxyprop-2-enal towards IRAS 16293 B at the exact same position where the lines of 3-hydroxypropenal were identified (αJ2000 = 16h32m22s.58, δJ2000 = − 24°28′32.8″). No clear detection was obtained for this species. We used the CASSIS1 software for the attempted detection. We assumed a full width at half maximum (FWHM) of 1 km s−1 and a source size of 0.5″ to determine the upper limit. Complex organic molecules in this object show excitation temperatures, Tex, between 125 and 300 K (Jørgensen et al. 2018). While some lines could correspond to 2-hydroxyprop-2-enal for Tex = 300 K, others are missing with the same model. The 3σ upper limit is ~2.4 × 1015 cm−2 based on the undetected lines and taking into account the vibrational correction (see Table 2). For 125 K, which was slightly favoured for 3-hydroxypropenal (Coutens et al. 2022), the lines of 2-hydroxyprop-2-enal are usually blended with other species. The upper limit is, in this case, ~9.4 × 1014 cm−2. The upper limit on its abundance with respect to CH3OH is consequently about ~2.4 × 10⁻⁴, that is a factor of about three lower than the predictions of the chemical model, but still within the uncertainties. According to the model, 2-hydroxyprop-2-enal is mostly formed by the tautomerisation of methyl glyoxal (CH3COCHO), which itself is produced essentially by the reaction between CH3CO and HCO. The association of HCO and CH2COH on grains, leading directly to 2-hydroxyprop-2-enal, is negligible because CH2COH has a very low concentration. The derived abundance is still within the uncertainties of the chemical model, which is estimated to be a factor of 20 for this species. Indeed, the uncertainty of the branching ratios of the association reactions is estimated to be a factor of five, while an uncertainty of a factor of four comes from the destruction reactions with hydrogen atoms. As explained in Coutens et al. (2022), the tautomerisation of methyl glyoxal could be less favourable on grains than assumed in the model because this tautomerisation involves a transition state quite high in energy. The uncertainty on the production of 2-hydroxyprop-2-enal is much larger than the uncertainty on the production of methyl glyoxal (CH3COCHO). The upper limit derived for the 2-hydroxyprop-2-enal/3-hydroxypropenal abundance ratio (≲0.9 for Tex = 125 K and ≲ 1.3 for Tex = 300 K) is consistent with the value predicted by the chemical model (~ 1.4), taking into account the uncertainties described above.
6 Search for 2-hydroxyprop-2-enal and related aldehydes towards Sgr B2(N1)
6.1 Observations
We used astronomical data obtained with ALMA towards the high-mass star-forming protocluster Sgr B2(N). This dataset constitutes the imaging spectral line survey ReMoCA. A detailed description of the observations and data reduction was reported in Belloche et al. (2019). The main characteristics of the survey are the following. The phase centre is located at the equatorial position (α,δ)J2000 = (17h47m 19s.87, -28°22′16″.0), which is half-way between the two hot molecular cores Sgr B2(N1) and Sgr B2(N2). The survey was split into five independent frequency setups to cover the frequency range from 84.1 GHz to 114.4 GHz with a spectral resolution of 488 kHz (1.7−1.3 km s−1). The median sensitivity per spectral channel achieved for this survey is 0.8 mJy beam−1, with a median angular resolution (HPBW) of 0.6″ that corresponds to −4900 au at the distance of Sgr B2 (8.2 kpc, Reid et al. 2019). We used a slightly improved version of the data reduction as described in Melosso et al. (2020).
We followed the strategy of Belloche et al. (2019) and analysed the spectrum obtained towards the position Sgr B2(N1S) at (α,δ)J2000 = (17h47m19s.870, −28°22′19″.48). This position is offset by about 1″ to the south of the main hot core Sgr B2(N1). It has a lower continuum opacity compared to the peak of the hot core, which facilitates the detection of spectral lines of molecules. We assumed local thermodynamic equilibrium (LTE) and produced synthetic spectra with the astronomical software Weeds (Maret et al. 2011) in order to analyse the observed spectrum. The high densities of the regions where hot-core emission is detected in Sgr B2(N) (> 1 × 107 cm−3, see Bonfand et al. 2019) justify our assumption of LTE. We derived a best-fit synthetic spectrum for each molecule separately and then added the contributions of all identified molecules together. We used a set of five parameters to model the contribution of each species: size of the emitting region (θs), column density (N), temperature (Trot), linewidth (ΔV), and velocity offset (Voff) with respect to the assumed systemic velocity of the source, Vsys = 62 km s−1.
Parameters of our best-fit LTE model of acetaldehyde toward Sgr B2(N1S) and upper limits for propanal, 2-hydroxypropanal, 2-hydroxyprop-2-enal, and 3-hydroxypropenal.
6.2 Non-detection of 2-hydroxyprop-2-enal
In order to search for 2-hydroxyprop-2-enal, CH2C(OH)CHO, towards Sgr B2(N1S), we relied on the LTE parameters derived for acetaldehyde, CH3CHO, towards the same source from the ReMoCA survey, as reported in Sanz-Novo et al. (2022). These parameters are listed in Table 4. Assuming that the more complex molecule 2-hydroxyprop-2-enal traces the same region as acetaldehyde, we produced LTE synthetic spectra for the former species adopting the same parameters as for the latter, with only the column density left as a free parameter. We employed the frequency predictions derived for 2-hydroxyprop-2-enal using the spectroscopic constants from Table 1 to compute its LTE synthetic spectrum. The molecule is not detected towards Sgr B2(N1S), as illustrated in Figs. 4 and 5. The upper limit on the total column density of 2-hydroxyprop-2-enal obtained from the ReMoCA survey is reported in Table 4, after accounting for the vibrational partition function that was computed with the information provided in Sect. 4.1.
We also report in Table 4 the column density upper limits that we obtained with the ReMoCA survey for two related aldehydes: the more saturated molecule 2-hydroxypropanal, CH3CH(OH)CHO, and 3-hydroxypropenal, HOCHCHCHO, which is a structural isomer of 2-hydroxyprop-2-enal. Neither of these two aldehydes is detected towards Sgr B2(N1S), as illustrated in Figs. B.1 and B.2, respectively. We employed the spectroscopic entry 74519 (version 1) of the Cologne Database for Molecular Spectroscopy2 (CDMS, Müller et al. 2005) to compute the LTE synthetic spectra used to derive the upper limit for the column density of 2-hydroxypropanal. This CDMS entry is based on the measurements reported in Alonso et al. (2019). The upper limit reported in Table 4 accounts for the (substantial) vibrational correction that was estimated using the anharmonic frequencies of its normal vibrational modes, computed at the same level of theory and basis set (MP2/6-311++G(d,p)) as those that Alonso et al. (2019) employed for the harmonic ones. The upper limit reported for 3-hydroxypropenal was obtained using the CDMS entry 72504 (version 1), which relies on previous microwave and sub-millimetre-wave measurements (Baughcum 1978; Stolze et al. 1983; Baba et al. 1999).
The vibrational correction was estimated using the experimental vibrational frequencies assigned by Tayyari & Milani-Nejad (1998) and measured by Smith et al. (1983). We also recall in Table 4 the upper limit obtained for propanal towards Sgr B2(N1S) from the ReMoCA survey, as reported by Sanz-Novo et al. (2022).
Table 4 shows that 2-hydroxyprop-2-enal is at least nine times less abundant than acetaldehyde towards Sgr B2(N1S). A similar limit is obtained for its structural isomer 3-hydroxypropenal, while the limits obtained for propanal and 2-hydroxypropanal are less stringent by nearly a factor of two. For comparison, the results reported in Sect. 5.2 for 2-hydroxyprop-2-enal, and those for 3-hydroxypropenal (Coutens et al. 2022) and acetaldehyde (Jørgensen et al. 2018), indicate that the former two molecules are >130 and ~120 times less abundant, respectively, than acetaldehyde in IRAS 16293 B. The limits obtained for both molecules in Sgr B2(N1S) are thus less constraining by more than one order of magnitude compared to IRAS 16293 B.
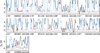 |
Fig. 4 Selection of transitions of CH2C(OH)CHO, ν = 0 covered by the ReMoCA survey. The LTE synthetic spectrum used to derive the upper limit on the column density of CH2C(OH)CHO, ν = 0 is displayed in red and overlaid on the observed spectrum of Sgr B2(N1S) shown in black. The blue synthetic spectrum contains the contributions of all molecules identified in our survey so far, but does not include the contribution of the species shown in red. The central frequency is indicated in MHz below each panel as well as the half-power beam width on the left, the width of each panel in MHz in parentheses, and the continuum level of the baseline-subtracted spectra in Κ in brackets. The y-axis is labelled in brightness temperature units (K). The dotted line indicates the 3σ noise level. |
7 Conclusions
We present the extended dataset for the ground state of 2-hydroxyprop-2-enal, together with the first data for the low-lying excited vibrational state v21 = 1. The species was prepared in situ by the thermal decomposition of DHA and then characterised by millimetre-wave rotational spectroscopy. The effective Hamiltonian with quartic and sextic centrifugal distortion terms was employed within the analysis. The determination of sex-tic terms and the analysis of the v21 = 1 state were supported by quantum-chemical calculations. A total of 669 and 295 distinct frequency lines, covering 968 and 487 rotational transitions, were used in the assignment of the ground and excited vibrational states, respectively. These new laboratory measurements provided accurate frequency predictions to search for the molecule towards IRAS 16293 Β and Sgr B2(N). Additionally, emission lines of the related molecules 2-hydroxypropanal and 3-hydroxypropenal were searched for in the latter source. The observational results are the following:
We report the non-detection of 2-hydroxyprop-2-enal towards the protostar IRAS 16293 B. The derived upper limit is in agreement, within the uncertainties, with the predictions of the chemical model developed for 3-hydroxypropenal in Coutens et al. (2022). The 2-hydroxyprop-2-enal/3-hydroxypropenal abundance ratio is estimated to be ≲0.9−1.3, in agreement with the predicted value of ~1.4.
We report the non-detection of 2-hydroxyprop-2-enal towards the main hot core of Sgr B2(N) that was targeted with ALMA. We find that this molecule is at least nine times less abundant than acetaldehyde towards this source. Its column density upper limit is nearly a factor of two lower than the one derived earlier for propanal in the same source.
Neither of the related aldehydes, 2-hydroxypropanal and 3-hydroxypropenal, were detected towards Sgr B2(N)’s main hot core. They are at least four and ten times less abundant than acetaldehyde, respectively.
Despite the non-detections of 2-hydroxyprop-2-enal, the present work represents a significant improvement on previous laboratory studies below 25 GHz and provides an excellent base for further future searches for this species in space.
Acknowledgements
The spectroscopic part of the article has been supported by the Czech Science Foundation (GACR, grant 19-25116Y). L.K., J.K., K.L., and K.V. gratefully acknowledge this funding. Computational resources were supplied by the project “e-Infrastruktura CZ” (e-INFRA CZ LM2018140) supported by the Ministry of Education, Youth and Sports of the Czech Republic. This paper makes use of the following ALMA data: ADS/JAO.ALMA#2016.1.00074.S and ADS/JAO.ALMA#2013.1.00278.S. ALMA is a partnership of ESO (representing its member states), NSF (USA), and NINS (Japan), together with NRC (Canada), NSC and ASIAA (Taiwan), and KASI (Republic of Korea), in cooperation with the Republic of Chile. The Joint ALMA Observatory is operated by ESO, AUI/NRAO, and NAOJ. The interfer-ometric data are available in the ALMA archive at https://almascience.eso.org/aq/. Part of this work has been carried out within the Collaborative Research Centre 956, sub-project B3, funded by the Deutsche Forschungsgemeinschaft (DFG) − project ID 184018867. A.C. received financial support from the European Research Council (ERC) under the European Union’s Horizon 2020 research and innovation programme (ERC Starting Grant “Chemtrip”, grant agreement no. 949278).
Appendix A Supplementary tables
Table A.1 summarises the spectroscopic properties of the four lowest-energy conformers of 2-hydroxyprop-2-enal. Table A.2 lists the frequencies of the normal vibrational modes of 2-hydroxyprop-2-enal.
Four lowest-energy conformers of 2-hydroxyprop-2-enal.
List of harmonic and anharmonic frequencies for vibrational modes of 2-hydroxyprop-2-enal calculated by B3LYP/6-311++G(d,p).
Appendix B Complementary figures: Non-detection of 2-hydroxypropanal and 3-hydroxypropenal towards Sgr B2(N1S)
Figures B.1 and B.2 illustrate the non-detection of 2-hydroxypropanal and 3-hydroxypropenal, respectively, towards Sgr B2(N1S) with the ReMoCA survey.
References
- Agúndez, M., Marcelino, N., Tercero, B., et al. 2021, A&A, 649, A2 [NASA ADS] [CrossRef] [EDP Sciences] [Google Scholar]
- Alonso, E. R., Kolesniková, L., Na, I.P., et al. 2015, J. Mol. Spectrosc., 316, 84 [NASA ADS] [CrossRef] [Google Scholar]
- Alonso, E. R., Kolesniková, L., Tercero, B., et al. 2016, ApJ, 832, 42 [NASA ADS] [CrossRef] [Google Scholar]
- Alonso, E. R., McGuire, B. A., Kolesniková, L., et al. 2019, ApJ, 883, 18 [NASA ADS] [CrossRef] [Google Scholar]
- Apponi, A. J., Hoy, J. J., Halfen, D. T., Ziurys, L. M., & Brewster, M. A. 2006, ApJ, 652, 1787 [NASA ADS] [CrossRef] [Google Scholar]
- Baba, T., Tanaka, T., Morino, I., Yamada, K. M., & Tanaka, K. 1999, J. Chem. Phys., 110, 4131 [NASA ADS] [CrossRef] [Google Scholar]
- Baughcum, S. L. 1978, PhD thesis, Harvard University, Cambridge, MA, USA [Google Scholar]
- Belloche, A., Garrod, R. T., Müller, H. S., et al. 2009, A&A, 499, 215 [NASA ADS] [CrossRef] [EDP Sciences] [Google Scholar]
- Belloche, A., Müller, H. S. P., Garrod, R. T., & Menten, K. M. 2016, A&A, 587, A91 [NASA ADS] [CrossRef] [EDP Sciences] [Google Scholar]
- Belloche, A., Garrod, R. T., Müller, H. S. P., et al. 2019, A&A, 628, A10 [NASA ADS] [CrossRef] [EDP Sciences] [Google Scholar]
- Bermúdez, C., Peña, I., Cabezas, C., Daly, A. M., & Alonso, J. L. 2013, ChemPhysChem, 14, 893 [CrossRef] [Google Scholar]
- Bonfand, M., Belloche, A., Garrod, R.T., et al. 2019, A&A, 628, A27 [NASA ADS] [CrossRef] [EDP Sciences] [Google Scholar]
- Calabrese, C., Maris, A., Dore, L., et al. 2015, Mol. Phys., 113, 2290 [NASA ADS] [CrossRef] [Google Scholar]
- Cazzoli, G., & Kisiel, Z. 1988, J. Mol. Spectrosc., 130, 303 [NASA ADS] [CrossRef] [Google Scholar]
- Cooper, G., Kimmich, N., Belisle, W., et al. 2001, Nature, 414, 879 [NASA ADS] [CrossRef] [Google Scholar]
- Coutens, A., Willis, E. R., Garrod, R. T., et al. 2018, A&A, 612, A107 [NASA ADS] [CrossRef] [EDP Sciences] [Google Scholar]
- Coutens, A., Ligterink, N. F. W., Loison, J. C., et al. 2019, A&A, 623, A13 [Google Scholar]
- Coutens, A., Loison, J. C., Boulanger, A., et al. 2022, A&A, 660, A6 [Google Scholar]
- Daly, A. M., Bermúdez, C., Kolesniková, L., & Alonso, J. L. 2015, ApJS, 218, 30 [Google Scholar]
- de Marcellus, P., Meinert, C., Myrgorodska, I., et al. 2015, Proc. Natl. Acad. Sci. U.S.A., 112, 965 [NASA ADS] [CrossRef] [Google Scholar]
- Dickens, J. E., Irvine, W. M., Nummelin, A., et al. 2001, Spectrochim. Acta A Mol. Biomol. Spectrosc., 57, 643 [NASA ADS] [CrossRef] [Google Scholar]
- Fayolle, E. C., Öberg, K. I., Jørgensen, J. K., et al. 2017, Nat. Astron., 1, 703 [NASA ADS] [CrossRef] [Google Scholar]
- Fedoseev, G., Chuang, K.-J., Ioppolo, S., et al. 2017, ApJ, 842, 52 [NASA ADS] [CrossRef] [Google Scholar]
- Frisch, M. J., Trucks, G. W., Schlegel, H. B., et al. 2016, Gaussian16 Revision C.01, Gaussian Inc., Wallingford, CT [Google Scholar]
- Goesmann, F., Rosenbauer, H., Bredehöft, J. H., et al. 2015, Science, 349, 2 [CrossRef] [Google Scholar]
- Gordy, W., & Cook, R. L. 1984, Microwave Molecular Spectra, 3rd edn. (New York: Wiley) [Google Scholar]
- Hollis, J. M., Lovas, F. J., & Jewell, P. R. 2000, ApJ, 540, L107 [Google Scholar]
- Hollis, J. M., Jewell, P. R., Lovas, F. J., Remijan, A., & Møllendal, H. 2004, ApJ, 610, L21 [Google Scholar]
- Insausti, A., Alonso, E. R., Tercero, B., et al. 2021, J. Phys. Chem. Lett., 12, 1352 [NASA ADS] [CrossRef] [Google Scholar]
- Irvine, W. M., Brown, R. D., Cragg, D. M., et al. 1988, ApJ, 335, L89 [Google Scholar]
- Jiménez-Serra, I., Martín-Pintado, J., Rivilla, V. M., et al. 2020, Astrobiology, 20, 1048 [Google Scholar]
- Jørgensen, J. K., van der Wiel, M.H.D., Coutens, A., et al. 2016, A&A, 595, A117 [NASA ADS] [CrossRef] [EDP Sciences] [Google Scholar]
- Jørgensen, J. K., Müller, H. S. P., Calcutt, H., et al. 2018, A&A, 620, A170 [Google Scholar]
- Kania, P., Stříteská, L., Šimečková, M., & Urban, Š. 2006, J. Mol. Struct., 795, 209 [NASA ADS] [CrossRef] [Google Scholar]
- Karton, A., & Talbi, D. 2014, Chem. Phys., 436-437, 22 [Google Scholar]
- Kisiel, Z., Pszczółkowski, L., Medvedev, I. R., et al. 2005, J. Mol. Spectrosc., 233, 231 [NASA ADS] [CrossRef] [Google Scholar]
- Kisiel, Z., Pszczółkowski, L., Drouin, B. J., et al. 2009, J. Mol. Spectrosc., 258, 26 [NASA ADS] [CrossRef] [Google Scholar]
- Kisiel, Z., Pszczółkowski, L., Drouin, B. J., et al. 2012, J. Mol. Spectrosc., 280, 134 [NASA ADS] [CrossRef] [Google Scholar]
- Layssac, Y., Gutiérrez-Quintanilla, A., Chiavassa, T., & Duvernay, F. 2020, MNRAS, 496, 5292 [NASA ADS] [CrossRef] [Google Scholar]
- Lovas, F. J., Suenram, R. D., Plusquellic, D. F., & Møllendal, H. 2003, J. Mol. Spectrosc., 222, 263 [NASA ADS] [CrossRef] [Google Scholar]
- Luková, K., Kolesniková, L., Koucký, J., et al. 2022, A&A, 665, A9 [NASA ADS] [CrossRef] [EDP Sciences] [Google Scholar]
- Lykke, J. M., Coutens, A., Jørgensen, J. K., et al. 2017, A&A, 597, A53 [NASA ADS] [CrossRef] [EDP Sciences] [Google Scholar]
- Maity, S., Kaiser, R. I., & Jones, B. M. 2015, Phys. Chem. Chem. Phys., 17, 3081 [NASA ADS] [CrossRef] [Google Scholar]
- Manigand, S., Jørgensen, J. K., Calcutt, H., et al. 2020, A&A, 635, A48 [NASA ADS] [CrossRef] [EDP Sciences] [Google Scholar]
- Manigand, S., Coutens, A., Loison, J. C., et al. 2021, A&A, 645, A53 [NASA ADS] [CrossRef] [EDP Sciences] [Google Scholar]
- Maret, S., Hily-Blant, P., Pety, J., Bardeau, S., & Reynier, E. 2011, A&A, 526, A47 [NASA ADS] [CrossRef] [EDP Sciences] [Google Scholar]
- McGuire, B. A. 2022, ApJS, 259, 30 [NASA ADS] [CrossRef] [Google Scholar]
- Melosso, M., Belloche, A., Martin-Drumel, M.-A., et al. 2020, A&A, 641, A160 [NASA ADS] [CrossRef] [EDP Sciences] [Google Scholar]
- Moldoveanu, S. C., ed. 2010, Pyrolysis of Organic Molecules with Applications to Health and Environmental Issues, 28 (Amsterdam: Elsevier) [Google Scholar]
- Müller, H. S. P., Schlöder, F., Stutzki, J., & Winnewisser, G. 2005, J. Mol. Struct., 742, 215 [Google Scholar]
- Pickett, H. M. 1991, J. Mol. Spectrosc., 148, 371 [Google Scholar]
- Reid, M. J., Menten, K. M., Brunthaler, A., et al. 2019, ApJ, 885, 131 [Google Scholar]
- Rose, I. A., & Nowick, J. S. 2002, J. Am. Chem. Soc., 124, 13047 [CrossRef] [Google Scholar]
- Sanz-Novo, M., Belloche, A., Rivilla, V. M., et al. 2022, A&A, 666, A114 [NASA ADS] [CrossRef] [EDP Sciences] [Google Scholar]
- Smith, Z., Wilson, E., & Duerst, R. W. 1983, Spectrochim. Acta A, 39, 1117 [NASA ADS] [CrossRef] [Google Scholar]
- Snyder, L. E., Buhl, D., Zuckerman, B., & Palmer, P. 1969, Phys. Rev. Lett., 22, 679 [Google Scholar]
- Stolze, M., Hübner, D., & Sutter, D. 1983, J. Mol. Struct., 97, 243 [NASA ADS] [CrossRef] [Google Scholar]
- Tayyari, S., & Milani-Nejad, F. 1998, Spectrochim. Acta A: Mol. Biomol. Spectrosc., 54, 255 [NASA ADS] [CrossRef] [Google Scholar]
- Tercero, B., Kleiner, I., Cernicharo, J., et al. 2013, ApJS, 770, 1 [NASA ADS] [CrossRef] [Google Scholar]
- Turner, B. E., & Apponi, A. J. 2001, ApJ, 561, L207 [Google Scholar]
- Urban, Š., & Sarka, K. 1990, J. Mol. Spectrosc., 144, 446 [NASA ADS] [CrossRef] [Google Scholar]
- Van Trump, J. E., & Miller, S. L. 1972, Science, 178, 859 [NASA ADS] [CrossRef] [Google Scholar]
- Vastel, C., Bottinelli, S., Caux, E., Glorian, J. M., & Boiziot, M. 2015, in SF2A- 2015: Proceedings of the Annual meeting of the French Society of Astronomy and Astrophysics, 313 [Google Scholar]
- Widicus Weaver, S. L., & Blake, G. A. 2005, ApJ, 624, L33 [NASA ADS] [CrossRef] [Google Scholar]
- Yarnall, Y. Y., Gerakines, P. A., & Hudson, R. L. 2020, MNRAS, 494, 4606 [NASA ADS] [CrossRef] [Google Scholar]
- Zhou, Y., Quan, D. H., Zhang, X., & Qin, S. L. 2020, Res. Astron. Astrophys., 20, 125 [CrossRef] [Google Scholar]
- Zingsheim, O., Müller, H. S., Lewen, F., Jørgensen, J. K., & Schlemmer, S. 2017, J. Mol. Spectrosc., 342, 125 [NASA ADS] [CrossRef] [Google Scholar]
- Zingsheim, O., Müller, H. S., Bonah, L., et al. 2022, J. Mol. Spectrosc., 384, 111565 [NASA ADS] [CrossRef] [Google Scholar]
CASSIS has been developed by IRAP-UPS/CNRS (Vastel et al. 2015). http://cassis.irap.omp.eu/
All Tables
Spectroscopic constants of 2-hydroxyprop-2-enal in the ground state (G.S.) and the lowest lying excited vibrational state (A-reduction, Ir-representation).
Differences between rotational constants of v21 = 1 and the ground state of 2-hydroxyprop-2-enal.
Parameters of our best-fit LTE model of acetaldehyde toward Sgr B2(N1S) and upper limits for propanal, 2-hydroxypropanal, 2-hydroxyprop-2-enal, and 3-hydroxypropenal.
List of harmonic and anharmonic frequencies for vibrational modes of 2-hydroxyprop-2-enal calculated by B3LYP/6-311++G(d,p).
All Figures
|
Fig. 1 Structure of 2-hydroxyprop-2-enal displayed in the ab inertial plane. |
| In the text | |
|
Fig. 2 Keto-enol tautomeric relationship of 2-hydroxyprop-2-enal and methylglyoxal. The most stable isomers are highlighted. The structures are accompanied by their relative zero-point corrected energy (with respect to the most stable conformer of 2-hydroxyprop-2-enal) calculated at B3LYP/6-311++G(d,p) level of theory and basis set. |
| In the text | |
|
Fig. 3 Segment of spectra showing an overview of coalesced and distinguished lines. Arrows pointing upwards belong to the ground state transitions and arrows pointing downwards represent the excited vibrational state. Several transitions of ethanol (EtOH) and methanol (MeOH) are shown as well. |
| In the text | |
|
Fig. 4 Selection of transitions of CH2C(OH)CHO, ν = 0 covered by the ReMoCA survey. The LTE synthetic spectrum used to derive the upper limit on the column density of CH2C(OH)CHO, ν = 0 is displayed in red and overlaid on the observed spectrum of Sgr B2(N1S) shown in black. The blue synthetic spectrum contains the contributions of all molecules identified in our survey so far, but does not include the contribution of the species shown in red. The central frequency is indicated in MHz below each panel as well as the half-power beam width on the left, the width of each panel in MHz in parentheses, and the continuum level of the baseline-subtracted spectra in Κ in brackets. The y-axis is labelled in brightness temperature units (K). The dotted line indicates the 3σ noise level. |
| In the text | |
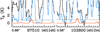 |
Fig. 5 Same as Fig. 4, but for CH2C(OH)CHO, v21 = 1. |
| In the text | |
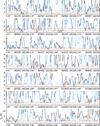 |
Fig. B.1 Same as for Fig. 4, but for CH3CH(OH)CHO, ν = 0. |
| In the text | |
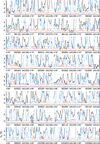 |
Fig. B.2 Same as for Fig. 4, but for HOCHCHCHO, ν=0. |
| In the text | |
Current usage metrics show cumulative count of Article Views (full-text article views including HTML views, PDF and ePub downloads, according to the available data) and Abstracts Views on Vision4Press platform.
Data correspond to usage on the plateform after 2015. The current usage metrics is available 48-96 hours after online publication and is updated daily on week days.
Initial download of the metrics may take a while.