| Issue |
A&A
Volume 666, October 2022
|
|
|---|---|---|
| Article Number | A50 | |
| Number of page(s) | 16 | |
| Section | Atomic, molecular, and nuclear data | |
| DOI | https://doi.org/10.1051/0004-6361/202243627 | |
| Published online | 04 October 2022 | |
Millimeter wave spectrum and search for vinyl isocyanate toward Sgr B2(N) with ALMA★
1
Department of Analytical Chemistry, University of Chemistry and Technology,
Technická 5,
166 28
Prague 6, Czech Republic
e-mail: This email address is being protected from spambots. You need JavaScript enabled to view it.
; This email address is being protected from spambots. You need JavaScript enabled to view it.
2
Max-Planck-Institut für Radioastronomie,
Auf dem Hügel 69,
53121
Bonn, Germany
3
Departments of Chemistry and Astronomy, University of Virginia,
Charlottesville, VA
22904, USA
4
Univ. Rennes, École Nationale Supérieure de Chimie de Rennes, CNRS, ISCR UMR6226,
35000
Rennes, France
5
Astrophysik/I. Physikalisches Institut, Universität zu Köln,
Zülpicher Str. 77,
50937
Cologne, Germany
Received:
24
March
2022
Accepted:
28
June
2022
Abstract
Context. The interstellar detections of isocyanic acid (HNCO), methyl isocyanate (CH3NCO), and very recently also ethyl isocyanate (C2H5NCO) invite the question of whether or not vinyl isocyanate (C2H3NCO) can be detected in the interstellar medium. There are only low-frequency spectroscopic data (<40 GHz) available for this species in the literature, which makes predictions at higher frequencies rather uncertain, which in turn hampers searches for this molecule in space using millimeter (mm) wave astronomy.
Aims. The aim of the present study is on one hand to extend the laboratory rotational spectrum of vinyl isocyanate to the mm wave region and on the other to search, for the first time, for its presence in the high-mass star-forming region Sgr B2, where other isocyanates and a plethora of complex organic molecules are observed.
Methods. We recorded the pure rotational spectrum of vinyl isocyanate in the frequency regions 127.5–218 and 285–330 GHz using the Prague mm wave spectrometer. The spectral analysis was supported by high-level quantum-chemical calculations. On the astronomy side, we assumed local thermodynamic equilibrium to compute synthetic spectra of vinyl isocyanate and to search for it in the ReMoCA survey performed with the Atacama Large Millimeter/submillimeter Array (ALMA) toward the high-mass star-forming protocluster Sgr B2(N). Additionally, we searched for the related molecule ethyl isocyanate in the same source.
Results. Accurate values for the rotational and centrifugal distortion constants are reported for the ground vibrational states of trans and cis vinyl isocyanate from the analysis of more than 1000 transitions. We report nondetections of vinyl and ethyl isocyanate toward the main hot core of Sgr B2(N). We find that vinyl and ethyl isocyanate are at least 11 and 3 times less abundant than methyl isocyanate in this source, respectively.
Conclusions. Although the precise formation mechanism of interstellar methyl isocyanate itself remains uncertain, we infer from existing astrochemical models that our observational upper limit for the CH3NCO:C2H5NCO ratio in Sgr B2(N) is consistent with ethyl isocyanate being formed on dust grains via the abstraction or photodissociation of an H atom from methyl isocyanate, followed by the addition of a methyl radical. The dominance of such a process for ethyl isocyanate production, combined with the absence of an analogous mechanism for vinyl isocyanate, would indicate that the ratio C2H3NCO:C2H5NCO should be less than unity. Even though vinyl isocyanate was not detected toward Sgr B2(N), the results of this work represent a significant improvement on previous low-frequency studies and will help the astronomical community to continue searching for this species in the Universe.
Key words: astrochemistry / ISM: molecules / line: identification / ISM: individual objects: Sgr B2 / methods: laboratory: molecular
Full Tables A.2, A.3, A.5, and A.6 are only available at the CDS via anonymous ftp to cdsarc.u-strasbg.fr (130.79.128.5) or via http://cdsarc.u-strasbg.fr/viz-bin/cat/J/A+A/666/A50
© K. Vávra et al. 2022
 Open Access article, published by EDP Sciences, under the terms of the Creative Commons Attribution License (https://creativecommons.org/licenses/by/4.0), which permits unrestricted use, distribution, and reproduction in any medium, provided the original work is properly cited.
This article is published in open access under the Subscribe-to-Open model. This email address is being protected from spambots. You need JavaScript enabled to view it. to support open access publication.
1 Introduction
A few isocyanate bearing molecules have been detected in the interstellar medium (ISM). The simplest one, isocyanate radical (NCO), was observed relatively recently in the line survey of L483 (Marcelino et al. 2018), while isocyanic acid (HNCO) belongs among the early molecules detected in the Universe, with its detection dating back to 1972 (Snyder & Buhl 1972; Buhl et al. 1972). HNCO is a well-established interstellar molecule observed in the direction of a variety of sources such as TMC-1 (Brown 1981), IRAS 162932422 (Bisschop et al. 2008; Coutens et al. 2016), L483 (Marcelino et al. 2018), NGC 6334I (Ligterink et al. 2020), G31.41+0.31 (Colzi et al. 2021), Serpens SMM1 (Ligterink et al. 2021), and G331.512-0.103 (Canelo et al. 2021). Its protonated form, H2NCO+, was tentatively observed in Sgr B2 by Gupta et al. (2013), but later its presence in space was confirmed by Marcelino et al. (2018). H2NCO+ was recently detected toward the molecular cloud G+0.693-0.027 (Rodríguez-Almeida et al. 2021) where NCO, cyanogen isocyanate (NCNCO), and ethynyl isocyanate (HCCNCO) were also searched for. A methyl derivative of HNCO, methyl isocyanate (CH3NCO), was first detected in the Sgr B2(N) and Orion KL star-forming regions (Halfen et al. 2015; Cernicharo et al. 2016; Belloche et al. 2017). Further observations showed that it is also present in other sources such as IRAS 16293-2422 (Ligterink et al. 2017; Martín-Doménech et al. 2017), G31.41+0.31 (Gorai et al. 2021; Colzi et al. 2021), Serpens SMM1 (Ligterink et al. 2021), G10.47+0.03 (Gorai et al. 2020), G+0.693-0.027 (Zeng et al. 2018), and G328.2551-0.5321 (Csengeri et al. 2019). Very recently, the even more complex ethyl isocyanate (C2 H5NCO) was discovered toward the G+0.693-0.027 molecular cloud by Rodríguez-Almeida et al. (2021). Isocyanates are therefore relatively widespread across the Galaxy and further such species might yet be detected. In addition, new molecular discoveries are reinforced by increasing the sensitivity and detector bandwidths of astronomical observing capabilities (Jorgensen et al. 2020; Tercero et al. 2021) as demonstrated by some of the latest astronomical detections (Cernicharo et al. 2021b; Rivilla et al. 2021; McCarthy et al. 2021) which contributed to the recent huge jump in the total number of detected compounds (McGuire 2022).
The aforementioned discoveries created unique possibilities to uncover the fundamentals of the chemistry of isocyanates in space and their possible role as precursors in the formation of other compounds (Majumdar et al. 2017; Zeng et al. 2018). For example, H2NCO+ has been considered as a candidate reactant partner of HC3N in the synthesis of nucleobases (Choe 2021) and CH3NCO as a precursor for the synthesis of N-methylformamide (CH3NHCHO, Belloche et al. 2017). The latter has been observed toward Sgr B2 and NGC 6334I star-forming regions (Belloche et al. 2017, 2019; Ligterink et al. 2020) and very recently also toward the hot core G31.41+0.31 (Colzi et al. 2021). This possible link with prebiotic chemistry further increases the interest in isocyanates as targets for laboratory spectroscopic studies in view of future observations.
In the present work, the molecule in question is vinyl isocyanate (C2H3NCO), the most thermodynamically stable isomer with a C3H3NO formula (Fourré et al. 2020). C2H3NCO is more complex than CH3NCO and at the same time contains two hydrogen atoms fewer than the recently detected C2H5NCO. In addition, it bears in its backbone the vinyl functional group which is a common structural motif in several other interstellar compounds such as vinyl cyanide (C2H3CN; Gardner & Winnewisser 1975), vinylacetylene (C2H3CCH; Cernicharo et al. 2021a), vinylcyanoacetylene (C2H3C3N; Lee et al. 2021), and vinylamine (C2H3NH2; Zeng et al. 2021). A search for vinyl isocyanate in the line survey of the G+0.693-0.027 molecular cloud was reported very recently (Rodriguez-Almeida et al. 2021) on the basis of the only rotational spectrum reported so far below 40 GHz (Bouchy & Roussy 1977, 1979; Kirby & Kroto 1978). On the other hand, no such trials have been performed in the millimeter (mm) wave surveys of other interstellar sources, which is very likely due to the lack of laboratory information in the mm wave spectral region.
The aim of the present work is therefore two fold. First, we want to extend the laboratory rotational spectrum of vinyl isocyanate to 330 GHz and analyze the ground-state rotational transitions of its two stable planar forms: trans and cis (see Fig. 1). The latter was found by Kirby & Kroto (1978) to be less stable by 4.99(24) kJ mol−1 or 417(20) cm−1 or 600(29) K, where the numbers in parentheses represent uncertainties in units of the last decimal digits. These new measurements and analyses lay the foundations for a new search for interstellar signatures of vinyl isocyanate by mm wave astronomy. We target the high-mass star-forming region Sgr B2(N) which reveals an astonishingly rich collection of molecular species, including isocyanates.
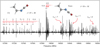 |
Fig. 1 Two isomers of vinyl isocyanate and their characteristic features in the room-temperature millimeter wave spectrum. The spectrum reveals compact groups of a-type R-branch transitions of the trans species in the ground state and v18 = 1, v13 = 1, and v18 = 2 excited vibrational states. Weaker a-type R-branch transitions of the less stable cis isomer are, at the present scale, observed in the form of significantly more diffuse groups. |
2 Experimental details
2.1 Synthesis
The sample of vinyl isocyanate was prepared by Curtius rearrangement of acryloyl azide under vacuum (0.1 mbar) using a modified synthesis of Kirby & Kroto (1978). Briefly, sodium azide NaN3 (3.25 g, 50 mmol) was mixed with 30 ml of diethylene glycol dibutyl ether in a three-necked flask equipped with a magnetic stirring bar and a stopcock. The flask was evacuated to a pressure of about 0.1 mbar. Keeping the stopcock closed, the flask was immersed in a bath at −20 °C. In the next step, acryloyl chloride (2.85 g, 31 mmol) was added in five portions (5 × 500 through a septum. The mixture was stirred for 2 h at 0 °C allowing the formation of acryloyl azide. The stopcock was then opened and all volatiles passed into the vacuum line containing a quartz tube in an oven heated to approximately 500 °C and two successive cold U-tubes. The first U-tube was immersed in a bath at −70 °C to remove impurities and the second one in a liquid nitrogen bath to collect vinyl isocyanate. The final product was used without any further purification. The main advantage of this experimental procedure was that it avoids isolation of the potentially explosive acryloyl azide.
Spectroscopic constants for the trans and cis isomers of vinyl isocyanate in their ground vibrational states (A-reduction, IT-representation) in comparison with previously published results and quantum-chemical calculations.
2.2 Spectroscopic measurements
The rotational spectrum of vinyl isocyanate was recorded in the frequency regions 127.5−218 and 282−330 GHz using the upgraded Prague semiconductor mm wave spectrometer. The spectrometer is based on sequential multiplication of the fundamental synthesizer frequency (lower than 50 GHz) by a set of active and passive multipliers and a phase-sensitive detection as described by Kania et al. (2006). The Pyrex glass free-space cells of 2.8 and 2.3 m in length were used for the measurements. The optical path lengths were doubled to 5.6 and 4.6 m by roof-top mirrors. The mm-wave radiation was modulated at the modulation frequency of 28 kHz and the detected signal was demodulated by means of a lock-in amplifier working at twice the modulation frequency. All spectra were registered by upward and downward frequency scanning and averaged. The sample was kept at room temperature and a pressure of around 20 µbar during the experiments.
3 Quantum-chemical calculations
Although vinyl isocyanate has been the subject of some computational studies (Badawi et al. 2001; Olsen 1979), we carried out our own calculations in order to obtain a reasonable estimation for the spectroscopic parameters relevant to this work. We used coupled-cluster approximation on the level of the coupled-cluster-single-double (CCSD) model (Purvis & Bartlett 1982) as it is implemented in the CFOUR program package (Matthews et al. 2020), in conjunction with Dunning’s correlation consistent triple-ζ (cc-pVTZ) basis set (Dunning 1989). The convergence criteria for the HF-SCF equations, the CC amplitude equations, and the linear equations were set to 10−8 atomic units. This means the convergence structure calculations and the analytical second derivatives were followed by finite difference techniques to obtain the full cubic force field. These harmonic and anharmonic force field calculations yielded the rotational and centrifugal distortion constants listed in Table 1 together with the energy difference between the cis and trans isomer of 3.6 kJ mol−1 (301 cm−1 or 433 K). The optimized geometries of both species are shown in Fig. 1 and their harmonic and anharmonic vibrational frequencies are provided in Table A.1.
4 Rotational spectra and analyses
4.1 Trans isomer
As the trans isomer represents the most stable species on the potential energy landscape of vinyl isocyanate, it is the most relevant target for astronomical observations as it presents the strongest lines in the mm wave spectrum in Fig. 1. The most visible features in the spectrum are compact groups of a-type R-branch transitions arising from the near-prolate character of the molecule (κ = −0.997) and its large dipole moment component along the a principal inertial axis ∣µa∣ = 2.047(6) D and ∣µb∣ = 0.824(9) D from Kirby & Kroto (1978). The analysis was commenced by refitting the data set from Kirby & Kroto (1978) and generating spectral line predictions. The predicted transitions were searched for with the help of the Loomis-Wood-type plot technique (Loomis & Wood 1928) implemented in our own program (Vávra et al. 2020). The program is written in the Matlab software (MATLAB 2020) and allows line assignments to quantum numbers, precise determination of the line frequencies employing the Voight profile function, and the data to be saved in a line list among other features. It generates input files for the SPFIT/SPCAT program package (Pickett 1991) which is executed directly from the user interface, allowing straightforward analysis of the assigned lines. On this basis, we easily expanded the assignments for Ka = 0−6 transitions up to J = 69 and identified weak b-type R-branch and Q-branch transitions.
Difficulties were encountered in assignments and fitting Ka ≥ 7 transitions. In the absence of perturbations, these transitions are expected to progressively run to higher frequencies as shown in the lower panel of Fig. 2. Instead, we observed irregular shifts with respect to their predicted positions that could not be treated within the scope of classical semi-rigid rotor Hamiltonian. Some of these transitions could not be confidently assigned (see Fig. 2). Consequently, we limited the analysis of a-type R-branch transitions to Ka = 6. These transitions were merged with b-type R-branch and g-branch transitions which, because of low intensities and the large value of the A rotational constant, were limited to Ka = 3 and J = 80. Our data set was finally combined with microwave transitions from Kirby & Kroto (1978) and analyzed using Watson’s A-reduced Hamiltonian in Ir-representation (Watson 1977) with terms up to the sixth power in the angular momentum. The only exceptions were ΦK and ϕK which were fixed at the values estimated from quantum-chemical calculations. We note that all transitions from Kirby & Kroto (1978) were found to be fully consistent with our measurements and could be perfectly fitted. Results from this joint analysis are provided in Table 1 and the list of measured transitions in Table A.2. Watson’s S -reduced Hamiltonian led to results of similar quality. The origin of perturbations in the rotational spectrum of trans vinyl isocyanate is further discussed in Sect. 6.1.
4.2 Cis isomer
The spectroscopic constants from Kirby & Kroto (1978) were used for the first prediction of the rotational spectrum of cis vinyl isocyanate in the mm wave region. Only a-type R-branch transitions were observed for this isomer in agreement with the dipole moment components of ∣µa∣ = 2.14(2) D and ∣µb∣ = 0.09(2) D as determined by Stark spectroscopy (Bouchy & Roussy 1979). It was possible to identify and iteratively fit the rotational transitions up to J = 61 and Ka = 21 . We were not able to assign the transitions with higher values of Ka because of their low intensities, which caused them to disappear in the spectral confusion, the “weeds”, of lines from the most stable trans isomer. Our data set was combined with low-frequency transitions from Kirby & Kroto (1978) and Bouchy & Roussy (1977) and was fit to matrix elements of Watson’s A-reduced effective rotational Hamiltonian (Watson 1977). Some transitions from previous microwave works revealed larger residuals. Larger uncertainties were therefore assigned to these transitions and four of them were excluded from the fit. The complete list of treated transitions is provided in Table A.3. and the molecular constants determined from the analysis are reported in Table 1.
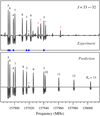 |
Fig. 2 Perturbations in the ground-state rotational spectrum of trans vinyl isocyanate. The experimental spectrum is compared with predictions based on the analysis up to Ka = 6. All the assigned lines correspond to a-type R-branch transitions except that marked with a star which is the b-type 400,40 ← 391,39 transition. The blue diamond symbols highlight the transitions included in the fit while the red question marks indicate perturbed transitions that could not be confidently assigned. |
4.3 Partition functions
The spectroscopic constants from Table 1 were used to evaluate the rotational partition function (Qrot) for both isomers. We used the SPCAT program (Pickett 1991) to undertake the numerical summation over the ground-state energy levels up to J = 240 and Ka = 46 for the trans isomer and J = 210 and Ka = 72 for the cis isomer. In addition, for the cis form, this summation was corrected for the energy difference between the cis and trans form. We used ΔEZPE = 30l cm−1 from our quantum-chemical calculations. This value reproduces quite well the experimental intensities of the cis isomer lines with respect to neighboring lines of the trans isomer in our spectrum. On the other hand, the experimental value 417(20) cm−1 from Kirby & Kroto (1978) underestimates these cis isomer lines relative intensities. For this reason, we consider our calculated value for the energy difference as more reliable. Obtained rotational partition functions at nine different temperatures are provided in Table 2. Their values represent the individual contributions from the trans and cis isomer to the rotational partition function of the molecule as a whole which is also given in Table 2. For completeness, we provide in Table A.4 the rotational partition functions of the cis isomer also as a separate species, that is, with the 00.0 level set to 0 cm−1 . The vibrational partition functions (Qvib) were estimated using Eq. (3.60) of Gordy & Cook (1970) by taking into account the anharmonic frequencies of the 18 normal vibrational modes from Table A.1 and are listed in Table 2. The same table also shows that the cis isomer represents an important fraction of the room-temperature population of vinyl isocyanate while its abundance is estimated to only 8 % at 150 K.
Partition functions and abundances for the two isomers of vinyl isocyanate.
5 Search for vinyl isocyanate toward Sgr B2(N1)
5.1 Observations
The imaging spectral line survey Reexploring Molecular Complexity with ALMA (ReMoCA) was performed toward the high-mass star-forming protocluster Sgr B2(N) with the Atacama Large Millimeter/submillimeter Array (ALMA). A detailed description of the observations and data reduction is provided by Belloche et al. (2019). We summarize the main features of the survey here. The phase center is located at the equatorial position (α, δ)12000= (17h47m19s.87, −28°22′ 16″.0) which is halfway between the two hot molecular cores Sgr B2(N1) and Sgr B2(N2). We defined five frequency tunings to cover the frequency range from 84.1 GHz to 114.4 GHz with a spectral resolution of 488 kHz (1.7−1.3 km s−1). The survey has a sensitivity per spectral channel that varies between 0.35 mJy beam−1 and 1.1 mJy beam−1 (rms) depending on the setup, with a median value of 0.8 mJy beam−1 . The angular resolution (HPBW) ranges from ~0.3″ to ~0.8″ with a median value of 0.6″ that corresponds to ~4900 au at the distance of Sgr B2 (8.2 kpc, Reid et al. 2019). An improved version of the data reduction as described by Melosso et al. (2020) was used for this work. A detailed description of the procedure that was followed to subtract the continuum emission can be found in Sect. 2.2 of Belloche et al. (2019), complemented by Sect. 4.1 of Melosso et al. (2020). It is difficult to estimate the uncertainty on the subtracted continuum level in a robust way because of spectral confusion. From our experience in modeling the line spectra of the ReMoCA survey, we believe that this uncertainty may be in some cases on the same order as the noise level itself. However, we emphasize that our continuum-subtraction procedure is applied to each spectral window of 1.8 GHz width as a whole, and therefore is not affected by spectral confusion that arises at scales of tens or hundreds of MHz.
We analyzed the spectrum obtained toward the position Sgr B2(N1S) at (α, δ)J2000 = (17h47m19s.870, −28°22′19″.48) following the strategy employed by Belloche et al. (2019). This position is offset by about 1″ to the south of the main hot core Sgr B2(N1) and has a lower continuum opacity compared to the peak of the hot core. We assumed local thermodynamic equilibrium (LTE) and produced synthetic spectra with the astronomical software Weeds (Maret et al. 2011) in order to analyze the observed spectrum. The LTE assumption is justified by the high densities of the regions where hot-core emission is detected in Sgr B2(N) (>1 × 107 cm−3, see Bonfand et al. 2019). We derived a best-fit synthetic spectrum for each molecule separately, and then added the contributions of all identified molecules together. We used a set of five parameters to model the contribution of each species: size of the emitting region (θs), column density (N), temperature (Trot), line width (ΔV), and velocity offset (Voff) with respect to the assumed systemic velocity of the source, Vsys = 62 km s−1. For nondetected species, the synthetic spectra that were used to derive their column density upper limits (red spectra in the figures) are conservative in the sense that they have synthetic peak temperatures that are sometimes slightly higher than the 3σ noise level (dotted lines in the figures) or slightly above the signals detected by ALMA (black spectra in the figures), implicitly accounting for the additional (uncertain) uncertainty that affects the baseline level. In this way, we are confident that the upper limits do not underestimate the actual column densities of the nondetected species. For molecules that are detected (see, e.g., Belloche et al. 2019), the emission size is measured with Gaussian fits to the integrated intensity maps of their uncontaminated transitions. The velocity offset and velocity width are determined directly from the individual line profiles. The rotation temperature is estimated from a population diagram. Finally, the only remaining free parameter, the column density, is adjusted manually until a good visual match between the synthetic and observed spectra is obtained. For an undetected species, the first four parameters are fixed to values obtained for a related species and the column density is varied until discrepancies at the ~3σ level appear between the synthetic and observed spectra. This yields the column density upper limit of the undetected species.
Parameters of our best-fit LTE model of methyl isocyanate toward Sgr B2(N1S) and upper limits for ethyl isocyanate and vinyl isocyanate.
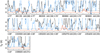 |
Fig. 3 Transitions of vinyl isocyanate trans-C2H3NCO covered by the ReMoCA survey. The LTE synthetic spectrum used to derive the upper limit on the column density of trans-C2H3NCO, v = 0 is displayed in red and overlaid on the observed spectrum of Sgr B2(N1S) shown in black. The blue synthetic spectrum contains the contributions of all molecules identified in our survey so far, but does not include the contribution of the species shown in red. The central frequency is indicated in megahertz (MHz) below each panel as well as the half-power beam width on the left, the width of each panel in MHz in parentheses, and the continuum level of the baseline-subtracted spectra in Kelvin (K) in brackets. The y-axis is labeled in brightness temperature units (K). The dotted line indicates the 3σ noise level. The figure only shows the transitions of trans-C2H3NCO for which the red synthetic spectrum has a significant peak temperature (compared to the noise level) and which are not too heavily blended with much stronger emission of other molecules. |
5.2 Nondetection of vinyl isocyanate
In order to search for vinyl isocyanate, C2H3NCO, toward Sgr B2(N1S), we relied on the LTE parameters derived for methyl isocyanate, CH3NCO, toward the same source by Belloche et al. (2019) with the ReMoCA survey. These parameters are listed in Table 3. Assuming that the more complex molecule, vinyl isocyanate, traces the same region as methyl isocyanate, we produced LTE synthetic spectra for the former species adopting the same parameters as for the latter with only the column density left as a free parameter. We employed the spectroscopic predictions derived for the trans and cis isomers of vinyl isocyanate in Sect. 4 to compute their LTE synthetic spectra. None of these conformers is detected toward Sgr B2(N1S), as illustrated in Figs. 3 and 4. The upper limit on the total column density of vinyl isocyanate derived from each conformer is reported in Table 3, after accounting for the vibrational partition function  provided in Sect. 4.
We also report in Table 3 the column density upper limit that we obtained with the ReMoCA survey for ethyl isocyanate, C2H5 NCO. The nondetection of this molecule, both in its torsional ground state and its first torsionally excited state, is illustrated in Figs. 5 and 6, respectively. We employed the spectroscopic entry 71508 (version 1) of the Cologne Database for Molecular Spectroscopy1 (CDMS, Müller et al. 2005) to compute the LTE synthetic spectra of the torsional ground state used to derive the upper limit to the column density of ethyl isocyanate. This CDMS entry is mainly based on the measurements reported in Kolesniková et al. (2018). For the first torsionally excited state, we used spectroscopic predictions from Kolesniková et al. (2018) prepared in electronic format by one of the authors of the present paper. The upper limit given in Table 3 accounts for the (substantial) vibrational correction that was estimated using the energies of the vibrational modes derived by Durig et al. (2010) for ethyl isocyanate. This upper limit holds under the assumption that a single conformation exists for this species. A single form with quite a large number of molecules in excited torsional states is suggested from the room-temperature microwave and mm wave spectroscopy of gas phase samples (Sakaizumi et al. 1976; Kolesniková et al. 2018). Infrared spectroscopic data of ethyl isocyanate dissolved in liquid noble gases were, on the other hand, interpreted as a mixture of the cis and trans forms on the basis of quantum-chemical calculations (Durig et al. 2010). However, these calculations are strongly dependent on the basis set used and predict a very low barrier for the conformational interchange which could even fall into a calculation error.
The most stringent constraint on the column density of vinyl isocyanate is obtained from its trans conformer. We find that vinyl isocyanate is at least 11 times less abundant than methyl isocyanate toward Sgr B2(N1S). This is a factor of about two less stringent than the limit found on the basis of the trans conformer of vinyl isocyanate by Rodriguez-Almeida et al. (2021) toward G+0.693-0.027, a shocked region located close to Sgr B2(N) (CH3NCO/trans-C2H3NCO > 26). For the cis conformer, which was considered to be an independent species, these latter authors obtained a lower limit of 7 for CH3NCO/cis-C2H3NCO but this cannot be compared directly to the ratio we report in Table 3 because, for the high densities of Sgr B2(N1S), we assume an LTE distribution of both conformers, and not independent species. Because of its large vibrational partition function, the upper limit we obtained for ethyl isocyanate toward Sgr B2(N1S) is less stringent than for vinyl isocyanate: we find that ethyl isocyanate is at least three times less abundant than methyl isocyanate. For comparison, propanal, C2H5CHO, and ethylamine, C2H5NH2, were both found to be at least five times less abundant than acetaldehyde, CH3CHO, and methylamine, CH3NH2, respectively, toward Sgr B2(N1S) with the ReMoCA survey (Sanz-Novo et al. 2022; Margulès et al. 2022). Therefore, it is likely that ethyl isocyanate is at least twice less abundant than the upper limit derived above, which would be in line with the ratio CH3NCO/C2H5NCO of 8 found by Rodriguez-Almeida et al. (2021) toward G+0.693-0.027. In contrast, the upper limit obtained for vinyl isocyanate toward Sgr B2(N1S) is slightly more stringent than the one derived toward the same source for vinylamine, C2H3NH2, which was found to be at least eight times less abundant than methylamine (Margulès et al. 2022).
6 Discussion
6.1 Laboratory spectroscopy of vinyl isocyanate
Isocyanates are rather flexible molecules with many anomalies in their rotational spectra (Yamada 1980; Koput 1984; Cernicharo et al. 2016; Pienkina et al. 2017; Kolesniková et al. 2018; Kolesniková et al. 2019), and this has also proven to be the case for vinyl isocyanate. The ground-state rotational spectrum of the trans isomer suffers from strong perturbations which means that only transitions involving levels up to Ka = 6 can be analyzed without the loss of physical meaning of the fitted constants. The origin of these perturbations can be understood once excited vibrational states are taken into consideration and the reduced energy level diagram (Fig. 7) is plotted. Three excited vibrational states, namely v18 = 1, v13 = 1, and v18 = 2, fall into the energy window of 200 cm−1 . Figure 1 shows that our spectrum exhibits noticeable patterns assignable to these states on the basis of the spectroscopic constants from Kirby & Kroto (1978); however, their low Ka transitions were already heavily perturbed. Kirby & Kroto (1978) estimated the frequencies of the associated vibrational modes ν18 and ν13 to 77(10) cm−1 and 200(20) cm−1 , respectively, from microwave relative intensity measurements. We find remarkable agreement between the literature value and the anharmonic frequency of 78 cm−1 for the ν18 vibrational mode from our quantum-chemical calculations. On the other hand, our computations indicated a significantly lower frequency for the ν13 mode (136 cm−1) than previously reported. This lower value leads to better agreement with our experimental spectrum; the rotational transitions in v13 = 1 have on average slightly higher relative intensities than the same transitions in v18 = 2 which is estimated to lie at 155 cm−1.
The excited vibrational states v18 = 1 and v13 = 1 are involved in a strong non-resonant Coriolis interaction, repelling each other, as evidenced by their A rotational constants (54 601 and 70 532 MHz for v18 = 1 and v13 = 1, respectively, Kirby & Kroto 1978). The rotational energy levels in v18 = 1 are therefore pushed down. As the ground-state rotational constant A is considerable (~2 cm−1 or 62 586 MHz) in comparison with the energy of v18 = 1, the rotational levels in the ground state quickly reach the energy levels of v18 = 1 and rovibrational interactions may already appear for Ka = 7 of the ground state (see Fig. 7). Resonant interactions between v18 = 1 and v13 = 1 (e.g., between Ka = 8 and 5, Ka = 9 and 6, etc.) will further complicate the situation. Figure 7 also shows that the v13 = 1 state lies close to v18 = 2 in terms of energy and their rotational energy levels cross at Ka = 5 and 6. The effects of this Fermi interaction might be non-negligible, as shown in n-propyl cyanide (Liu et al. 2019) for example.
We conclude that the ground vibrational state cannot be completely analyzed without v18 = 1, which cannot be treated without v13 = 1, which in turn cannot be analyzed without v18 = 2. Similar interactions among multiple vibrational states were observed in the rotational spectra of quasi-linear molecules such as HNCO (Yamada 1980) and hydrazoic acid (HN3, Hegelund & Bendtsen 1987; Vávra et al. 2017) and other near-prolate species such as vinyl cyanide (C2H3CN, Kisiel et al. 2009, Kisiel et al. 2012) and n-propyl cyanide (n-C3H7CN, Liu et al. 2019). The above network of interacting states is already very complicated and is expected to be even more complex because of possible coupling with other excited vibrational states which are not included in Fig. 7 for simplicity. In particular, v18 = 3, (v18 = 1, v13 = 1), and v13 = 2 might be at play and would make the analysis extremely challenging. A logical step toward the understanding of these interactions would be the measurement and analysis of a high-resolution vibrational spectrum of vinyl isocyanate. For the time being, we prefer to make our laboratory data available for astrophysical applications even though our data set is limited in terms of Ka in comparison with “well-behaved” molecular systems. We emphasize that given the large value of the A rotational constant, Ka = 6 is more than sufficient to identify the molecule in fairly warm environments such as hot cores. Of course, our results are also perfectly suitable for a search of the molecule in colder interstellar sources.
For CH3NCO, only Ka ≤ 3 transitions were experimentally accessible when searching for it in space and were sufficient for its detection (Halfen et al. 2015; Cernicharo et al. 2016).
The set of the spectroscopic constants for trans vinyl isocyanate obtained in this work is definitely more complete and accurate in comparison with the original work of Kirby & Kroto (1978). Table 1 illustrates that the previous values for the rotational and quartic centrifugal distortion constants are improved by up to two orders of magnitude. Furthermore, the physical meaning of those newly determined quantities is corroborated by the agreement between the fitted values and their quantum-chemical counterparts in Table 1. Spectral predictions for Ka < 7 generated using these constants therefore serve as an accurate observational reference, at least in the case where these are interpolations within the measured data sets. Although some transitions may reveal satisfactory predictive power outside the present data region, we do not recommend such extrapolations due to the amount and complexity of perturbations expected to appear at higher frequencies.
Our final remarks concern the spectroscopic constants for cis vinyl isocyanate. We can infer from Table 1 that their values are significantly better determined than they were previously; some of them by two orders of magnitude. In addition, many centrifugal distortion constants are determined for the first time. Table 1 further illustrates that the cis isomer analysis called for inclusion of centrifugal distortion terms up to power ten in angular momentum. The requirement for such a high expansion of the rotational Hamiltonian might be indicative of rovibrational interactions with low-lying excited vibrational states. Here, the low-energy states v18 = 1 and v13 = 1 are predicted by our quantum-chemical calculations at 90 and 110 cm−1, respectively.
As the rotational constant A is three times smaller than that of the trans isomer, such interaction would affect the rotational energy levels with higher Ka. To assess whether the interaction results in contributions to the centrifugal distortion constants, one can compare their experimental and quantum-chemical values. Table 1 shows that there is a close correspondence between our quartic and sextic constants and those calculated at CCSD/cc-pVTZ level of theory except for ϕJK which is opposite in sign. Therefore, if there existed an interaction with excited vibrational states, it would probably become noticeable at the sextic and higher order level of the Hamiltonian. Unfortunately, we did not find the rotational transitions in excited vibrational states in our spectra needed to address this issue.
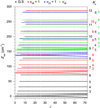 |
Fig. 7 Diagram of reduced energies for the ground state (black), v18 = 1 (red), v13 = 1 (blue), and v18 = 2 (green) excited vibrational states in trans vinyl isocyanate. The reduced energies Ered are calculated as Ered = E − (B + C)J(J + 1)/2 where E corresponds to the energy of rotational levels. Their values are obtained from the experimental spectroscopic constants and calculated vibrational energies. |
6.2 The chemistry of methyl, vinyl, and ethyl isocyanate
6.2.1 Methyl isocyanate
While methyl isocyanate is the only one of the three molecules listed in Table 3 to have been definitively detected in our survey, the chemistry by which it forms is still uncertain. Halfen et al. (2015) proposed gas-phase reactions between the methyl radical, CH3, and either HNCO (isocyanic acid) or HOCN (cyanic acid) as plausible mechanisms:
 (1)
(1)
 (2)
(2)
While HNCO is substantially more abundant than HOCN in the ISM (Brünken et al. 2010), it is also the most stable structure; as noted by Halfen et al. (2015), reaction (1) should be endothermic. However, precise determination of this is challenging, as the enthalpy of formation of methyl isocyanate is poorly defined in the literature. The CRC Handbook of Chemistry and Physics (Haynes et al. 2017) provides only a value for the liquid phase (Δf H0(l) = −92.0 kJ mol−1) and not for the gas phase. However, even crudely adjusting this value to take account of the enthalpy of vaporization, it appears almost certain that reaction (1) would be highly endothermic (by more than 100 kJ mol−1). Calculations by Majumdar et al. (2017) indeed indicate the reaction to be endothermic by 77 kJ mol−1 , with a transition state that lies 83 kJ mol−1 above the entrance level. Furthermore, it is likely that even reaction (2) is somewhat endothermic. Substantial activation energy barriers might also be expected for both reactions, suggesting that either route would be quite inefficient in the ISM.
Halfen et al. (2015) also proposed ion-molecule reactions between HNCO/HOCN and  to produce protonated methyl isocyanate; however, such processes involving
  typically result in proton transfer in laboratory experiments, indicating that protonated HNCO/HOCN would be the preferred products. It therefore remains unclear whether there is a plausible gas-phase mechanism that could produce CH3NCO in sufficient quantities to explain observations. As noted by Cernicharo et al. (2016), the detection of CH3NCO only in high-temperature regions may indicate that methyl isocyanate originates on dust-grain surfaces.
Chemical models have been used to study the formation of CH3NCO and related species on interstellar dust grains. Belloche et al. (2017) considered a direct radical-radical association reaction:
 (3)
(3)
The radicals would be produced by the photodissociation of, or chemical H-abstraction from, CH4 and HNCO in the dust-grain ice mantles, while CH3 could also be produced by repetitive H addition to atomic carbon on the grain or ice surfaces. Experiments presented by Ligterink et al. (2017) indeed show that CH3NCO may be formed by UV irradiation of mixed CH4:HNCO ices. The precise mechanism of production was not determined, but was assumed to be either reaction (3) or reaction (1), which would also be endothermic in the solid phase. As with reaction (1), the alternative branch CH3 + HNCO → CH4 + OCN is endothermic. However, the production of excited CH3 as a photoproduct of CH4 might be sufficient to remove these difficulties in both cases. Ligterink et al. also proposed that the OCN− ion, which was produced abundantly in the experiments, could be active in forming CH3NCO. In their observational study, Ligterink et al. (2021) concluded that reaction (3), occurring during the dark cloud stage of evolution, would be a plausible explanation for the uniform CH3NCO/HNCO ratio of around 10% observed toward various sources.
The astrochemical model of Belloche et al. (2017) indicated that, given an appropriate degree of grain-surface formation of HNCO, methyl isocyanate could also be formed on the grains during the warm-up phase of a hot core via reaction (3). The radicals would become mobile, and thus reactive, at elevated temperatures; the model results provided an acceptable match to the observed abundances.
However, the more recent models of Garrod et al. (2022) have challenged the purely diffusive picture of hot-core grain-surface chemistry by including so-called nondiffusive reactions on the grain surfaces and within the bulk ices (Jin & Garrod 2020). Furthermore, these models restrict the mobility of most chemical species in the bulk, allowing only H and H2 to diffuse internally. Larger species may diffuse only on the grain/ice surfaces themselves. The nondiffusive reaction mechanisms in the model nevertheless allow radical-radical reactions in the bulk ice to occur, but with rates driven by the processes that initiate the radical production that precedes them. In this scenario, the efficiency of bulk-ice chemistry is only weakly determined by the ice temperature, while radical reactions in the bulk can occur in principle at any temperature if, for example, photodissociation of a stable molecule in the bulk ice occurs in the presence of a radical with which one of the photoproducts may rapidly react.
Unfortunately, in these new models, CH3NCO is severely underproduced on the grains; OCN radicals tend to recombine quickly with mobile H atoms, both on the surface and in the bulk ice, providing little opportunity for reaction with CH3. Furthermore, the endothermicity of the H-abstraction reaction H + HNCO → OCN + H2 removes an alternative means of reforming OCN and thus raising its abundance on the grains. Meanwhile, a competing process, H + HNCO → NH2CO, is exothermic with only a modest barrier (1390 K; Nguyen et al. 1996). The removal of the bulk diffusion mechanisms for OCN and CH3 also inhibits the diffusive reactions that produced CH3NCO effectively at higher temperatures in the older models. On the other hand, HNCO is itself formed effectively on the grain surfaces at very low temperatures in these models (see Garrod et al. 2022), through the barrier-mediated reaction NH + CO → HNCO. Therefore, while photodissociation of CH4 and HNCO, followed by radical addition, still appears to be the main production mechanism for methyl isocyanate in the newest astrochemical models, the resulting abundances are several orders of magnitude lower than the observed values.
Several other gas-grain modeling studies have been conducted to explain observed gas-phase CH3NCO abundances toward cold sources and warm star-forming regions (Martín-Doménech et al. 2017; Quénard et al. 2018). Those models adopted the gas-phase and grain-surface reaction mechanisms noted above; they concluded that reactions (1) and (2) are dominant contributors to CH3NCO production following ice mantle desorption based on the reactions occurring at the collisional rate, that is, somewhere on the order of 10−10 cm3 s−1. However, as noted above, the substantial endothermicities of those reactions would likely render them highly inefficient; some alternative formation mechanism would therefore still be required, whether in the gas phase or on the grains.
Noting the problems with the suggested gas-phase reactions, Majumdar et al. (2017) proposed two new mechanisms for grain-surface CH3NCO production. The first involves the reaction of an H atom with an HCN molecule while the latter is in a van der Waals complex with a CO molecule:
 (4)
(4)
The energy produced in the initial reaction would allow the activation energy barrier to be overcome for an immediate follow-on reaction, producing CH2 NCO; the latter radical could then be rapidly hydrogenated by H to form methyl isocyanate. The other mechanism proposed by these authors involves a barrierless reaction between atomic N and the radical CH3CO, for which they calculate that the production of CH3NCO is the most energetically favorable outcome:
 (5)
(5)
Majumdar et al. (2017) find that reactions (4) and (5) contribute sufficient production of CH3NCO so as to explain observational values. However, the efficiency of reaction (4) is not well defined and is dependent on the precise reaction dynamics involved, as well as on the choice of barrier to the initial reaction. Reaction (5) relies on the hydrogenation of ketene (CH2CO) to form the necessary radical, which is also a barrier-dependent process. The results are encouraging, although further testing of these mechanisms is likely required to determine their true effectiveness.
One further mechanism might be plausible for grain-surface production of CH3NCO. Garrod et al. (2022) introduced a number of new reactions into their chemical network involving methylene, CH2. In its ground (triplet) state, methylene is a diradical; Garrod et al. proposed that H-abstraction reactions involving CH2 and stable molecules on grain surfaces would lead to production of two radicals that could immediately react with each other to form a single product. It is unclear whether the initial abstraction reaction between CH2 and HNCO would be exothermic, but it would almost certainly have an activation energy barrier. However, a direct addition reaction,
 (6)
(6)
would be strongly exothermic (~300 kJ mol−1). The attack of the methylene radical on the C=N double bond in HNCO would likely have an activation energy barrier, although the large exothermicity of the reaction might suggest a relatively small barrier compared with, for example, the above-mentioned addition reaction H + HNCO → NH2CO (exothermic by around 140 kJ mol−1 ). However, as the methylene reaction does not explicitly involve an H atom, there may be no quantum tunneling mechanism available to overcome the barrier, unlike in the case of many grain-surface reactions involving atomic H. The determination of the efficiency of reaction (6) would require detailed calculations, but if CH2 is a common photodissociation product of CH4, as is often assumed in the chemical networks, then the spontaneous production of methylene in proximity to HNCO in the bulk ice could plausibly produce methyl isocyanate in appreciable quantities. Likewise, if the abstraction process is exothermic, then H-atom tunneling between HNCO and CH2 might allow it to proceed effectively, producing CH3NCO in a two-step process. As well as the bulk ice process, the formation of CH2 on the grain/ice surface from atomic carbon might also lead to reaction with HNCO. Such a mechanism would presumably retain the observationally determined correlation between HNCO and CH3NCO (Ligterink et al. 2021; Colzi et al. 2021), once both molecules were desorbed into the gas phase at elevated temperatures.
Alternatively, as mentioned above, if CH3 is formed in an excited state through CH4 photodissociation in the bulk ice, direct reaction of the methyl radical with abundant HNCO might proceed efficiently.
6.2.2 Vinyl and ethyl isocyanate
In spite of the nondetection of vinyl and ethyl isocyanate toward Sgr B2(N1S), it is valuable to consider their possible production mechanisms. Although we do not currently have chemical models that include either species, we may speculate on possible outcomes based on molecules that are presently included.
The lack of a gas-phase formation mechanism for CH3NCO would also suggest that chemistry on grains or within the ice mantles is the most plausible scenario for the larger molecules. We may again propose radical addition reactions involving OCN:
 (7)
(7)
 (8)
(8)
Reaction (8) was first suggested by Rodriguez-Almeida et al. (2021). Assuming that reaction (3) is the most important process for CH3NCO production, the relative abundances of the radicals CH3, C2H3, and C2H5 in the ice might indicate the expected ratio of the isocyanates (on the expectation that the photodissociation of HNCO would provide the driving rate for all three reactions, (3), (7), and (8)). However, in the new Garrod et al. (2022) models, the ratios of the peak abundances (during the cold collapse stage) are approximately CH3:C2H3:C2H5 = 30:1:65. While this appears consistent with the observed ratio of the column density of methyl isocyanate to the upper limit for vinyl isocyanate, it would also indicate that the abundance of ethyl isocyanate should exceed that of methyl isocyanate. As noted in Sect. 5.2, such a large ratio is not expected.
However, reaction (3) does not produce adequate quantities of CH3NCO in the models. If an alternative process is active at least for the production of this molecule, while reactions (7) and (8) were to remain the principal routes to vinyl and ethyl cyanide, then this would indicate that the real column densities of the latter species should be far less than the observational upper limits.
If the methylene reaction proposed above – reaction (6) – should in fact be the dominant production route for CH3NCO, then the absence of analogous mechanisms that form vinyl and ethyl cyanide is readily understood; there are no equivalent chemical species that would produce C2H3NCO or C2H5NCO by a similar reaction with HNCO. In this case, the most likely production mechanism for ethyl isocyanate could be the photodissociaton of, or H-abstraction from, methyl isocyanate itself, followed by the addition of a methyl group, e.g.,
 (9)
(9)
 (10)
(10)
The H-abstraction initiated process might include the two-step insertion of methylene into a C-H bond in methyl isocyanate. The astrochemical models indicate that in cases in which H-abstraction/photodissociation and methyl addition is the main formation mechanism, such as with ethylamine production from methylamine, the smaller homolog achieves an approximately ten times greater abundance than that of the larger homolog. This would be in line with our observational ratio of methyl to ethyl isocyanate. Furthermore, Rodriguez-Almeida et al. (2021) recently detected ethyl isocyanate toward the Galactic center cloud G+0.693-0.027, finding a ratio CH3NCO:C2H5NCO= 8 ± 1 , which is also in good agreement with the typical modeling outcome.
Once again, there is unlikely to be a comparable mechanism leading to formation of a vinyl group, which would also tend to make the abundance of vinyl isocyanate inferior to those of the other two species.
The above ideas are of course highly speculative. A full chemical model including all of these species would be desirable, although there remain a number of poorly-defined quantities that could be important; not least, the possible efficiency of reaction (6), and the precise mechanisms involved in experimental UV-induced production of methyl isocyanate.
7 Conclusions
We carried out laboratory rotational spectroscopy of vinyl isocyanate in the frequency regions 127.5−218 and 285−330 GHz. Over 1000 transition lines were assigned and measured for the ground vibrational states of its trans and cis isomers. The present work provides significantly more precise values of the spectroscopic parameters, which agree with those from accompanying high-level quantum-chemical computations. We report a nondetection of both vinyl and ethyl isocyanate toward the main hot core of Sgr B2(N) with ALMA. We find that these molecules are at least 11 and 3 times less abundant than methyl isocyanate, respectively. Despite the nondetection of vinyl isocyanate in Sgr B2(N), the present work represents a substantial improvement on previous microwave studies below 40 GHz and provides accurate reference data for further searches for this species in interstellar space. To this end, spectral predictions are provided in Tables A.5 and A.6 and will also be available in CDMS.
Acknowledgements
The spectroscopic part of this work has been funded by the Czech Science Foundation (GACR, grant No. 19-25116Y). L.K., K.V., J.K., and K.L. gratefully acknowledge this financial support. L.K., J.K., K.L., and P.K. thank the financial support from the Ministry of Education, Youth and Sports of the Czech Republic (MSMT) within the Mobility grant No. 8J21FR006. Computational resources were supplied by the project “e-Infrastruktura CZ” (e-INFRA CZ LM2018140) supported by the Ministry of Education, Youth and Sports of the Czech Republic. Computational resources were provided by the ELIXIRCZ project (LM2018131), part of the international ELIXIR infrastructure. R.T.G. thanks E. Herbst for helpful discussions. This paper makes use of the following ALMA data: ADS/JAO.ALMA#2016.1.00074.S. ALMA is a partnership of ESO (representing its member states), NSF (USA), and NINS (Japan), together with NRC (Canada), NSC and ASIAA (Taiwan), and KASI (Republic of Korea), in cooperation with the Republic of Chile. The Joint ALMA Observatory is operated by ESO, AUI/NRAO, and NAOJ. The interferometric data are available in the ALMA archive at https://almascience.eso.org/aq/. Part of this work has been carried out within the Collaborative Research Centre 956, subproject B3, funded by the Deutsche Forschungsgemeinschaft (DFG) - project ID 184018867. R.T.G. acknowledges funding from the Astronomy & Astrophysics program of the National Science Foundation (grant No. AST 19-06489). J.-C.G. thanks the Barrande project no. 46662VH, the Centre National d’Études Spatiales (CNES) and the “Programme National Physique et Chimie du Milieu Interstellaire” (PCMI) of CNRS/INSU with INC/INP co-funded by CEA and CNES for a grant.
Appendix A Complementary tables
Table A.1 lists the frequencies of normal vibrational modes of trans and cis isomers of vinyl isocyanate. Table A.2 lists the measured transitions of trans vinyl isocyanate. Table A.3 lists the measured transitions of cis vinyl isocyanate. Table A.4 lists the rotational partition functions for cis vinyl isocyanate with the 000 energy level set to 0 cm−1. Table A.5 lists the JPL/CDMS line catalog for trans vinyl isocyanate. Table A.6 lists the JPL/CDMS line catalog for cis vinyl isocyanate.
Harmonic and anharmonic frequencies of normal vibrational modes for trans and cis isomers of vinyl isocyanate calculated at CCSD/cc-pVTZ level of theory.
List of the measured transitions of trans vinyl isocyanate.
List of the measured transitions of cis vinyl isocyanate.
Rotational partition functions for cis vinyl isocyanate with the 00.0 energy level set to 0 cm−1.
JPL/CDMS catalog line list for trans vinyl isocyanate.
JPL/CDMS catalog line list for cis vinyl isocyanate.
References
- Badawi, H., Förner, W., & Al-Saadi, A. 2001, J. Mol. Struct.: THEOCHEM, 535, 183 [CrossRef] [Google Scholar]
- Belloche, A., Müller, H. S. P., Garrod, R. T., & Menten, K. M. 2016, A&A, 587, A91 [NASA ADS] [CrossRef] [EDP Sciences] [Google Scholar]
- Belloche, A., Meshcheryakov, A. A., Garrod, R. T., et al. 2017, A&A, 601, A49 [NASA ADS] [CrossRef] [EDP Sciences] [Google Scholar]
- Belloche, A., Garrod, R. T., Müller, H. S. P., et al. 2019, A&A, 628, A10 [NASA ADS] [CrossRef] [EDP Sciences] [Google Scholar]
- Bisschop, S. E., Jørgensen, J. K., Bourke, T. L., Bottinelli, S., & van Dishoeck, E. F. 2008, A&A, 488, 959 [NASA ADS] [CrossRef] [EDP Sciences] [Google Scholar]
- Bonfand, M., Belloche, A., Garrod, R. T., et al. 2019, A&A, 628, A27 [NASA ADS] [CrossRef] [EDP Sciences] [Google Scholar]
- Bouchy, A., & Roussy, G. 1977, J. Mol. Spectrosc., 68, 156 [NASA ADS] [CrossRef] [Google Scholar]
- Bouchy, A., & Roussy, G. 1979, J. Mol. Spectrosc., 77, 145 [NASA ADS] [CrossRef] [Google Scholar]
- Brown, R. L. 1981, ApJ, 248, L119 [NASA ADS] [CrossRef] [Google Scholar]
- Brünken, S., Belloche, A., Martín, S., Verheyen, L., & Menten, K. M. 2010, A&A, 516, A109 [NASA ADS] [CrossRef] [EDP Sciences] [Google Scholar]
- Buhl, D., Snyder, L. E., & Edrich, J. 1972, ApJ, 177, 625 [NASA ADS] [CrossRef] [Google Scholar]
- Canelo, C. M., Bronfman, L., Mendoza, E., et al. 2021, MNRAS, 504, 4428 [NASA ADS] [CrossRef] [Google Scholar]
- Cernicharo, J., Kisiel, Z., Tercero, B., et al. 2016, A&A, 587, A4 [NASA ADS] [CrossRef] [EDP Sciences] [Google Scholar]
- Cernicharo, J., Agúndez, M., Cabezas, C., et al. 2021a, A&A, 647, A2 [NASA ADS] [CrossRef] [EDP Sciences] [Google Scholar]
- Cernicharo, J., Agúndez, M., Kaiser, R. I., et al. 2021b, A&A, 655, A1 [NASA ADS] [CrossRef] [EDP Sciences] [Google Scholar]
- Choe, J. C. 2021, ApJ, 914, 136 [CrossRef] [Google Scholar]
- Colzi, L., Rivilla, V. M., Beltrán, M. T., et al. 2021, A&A, 653, A129 [NASA ADS] [CrossRef] [EDP Sciences] [Google Scholar]
- Coutens, A., Jørgensen, J. K., van der Wiel, M. H. D., et al. 2016, A&A, 590, A6 [Google Scholar]
- Csengeri, T., Belloche, A., Bontemps, S., et al. 2019, A&A, 632, A57 [NASA ADS] [CrossRef] [EDP Sciences] [Google Scholar]
- Dunning, T. H. 1989, J. Chem. Phys., 90, 1007 [Google Scholar]
- Durig, J. R., Zhou, S. X., Zheng, C., & Durig, D. T. 2010, J. Mol. Struct., 971, 23 [NASA ADS] [CrossRef] [Google Scholar]
- Fourré, I., Matz, O., Ellinger, Y., & Guillemin, J.-C. 2020, A&A, 639, A16 [NASA ADS] [CrossRef] [EDP Sciences] [Google Scholar]
- Gardner, F. F., & Winnewisser, G. 1975, ApJ, 195, L127 [NASA ADS] [CrossRef] [Google Scholar]
- Garrod, R. T., Jin, M., Matis, K. A., et al. 2022, ApJS, 259, 1 [NASA ADS] [CrossRef] [Google Scholar]
- Gorai, P., Bhat, B., Sil, M., et al. 2020, ApJ, 895, 86 [Google Scholar]
- Gorai, P., Das, A., Shimonishi, T., et al. 2021, ApJ, 907, 108 [NASA ADS] [CrossRef] [Google Scholar]
- Gordy, W., & Cook, R. L. 1970, Microwave Molecular Spectra (Interscience Publishers) [Google Scholar]
- Gupta, H., Gottlieb, C. A., Lattanzi, V., Pearson, J. C., & McCarthy, M. C. 2013, ApJ, 778, L1 [Google Scholar]
- Halfen, D. T., Ilyushin, V. V., & Ziurys, L. M. 2015, ApJ, 812, L5 [Google Scholar]
- Haynes, W., Lide, D. R., & Bruno, T. J. 2017, in CRC Handbook of Chemistry and Physics, 97th edn. (Boca Raton, FL: CRC Press), 5, 27 [Google Scholar]
- Hegelund, F., & Bendtsen, J. 1987, J. Mol. Spectrosc., 124, 306 [NASA ADS] [CrossRef] [Google Scholar]
- Jin, M., & Garrod, R. T. 2020, ApJS, 249, 26 [Google Scholar]
- Jørgensen, J. K., Belloche, A., & Garrod, R. T. 2020, ArA&A, 58, 727 [CrossRef] [Google Scholar]
- Kania, P., Stříteská, L., Šimečková, M., & Urban, Š. 2006, J. Mol. Struct., 795, 209 [NASA ADS] [CrossRef] [Google Scholar]
- Kirby, C., & Kroto, H. 1978, J. Mol. Spectrosc., 70, 216 [NASA ADS] [CrossRef] [Google Scholar]
- Kisiel, Z., Pszczółkowski, L., Drouin, B. J., et al. 2009, J. Mol. Spectrosc., 258, 26 [NASA ADS] [CrossRef] [Google Scholar]
- Kisiel, Z., Pszczółkowski, L., Drouin, B. J., et al. 2012, J. Mol. Spectrosc., 280, 134 [NASA ADS] [CrossRef] [Google Scholar]
- Kolesniková, L., Alonso, E. R., Tercero, B., Cernicharo, J., & Alonso, J. L. 2018, A&A, 616, A173 [Google Scholar]
- Kolesniková, L., Kisiel, Z., Alonso, E. R., et al. 2019, ApJS, 245, 31 [Google Scholar]
- Koput, J. 1984, J. Mol. Spectrosc., 106, 12 [NASA ADS] [CrossRef] [Google Scholar]
- Koucký, J., Kania, P., Uhlíková, T., et al. 2013, J. Phys. Chem. A, 117, 10138 [CrossRef] [Google Scholar]
- Lee, K. L. K., Loomis, R. A., Burkhardt, A. M., et al. 2021, ApJ, 908, L11 [CrossRef] [Google Scholar]
- Ligterink, N. F. W., Coutens, A., Kofman, V., et al. 2017, MNRAS, 469, 2219 [Google Scholar]
- Ligterink, N. F. W., El-Abd, S. J., Brogan, C. L., et al. 2020, ApJ, 901, 37 [Google Scholar]
- Ligterink, N. F. W., Ahmadi, A., Coutens, A., et al. 2021, A&A, 647, A87 [NASA ADS] [CrossRef] [EDP Sciences] [Google Scholar]
- Liu, D., Walters, A., Wehres, N., et al. 2019, A&A, 622, A82 [NASA ADS] [CrossRef] [EDP Sciences] [Google Scholar]
- Loomis, F. W., & Wood, R. W. 1928, Phys. Rev., 32, 223 [NASA ADS] [CrossRef] [Google Scholar]
- Majumdar, L., Loison, J.-C., Ruaud, M., et al. 2017, MNRAS, 473, L59 [Google Scholar]
- Marcelino, N., Agúndez, M., Cernicharo, J., Roueff, E., & Tafalla, M. 2018, A&A, 612, L10 [NASA ADS] [CrossRef] [EDP Sciences] [Google Scholar]
- Maret, S., Hily-Blant, P., Pety, J., Bardeau, S., & Reynier, E. 2011, A&A, 526, A47 [NASA ADS] [CrossRef] [EDP Sciences] [Google Scholar]
- Margulès, L., Remijan, A., Belloche, A., et al. 2022, A&A, 663, A132 [NASA ADS] [CrossRef] [EDP Sciences] [Google Scholar]
- Martín-Doménech, R., Rivilla, V. M., Jiménez-Serra, I., et al. 2017, MNRAS, 469, 2230 [Google Scholar]
- MATLAB. 2020, Version 9.8.0.1451342 (R2020a) (Natick, Massachusetts: The MathWorks Inc.) [Google Scholar]
- Matthews, D. A., Cheng, L., Harding, M. E., et al. 2020, J. Chem. Phys, 152, 214108 [NASA ADS] [CrossRef] [Google Scholar]
- McCarthy, M. C., Lee, K. L. K., Loomis, R. A., et al. 2021, Nat. Astron., 5, 176 [Google Scholar]
- McGuire, B. A. 2022, ApJS, 259, 30 [NASA ADS] [CrossRef] [Google Scholar]
- Melosso, M., Belloche, A., Martin-Drumel, M.-A., et al. 2020, A&A, 641, A160 [NASA ADS] [CrossRef] [EDP Sciences] [Google Scholar]
- Müller, H. S. P., Schlöder, F., Stutzki, J., & Winnewisser, G. 2005, J. Mol. Struct., 742, 215 [Google Scholar]
- Nguyen, M. T., Sengupta, D., Vereecken, L., Peeters, J., & Vanquickenborne, L. G. 1996, J. Phys. Chem., 100, 1615 [CrossRef] [Google Scholar]
- Olsen, J. F. 1979, J. Mol. Struct., 57, 251 [NASA ADS] [CrossRef] [Google Scholar]
- Pickett, H. M. 1991, J. Mol. Spectrosc., 148, 371 [Google Scholar]
- Pienkina, A., Margulès, L., Motiyenko, R. A., & Guillemin, J. C. 2017, in 72nd International Symposium on Molecular Spectroscopy, WA03 [Google Scholar]
- Purvis, G. D., & Bartlett, R. J. 1982, J. Chem. Phys., 76, 1910 [NASA ADS] [CrossRef] [Google Scholar]
- Quénard, D., Jiménez-Serra, I., Viti, S., Holdship, J., & Coutens, A. 2018, MNRAS, 474, 2796 [Google Scholar]
- Reid, M. J., Menten, K. M., Brunthaler, A., et al. 2019, ApJ, 885, 131 [Google Scholar]
- Rivilla, V. M., Jiménez-Serra, I., Martín-Pintado, J., et al. 2021, PNAS, 118, e2101314118 [NASA ADS] [CrossRef] [Google Scholar]
- Rodríguez-Almeida, L. F., Rivilla, V. M., Jiménez-Serra, I., et al. 2021, A&A, 654, A1 [Google Scholar]
- Sakaizumi, T., Yamada, O., Ushida, K., Ohashi, O., & Yamaguch, I. 1976, Bull. Chem. Soc. Japan, 49, 2908 [CrossRef] [Google Scholar]
- Sanz-Novo, M., Belloche, A., Rivilla, V. M., et al. 2022, A&A, accepted Snyder, L. E., & Buhl, D. 1972, ApJ, 177, 619 [Google Scholar]
- Tercero, F., López-Pérez, J. A., Gallego, J. D., et al. 2021, A&A, 645, A37 [EDP Sciences] [Google Scholar]
- Urban, Š., & Sarka, K. 1990, J. Mol. Spectrosc., 144, 446 [NASA ADS] [CrossRef] [Google Scholar]
- Vávra, K., Kania, P., Koucký, J., Kisiel, Z., & Urban, Š. 2017, J. Mol. Spectrosc., 337, 27 [CrossRef] [Google Scholar]
- Vávra, K., Luková, K., Kania, P., Koucký, J., & Urban, Š. 2020, J. Mol. Struct., 1215, 128181 [CrossRef] [Google Scholar]
- Watson, J. K. G. 1977, in Vibrational Spectra and Structure, ed. J. R. Durig (Amsterdam: Elsevier), 6, 1 [Google Scholar]
- Yamada, K. 1980, J. Mol. Spectrosc., 81, 139 [NASA ADS] [CrossRef] [Google Scholar]
- Zeng, S., Jiménez-Serra, I., Rivilla, V. M., et al. 2018, MNRAS, 478, 2962 [Google Scholar]
- Zeng, S., Jiménez-Serra, I., Rivilla, V. M., et al. 2021, ApJ, 920, L27 [NASA ADS] [CrossRef] [Google Scholar]
All Tables
Spectroscopic constants for the trans and cis isomers of vinyl isocyanate in their ground vibrational states (A-reduction, IT-representation) in comparison with previously published results and quantum-chemical calculations.
Parameters of our best-fit LTE model of methyl isocyanate toward Sgr B2(N1S) and upper limits for ethyl isocyanate and vinyl isocyanate.
Harmonic and anharmonic frequencies of normal vibrational modes for trans and cis isomers of vinyl isocyanate calculated at CCSD/cc-pVTZ level of theory.
Rotational partition functions for cis vinyl isocyanate with the 00.0 energy level set to 0 cm−1.
All Figures
|
Fig. 1 Two isomers of vinyl isocyanate and their characteristic features in the room-temperature millimeter wave spectrum. The spectrum reveals compact groups of a-type R-branch transitions of the trans species in the ground state and v18 = 1, v13 = 1, and v18 = 2 excited vibrational states. Weaker a-type R-branch transitions of the less stable cis isomer are, at the present scale, observed in the form of significantly more diffuse groups. |
| In the text | |
|
Fig. 2 Perturbations in the ground-state rotational spectrum of trans vinyl isocyanate. The experimental spectrum is compared with predictions based on the analysis up to Ka = 6. All the assigned lines correspond to a-type R-branch transitions except that marked with a star which is the b-type 400,40 ← 391,39 transition. The blue diamond symbols highlight the transitions included in the fit while the red question marks indicate perturbed transitions that could not be confidently assigned. |
| In the text | |
|
Fig. 3 Transitions of vinyl isocyanate trans-C2H3NCO covered by the ReMoCA survey. The LTE synthetic spectrum used to derive the upper limit on the column density of trans-C2H3NCO, v = 0 is displayed in red and overlaid on the observed spectrum of Sgr B2(N1S) shown in black. The blue synthetic spectrum contains the contributions of all molecules identified in our survey so far, but does not include the contribution of the species shown in red. The central frequency is indicated in megahertz (MHz) below each panel as well as the half-power beam width on the left, the width of each panel in MHz in parentheses, and the continuum level of the baseline-subtracted spectra in Kelvin (K) in brackets. The y-axis is labeled in brightness temperature units (K). The dotted line indicates the 3σ noise level. The figure only shows the transitions of trans-C2H3NCO for which the red synthetic spectrum has a significant peak temperature (compared to the noise level) and which are not too heavily blended with much stronger emission of other molecules. |
| In the text | |
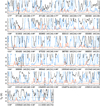 |
Fig. 4 Same as Fig. 3 but for cis-C2H3NCO, v = 0. |
| In the text | |
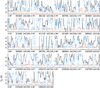 |
Fig. 5 Same as Fig. 3 but for C2H5NCO, v = 0. |
| In the text | |
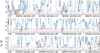 |
Fig. 6 Same as Fig. 3 but for C2H5NCO, vt = 1. |
| In the text | |
|
Fig. 7 Diagram of reduced energies for the ground state (black), v18 = 1 (red), v13 = 1 (blue), and v18 = 2 (green) excited vibrational states in trans vinyl isocyanate. The reduced energies Ered are calculated as Ered = E − (B + C)J(J + 1)/2 where E corresponds to the energy of rotational levels. Their values are obtained from the experimental spectroscopic constants and calculated vibrational energies. |
| In the text | |
Current usage metrics show cumulative count of Article Views (full-text article views including HTML views, PDF and ePub downloads, according to the available data) and Abstracts Views on Vision4Press platform.
Data correspond to usage on the plateform after 2015. The current usage metrics is available 48-96 hours after online publication and is updated daily on week days.
Initial download of the metrics may take a while.