| Issue |
A&A
Volume 660, April 2022
|
|
|---|---|---|
| Article Number | L6 | |
| Number of page(s) | 12 | |
| Section | Letters to the Editor | |
| DOI | https://doi.org/10.1051/0004-6361/202243038 | |
| Published online | 07 April 2022 | |
Letter to the Editor
The ALMA-PILS survey: First tentative detection of 3-hydroxypropenal (HOCHCHCHO) in the interstellar medium and chemical modeling of the C3H4O2 isomers
1
Institut de Recherche en Astrophysique et Planétologie (IRAP), Université de Toulouse, UPS, CNRS, CNES, 9 av. du Colonel Roche, 31028 Toulouse Cedex 4, France
e-mail: This email address is being protected from spambots. You need JavaScript enabled to view it.
2
Institut des Sciences Moléculaires (ISM), CNRS, Université Bordeaux, 351 cours de la Libération, 33400 Talence, France
3
I. Physikalisches Institut, Universität zu Köln, Zülpicher Str.77, 50937 Köln, Germany
4
Laboratoire d’astrophysique de Bordeaux, Univ. Bordeaux, CNRS, B18N, allée Geoffroy Saint-Hilaire, 33615 Pessac, France
5
Laboratoire d’Etudes Spatiales et d’Instrumentation en Astrophysique (LESIA), Observatoire de Paris, Université PSL, CNRS, Sorbonne Université, Université de Paris, 5 place Jules Janssen, 92195 Meudon, France
6
Niels Bohr Institute, University of Copenhagen, Øster Voldgade 5–7, 1350 Copenhagen K, Denmark
Received:
4
January
2022
Accepted:
21
March
2022
Abstract
Characterizing the molecular composition of solar-type protostars is useful for improving our understanding of the physico-chemical conditions under which the Sun and its planets formed. In this work, we analyzed the Atacama Large Millimeter/submillimeter Array (ALMA) data of the Protostellar Interferometric Line Survey (PILS), an unbiased spectral survey of the solar-type protostar IRAS 16293–2422, and we tentatively detected 3-hydroxypropenal (HOCHCHCHO) for the first time in the interstellar medium towards source B. Based on the observed line intensities and assuming local thermodynamic equilibrium, its column density is constrained to be ∼1015 cm−2, corresponding to an abundance of 10−4 relative to methanol, CH3OH. Additional spectroscopic studies are needed to constrain the excitation temperature of this molecule. We included HOCHCHCHO and five of its isomers in the chemical network presented in Manigand et al. (2021, A&A, 645, A53) and we predicted their chemical evolution with the Nautilus code. The model reproduces the abundance of HOCHCHCHO within the uncertainties. This species is mainly formed through the grain surface reaction CH2CHO + HCO → HCOCH2CHO, followed by the tautomerization of HCOCH2CHO into HOCHCHCHO. Two isomers, CH3COCHO and CH2COHCHO, are predicted to be even more abundant than HOCHCHCHO. Spectroscopic studies of these molecules are essential in searching for them in IRAS 16293–2422 and other astrophysical sources.
Key words: astrochemistry / stars: formation / stars: protostars / ISM: molecules / ISM: individual objects: IRAS 16293−2422
© A. Coutens et al. 2022
 Open Access article, published by EDP Sciences, under the terms of the Creative Commons Attribution License (http://creativecommons.org/licenses/by/4.0), which permits unrestricted use, distribution, and reproduction in any medium, provided the original work is properly cited.
1. Introduction
Characterizing the inventory of molecules in solar-type protostars is essential for gaining a better understanding of our origins, as such studies provide important clues about the chemical richness that was available at the time when the Sun and its planets formed. Large spectral surveys are ideal for identifying the variety of molecules present in these objects, which can lead to new molecular detections in space. Indeed, the number of first detections of molecules in the interstellar medium (ISM) continues to grow thanks to the improving capacities of the instruments in the centimeter, millimeter, and submillimeter range (McGuire 2022).
IRAS 16293−2422 (hereafter IRAS16293) is one of the most frequently studied solar-type protostars. The rich chemistry of this Class 0 protostellar system was studied in an unbiased way thanks to an array of large spectral surveys (e.g., IRAM-30m, JCMT, Herschel/HIFI, Caux et al. 2011; Ceccarelli et al. 2010). The Protostellar Interferometric Line Survey (PILS, Jørgensen et al. 2016), carried out with the Atacama Large Millimeter/submillimeter Array (ALMA), has contributed significantly to the characterization of the chemical content in this source. It revealed, for the first time, the presence of various complex organics in solar-type protostars such as c-C2H4O, C2H5CHO, CH3COCH3, CH3NCO, NH2CN, CH3NC, CH3OCH2OH, and t-C2H5OCH3 (e.g., Lykke et al. 2017; Ligterink et al. 2017; Coutens et al. 2018; Calcutt et al. 2018; Manigand et al. 2020). Over the last few years, the first interstellar detections of CH3Cl (Fayolle et al. 2017), HONO (Coutens et al. 2019), HOCH2CN (Zeng et al. 2019), and CH3C(O)CH2OH (Zhou et al. 2020) were also obtained with ALMA towards component B of this source. More recently, Manigand et al. (2021) investigated the chemistry of three-carbon molecules in this protostar. This study led to the additional detection of propenal (C2H3CHO) and propylene (C3H6) in IRAS16293 B, while upper limits were derived for other species (C3H8, HCCCHO, n-C3H7OH, i-C3H7OH, C3O).
In this Letter, we report the first tentative interstellar detection of another three-carbon species, 3-hydroxypropenal (HOCHCHCHO) towards IRAS16293 B using the ALMA-PILS data. This molecule is used as a biomarker to measure the level of oxidative stress in living organisms (e.g., Del Rio et al. 2005). It is produced via lipid peroxidation of polyunsaturated fatty acids (Pryor & Stanley 1975). The formation of this species in space is however unknown and, to our knowledge, it has never been predicted by astrochemical models. In the laboratory, C3H4O2 was recently found to be produced in interstellar ice analogs of carbon monoxide and water at 5 K after the irradiation of energetic electrons, however, it was not possible to discriminate the isomer through the experiment (Turner et al. 2021).
This Letter is organized as follows. We present the PILS observations in Sect. 2. We analyze the data in Sect. 3. Finally, we present the chemical modeling of HOCHCHCHO and its isomers and we discuss the results in Sect. 4.
2. Observations and spectroscopy
The three-carbon species 3-hydroxypropenal is the enol tautomeric form of malonaldehyde. The enolic cis form is strongly favored over the dialdehyde form of malonaldehyde because of the ability to form an intramolecular hydrogen bond (see Fig. 1). The hydrogen atom of this bond can move fairly easily from the CH2 group to the CHO group, thus exchanging the positions of the two groups. The tunneling is only slightly hindered, which leads to a splitting of 647 GHz (≈21.6 cm−1 ≈31 K). The spectroscopic data of HOCHCHCHO come from the Cologne Database for Molecular Spectroscopy (CDMS, Müller et al. 2001, 2005). More information is available in Appendix A.
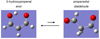 |
Fig. 1. Chemical representation of the tautomers of malonaldehyde. The enol form, 3-hydroxypropenal, is on the left, while the dialdehyde form, propanedial, is on the right. |
The ALMA/PILS survey is fully described in Jørgensen et al. (2016). In summary, these observations obtained with both the 12m array and the Atacama Compact Array (ACA) cover the entire range between 329.1 and 362.9 GHz (Band 7) with a resolution of 0.244 MHz (∼0.2 km s−1). The pointing center of the observations are taken to be in between IRAS16293A and IRAS16293B with both of them covered within the interferometric field of view. The sensitivity of the combined 12 m array and ACA observations is about 4–5 mJy beam−1 km s−1. The beam sizes vary between 0.4 and 0.7″ and the observations were restored with a circular beam of 0.5″. Besides the Band 7 observations, small spectral windows were also covered in Bands 3 and 6. More information about the data reduction, the continuum subtraction, and these additional data can be found in Jørgensen et al. (2016).
3. Analysis and results
Using a dedicated convolutional neural network (CNN) on a large set of multi-species synthetic spectra assuming local thermodynamic equilibrium (LTE, Boulanger et al. 2022), we predicted the presence of HOCHCHCHO in the PILS data with a probability greater than 50%. The applied spectrum corresponds to the component B of IRAS16293 at a position offset by 0.5″ (one beam) with respect to the continuum peak position in the south-west direction (αJ2000 = 16h32m22 58, δJ2000 = −24° 28′32.8″). This position is regularly used in the PILS studies to search for molecules and isotopologues, as the lines are relatively narrow (FWHM ∼ 1 km s−1) and bright without being affected by absorption features (e.g., Coutens et al. 2016; Lykke et al. 2017). We confirm that several lines can be identified as HOCHCHCHO with a classical analysis using the CASSIS1 software. As the lines are broader towards IRAS16293 A, it is not possible to identify isolated transitions of 3-hydroxypropenal toward that source.
Our analysis is similar to those presented in earlier studies (e.g., Coutens et al. 2016, 2019; Lykke et al. 2017; Ligterink et al. 2017). Synthetic spectra are produced assuming LTE for various values of column densities, N, and excitation temperatures, Tex. A χ2 method is then used on the unblended lines to derive the best fit parameters. To ensure that the lines are not blended with other species, we overlaid the model including the species previously identified in this source. We added HONO (Coutens et al. 2019), CH3OCH2OH, CH2DCHO, t-C2H5OCH3 (Manigand et al. 2020), C2H3CHO, C3H6 (Manigand et al. 2021), and CH3OCHD2 (Richard et al. 2021) to the list presented in Appendix A of Coutens et al. (2019). We excluded from the analysis all the transitions with large uncertainties according to the spectroscopy (see Appendix A) those that are significantly blended with other species as well as a few that were affected by absorption features (see Table B.4). In total, we found 11 lines (≳20 mJy beam−1) that could be associated to HOCHCHCHO towards IRAS16293 B (see Fig. 2, Tables 1 and B.1).
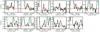 |
Fig. 2. Lines identified as HOCHCHCHO towards IRAS16293 B. The observations are in black. The model with N = 1.0 × 1015 cm−2 and Tex = 125 K is overlaid in red. The green line corresponds to the model which includes the previous molecules identified in the PILS survey. The lines at 333.1545, 341.8653, 356.3017, and 362.2382 GHz could be partially blended with unknown species. |
Transitions identified as HOCHCHCHO towards IRAS 16293 B.
To constrain the best-fit parameters, we ran two grids: one with large steps followed by another one around the best model with smaller steps (ΔN = 2 × 1014 cm−2, ΔT = 25 K). For this second grid, the column density ranged from 2 × 10¹⁴ to 3 × 1015 cm−2, while the excitation temperature was between 50 and 350 K. To avoid overestimating the column density, we also included five undetected lines presenting small uncertainties in the χ2 analysis (see Table B.2). The best-fit model was obtained for a column density N of 2.2 × 1015 cm−2 and an excitation temperature Tex of 350 K ( ). However, the excitation temperature was not well constrained. Our χ2 analysis shows that various models with excitation temperatures in the 75–350 K range can properly reproduce the lines included in the calculation (3σ uncertainty). It is due to the Eup values of the detected lines that only span a small range (see Tables 1 and B.2). Indeed, transitions with higher Eup values are present in the PILS range but they all show large uncertainties and are consequently excluded from the analysis. Previous molecules identified in the PILS survey were classified in two categories according to their excitation temperatures. For some molecules, the excitation temperature is found to be ∼125 K while for others, it is ∼300 K (see Jørgensen et al. 2018 for more details). If we assume excitation temperatures of 125 and 300 K, we obtain column densities of 3-hydroxypropenal of 1.0 × 1015 cm−2 (
 ) and 1.8 × 1015 cm−2 (
 ), respectively. In the second hypothesis (≥300 K), tens of additional lines should be detected. Given their large uncertainties, it is usually easy to find lines within the uncertainties that could be reproduced by the models with high Tex. However, there are a few exceptions for the transitions at 343.4656, 349.9189, and 350.0168 GHz that do not show lines within their uncertainties, which suggests that the excitation temperature could be lower than 300 K. Additional spectroscopic measurements would be needed to definitely answer this question. The model predictions obtained for Tex = 125 K are overlaid on the spectra of the detected lines in Fig. 2 and the undetected ones in Fig. B.1. Seven lines are correctly reproduced by the model and can be identified as HOCHCHCHO. The lines at 333.1546, 341.8653, 356.3017, and 362.2382 GHz are only partially reproduced, which could mean that they are partially blended with unknown species. We carefully checked that no HOCHCHCHO line is missing with this model in other parts of the PILS survey. In Band 6, two faint lines are detected at 247.5312 and 250.4599 GHz and are in agreement with the model. Another feature is present at 239.4605 GHz but blended with an unidentified species (see Fig. B.2). No line is found in Band 3.
The moment 0 maps of the transitions at 329.1843, 330.8262, and 335.3758 GHz are presented in Fig. B.4. The emission is compact and similar to the other COMs detected in this source (see e.g., Lykke et al. 2017; Jørgensen et al. 2018; Calcutt et al. 2018).
The isomers of 3-hydroxypropenal were also searched for in the PILS data. HCOCH2CHO (propanedial), CH3COCHO (methylglyoxal), and CH2COHCHO (2-hydroxypropenal) are not in the spectroscopic databases CDMS and JPL (Pickett et al. 1998). Only C2H3OCHO (vinyl formate) and the s-cis and s-trans conformers of C2H3COOH (propenoic acid) are available in CDMS. C2H3OCHO is not detected with an upper limit of 4 × 1015 cm−2 based on the undetected transition at 355.2462 GHz. Upper limits of 1 × 1015 cm−2 and 4 × 1015 cm−2 are also derived for the s-cis and s-trans conformers of C2H3COOH, respectively.
If 3-hydroxypropenal forms on grains, its hydrogenation could potentially lead to the saturated version, 1,3-propanediol (CH2OHCH2CH2OH). Indeed, many saturated COMs have been detected towards IRAS16293. The lower energy conformer a’GG’g present in the CDMS database was searched for and an upper limit of 1 × 1015 cm−2 was derived.
4. Chemical modeling and discussion
To better understand the chemistry of HOCHCHCHO and its isomers, we used the Nautilus code (Ruaud et al. 2016), a three-phase gas, grain surface, and grain mantle time-dependent chemical model. We updated the chemical network described in Manigand et al. (2021) by including the reactions producing and consuming the C3H4O2 isomers as well as some radical species linked to C3H4O2 and not yet present in the network, for example CH2CHO, CH2COH, or HCCHOH (see Appendix C). For the physical model of the formation of a low-mass protostar, we considered two successive stages, similarly to Manigand et al. (2021): (i) a uniform and constant stage, corresponding to the pre-stellar phase, with a density of 5 × 104 cm−3, a temperature of 10 K for both gas and dust, a visual extinction of 4.5 mag, a cosmic-ray ionization rate of 1.3 × 10⁻¹⁷ s−1, a standard external UV field of 1 G0, the initial abundances listed in Table 3 of Manigand et al. (2021), and a duration of 106 years; and (ii) the collapse phase described in Manigand et al. (2021).
Six C3H4O2 isomers are introduced in the network: 3-hydroxypropenal (HOCHCHCHO), 2-propenoic acid (C2H3COOH), methyl glyoxal (CH3COCHO), propanedial (HCOCH2CHO), 2-hydroxypropenal (CH2COHCHO), and vinyl formate (C2H3OCHO). The description of their formation and destruction pathways is presented in Appendix C. HOCHCHCHO is mainly formed through an indirect way through the reaction CH2CHO + HCO → HCOCH2CHO followed by the tautomerization of HCOCH2CHO into HOCHCHCHO. The predicted abundances with respect to CH3OH are indicated in Table 2. Among the different isomers of C3H4O2, three are relatively abundant according to the model. HOCHCHCHO has a predicted abundance with respect to CH3OH of 4.6 × 10⁻⁴ in agreement with the observations (1 × 10⁻⁴) (see below for the discussions on uncertainties). In addition, CH3COCHO and CH2COHCHO also show high abundances (with respect to CH3OH) of 2 × 10⁻³ and 6 × 10⁻⁴, respectively. Future detections could be possible for these two species if the spectroscopic data are available. It should be noted that the calculated structure of propanedial (HCOCH2CHO) is non-planar. Its dipole moment is very uncertain because it depends strongly on the dihedral angle between the two -CHO groups2. Consequently, HCOCH2CHO which is predicted to have a relatively high abundance (with respect to CH3OH) of 1 × 10⁻⁴ may be also detectable. Figure 3 shows the evolution of the most abundant isomers and their precursors during the collapse phase.
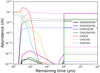 |
Fig. 3. Evolution of the abundances of the C3H4O2 isomers, HOCHCHCHO, HCOCH2CHO, CH3COCHO, and CH2COHCHO, and their precursors, CH3CO, CH2CHO, and CH2COH, during the collapse phase. Solid and dotted lines are used to indicate the gas phase and grain mantle + surface abundances of the C3H4O2 isomers, respectively. Dashed lines are used to represent the grain mantle + surface abundances of the precursors. |
Predicted and observed abundances of the C3H4O2 isomers.
The formation pathways of CH3COCHO, particularly the grain surface reaction CH3CO + HCO, are credible and the calculated abundance of CH3COCHO makes it a potentially detectable species. For CH2COHCHO, it is more ambiguous because one of the main pathways of formation is the isomerization of CH3COCHO, which could be very less favorable on grains that the result given by the methodology used here. The abundances of C3H4O2 isomers are linearly dependent on the branching ratios of the association reactions, which are not known but whose uncertainty can be estimated at about a factor of 2 in this case. The abundances are also highly sensitive to the reactions with hydrogen atoms, which are the most efficient destruction reactions in our model. The barriers were calculated using the DFT method associated with the M06-2X functional. As these reactions take place through tunneling, they are dependent on the barrier time and the barrier width estimated by calculating the imaginary frequency. The uncertainty on the rate of these reactions is therefore not negligible and the uncertainty induced on the C3H4O2 abundances can be estimated to be about a factor of 5. Thus, the total uncertainty on the predicted abundances of the C3H4O2 isomers is about a factor of 10.
In conclusion, this study confirms that solar-type protostars can harbor a broad variety of complex organic molecules in their warm inner regions, highlighting the importance of additional spectroscopic studies of three-carbon species in the submillimeter range.
CASSIS has been developed by IRAP-UPS/CNRS (Vastel et al. 2015). http://cassis.irap.omp.eu/
Acknowledgments
This paper makes use of the ALMA data ADS/JAO.ALMA#2013.1.00278.S and ADS/JAO.ALMA#2012.1.00712.S. ALMA is a partnership of ESO (representing its member states), NSF (USA) and NINS (Japan), together with NRC (Canada) and NSC and ASIAA (Taiwan), in cooperation with the Republic of Chile. The Joint ALMA Observatory is operated by ESO, AUI/NRAO, and NAOJ. This project has received funding from the European Research Council (ERC) under the European Union’s Horizon 2020 research and innovation programme (grant agreement 949278, Chemtrip). V.W. acknowledges the CNRS program “Physique et Chimie du Milieu Interstellaire” (PCMI) co-funded by the Centre National d’Etudes Spatiales (CNES). J.K.J. acknowledges support from the Independent Research Fund Denmark (grant No. DFF0135-00123B).
References
- Anastasi, C., & Maw, P. R. 1982, J. Chem. Soc., 78, 2423 [Google Scholar]
- Baba, T., Tanaka, T., Morino, I., Yamada, K. M. T., & Tanaka, K. 1999, J. Chem. Phys., 110, 4131 [NASA ADS] [CrossRef] [Google Scholar]
- Baughcum, S. L. 1983, Ph.D. Thesis, Harvard University, Cambridge MA, USA [Google Scholar]
- Baughcum, S., Duerst, R., Rowe, W., Smith, Z., & Wilson, E. 1981, J. Am. Chem. Soc., 103, 6296 [CrossRef] [Google Scholar]
- Baulch, D. L., Bowman, C. T., Cobos, C. J., et al. 2005, J. Phys. Chem. Ref. Data, 34, 757 [Google Scholar]
- Boulanger, A., Caux, E., & Dupin de Saint-Cyr, F. 2022, Astronomical Data Analysis Software and Systems XXXI, submitted [Google Scholar]
- Calcutt, H., Fiechter, M. R., Willis, E. R., et al. 2018, A&A, 617, A95 [NASA ADS] [CrossRef] [EDP Sciences] [Google Scholar]
- Caux, E., Kahane, C., Castets, A., et al. 2011, A&A, 532, A23 [NASA ADS] [CrossRef] [EDP Sciences] [Google Scholar]
- Ceccarelli, C., Bacmann, A., Boogert, A., et al. 2010, A&A, 521, L22 [NASA ADS] [CrossRef] [EDP Sciences] [Google Scholar]
- Coutens, A., Jørgensen, J. K., van der Wiel, M. H. D., et al. 2016, A&A, 590, L6 [NASA ADS] [CrossRef] [EDP Sciences] [Google Scholar]
- Coutens, A., Willis, E. R., Garrod, R. T., et al. 2018, A&A, 612, A107 [NASA ADS] [CrossRef] [EDP Sciences] [Google Scholar]
- Coutens, A., Ligterink, N. F. W., Loison, J. C., et al. 2019, A&A, 623, L13 [NASA ADS] [CrossRef] [EDP Sciences] [Google Scholar]
- Del Rio, D., Stewart, A. J., & Pellegrini, N. 2005, Nutr Metab Cardiovasc Dis., 15, 316 [CrossRef] [Google Scholar]
- Ding, Y.-H., Zhang, X., Li, Z.-S., Huang, X.-R., & Sun, C.-C. 2001, J. Phys. Chem. A, 105, 8206 [NASA ADS] [CrossRef] [Google Scholar]
- Fayolle, E. C., Öberg, K. I., Jørgensen, J. K., et al. 2017, Nat. Astron., 1, 703 [NASA ADS] [CrossRef] [Google Scholar]
- Firth, D., Beyer, K., Dvorak, M., et al. 1991, J. Chem. Phys., 94, 1812 [NASA ADS] [CrossRef] [Google Scholar]
- Garrod, R. T. 2013, ApJ, 765, 60 [Google Scholar]
- Garrod, R. T., Belloche, A., Müller, H. S. P., & Menten, K. M. 2017, A&A, 601, A48 [NASA ADS] [CrossRef] [EDP Sciences] [Google Scholar]
- Guthrie, J. P. 1978, Can. J. Chem., 56, 962 [NASA ADS] [CrossRef] [Google Scholar]
- Harada, N., Herbst, E., & Wakelam, V. 2010, ApJ, 721, 1570 [NASA ADS] [CrossRef] [Google Scholar]
- Herbst, E., Terzieva, R., & Talbi, D. 2000, MNRAS, 311, 869 [NASA ADS] [CrossRef] [Google Scholar]
- Hippler, H., & Viskolcz, B. L. 2002, Phys. Chem. Chem. Phys. (Incorporating Faraday Trans.), 4, 4663 [NASA ADS] [CrossRef] [Google Scholar]
- Jørgensen, J. K., van der Wiel, M. H. D., Coutens, A., et al. 2016, A&A, 595, A117 [Google Scholar]
- Jørgensen, J. K., Müller, H. S. P., Calcutt, H., et al. 2018, A&A, 620, A170 [Google Scholar]
- Jung, S.-H., Jang, S.-C., Kim, J.-W., Kim, J.-W., & Choi, J.-H. 2015, J. Phys. Chem. A, 119, 11761 [NASA ADS] [CrossRef] [Google Scholar]
- Ligterink, N. F. W., Coutens, A., Kofman, V., et al. 2017, MNRAS, 469, 2219 [Google Scholar]
- Lykke, J. M., Coutens, A., Jørgensen, J. K., et al. 2017, A&A, 597, A53 [NASA ADS] [CrossRef] [EDP Sciences] [Google Scholar]
- Manigand, S., Jørgensen, J. K., Calcutt, H., et al. 2020, A&A, 635, A48 [NASA ADS] [CrossRef] [EDP Sciences] [Google Scholar]
- Manigand, S., Coutens, A., Loison, J. C., et al. 2021, A&A, 645, A53 [NASA ADS] [CrossRef] [EDP Sciences] [Google Scholar]
- McGuire, B. A. 2022, ApJS, 259, 30 [NASA ADS] [CrossRef] [Google Scholar]
- Michael, J. V., Nava, D. F., Payne, W. A., & Stief, L. J. 1979, J. Chem. Phys., 70, 5222 [NASA ADS] [CrossRef] [Google Scholar]
- Minissale, M., Dulieu, F., Cazaux, S., & Hocuk, S. 2016, A&A, 585, A24 [NASA ADS] [CrossRef] [EDP Sciences] [Google Scholar]
- Moulds, L. d. V., & Riley, H. L. 1938, J. Chem. Soc., 1938, 621 [CrossRef] [Google Scholar]
- Müller, H. S. P., Thorwirth, S., Roth, D. A., & Winnewisser, G. 2001, A&A, 370, L49 [Google Scholar]
- Müller, H. S. P., Schlöder, F., Stutzki, J., & Winnewisser, G. 2005, J. Mol. Struct., 742, 215 [Google Scholar]
- Pickett, H. M., Poynter, R. L., Cohen, E. A., et al. 1998, J. Quant. Spectr. Rad. Transf., 60, 883 [Google Scholar]
- Pryor, W. A., & Stanley, J. P. 1975, J. Org. Chem., 40, 3615 [CrossRef] [Google Scholar]
- Richard, C., Jørgensen, J. K., Margulès, L., et al. 2021, A&A, 651, A120 [NASA ADS] [CrossRef] [EDP Sciences] [Google Scholar]
- Ruaud, M., Wakelam, V., & Hersant, F. 2016, MNRAS, 459, 3756 [Google Scholar]
- Senosiain, J. P., Klippenstein, S. J., & Miller, J. A. 2006, J. Phys. Chem. A, 110, 5772 [NASA ADS] [CrossRef] [Google Scholar]
- Stolze, M., Hübner, D., & Sutter, D. 1983, J. Mol. Struct., 97, 243 [NASA ADS] [CrossRef] [Google Scholar]
- Turner, P., Baughcum, S., Coy, S., & Smith, Z. 1984, J. Am. Chem. Soc., 106, 2265 [CrossRef] [Google Scholar]
- Turner, A. M., Bergantini, A., Koutsogiannis, A. S., et al. 2021, ApJ, 916, 74 [NASA ADS] [CrossRef] [Google Scholar]
- Vastel, C., Bottinelli, S., Caux, E., Glorian, J. M., & Boiziot, M. 2015, SF2A-2015: Proceedings of the Annual meeting of the French Society of Astronomy and Astrophysics, 313 [Google Scholar]
- Wakelam, V., Loison, J. C., Mereau, R., & Ruaud, M. 2017, Mol. Astrophys., 6, 22 [NASA ADS] [CrossRef] [Google Scholar]
- Whytock, D. A., Michael, J. V., Payne, W. A., & Stief, L. J. 1976, J. Chem. Phys., 65, 4871 [NASA ADS] [CrossRef] [Google Scholar]
- Zeng, S., Quénard, D., Jiménez-Serra, I., et al. 2019, MNRAS, 484, L43 [Google Scholar]
- Zhou, Y., Quan, D.-H., Zhang, X., & Qin, S.-L. 2020, Res. Astron. Astrophys., 20, 125 [CrossRef] [Google Scholar]
Appendix A: Spectroscopy of 3-hydroxypropenal
The spectroscopy of 3-hydroxypropenal is based on the measurements reported in Baughcum (1983), Stolze et al. (1983), Turner et al. (1984), Firth et al. (1991), and Baba et al. (1999). The b-dipole moment component comes from Baughcum et al. (1981) while the a-dipole moment was determined by Baba et al. (1999). The strong b-type transitions occur within the tunneling states (rotational transitions), whereas the weak a-type transitions connect the two tunneling states (rotation-tunneling transitions). The extensive set of experimental rotational transitions cover a large range of J quantum numbers; however, transitions with the lowest Ka were only accessed for low values of J as these are somewhat weaker than higher-Ka transitions in the same range. In addition, the small amount of rotation-tunneling transitions have also high values of Ka. Therefore, transitions having high values of J and very low values of Ka have large uncertainties which prohibit their unambiguous identification in the ALMA/PILS data sets currently, even though their intensities should be sufficiently above the noise limit in at least some cases.
Appendix B: Additional tables and figures
Table B.1 lists the observational parameters of the detected HOCHCHCHO lines obtained after Gaussian fitting. The undetected transitions of HOCHCHCHO used in the calculations presented in Section 3 (see Table B.2) are shown in Fig. B.1. The additional lines detected in Band 6 (see Table B.3) are shown in Fig. B.2. The other transitions of HOCHCHCHO that are either blended or affected by absorption features (see Table B.4) are shown in Fig. B.3. The model that includes the previously detected molecules (in green) is known to overproduce the intensities of optically thick lines. The spectroscopy can also be uncertain in some cases. Maps of three HOCHCHCHO transitions are shown in Fig. B.4.
 |
Fig. B.1. Observations of the undetected HOCHCHCHO transitions used in the χ2 analysis (black). The model with N = 1.0 × 1015 cm−2 and Tex = 125 K is overlaid in red. The green line corresponds to the model including the previous molecules identified in the PILS survey. |
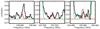 |
Fig. B.2. Lines of HOCHCHCHO identified in Band 6 (black). The model with N = 1.0 × 1015 cm−2 and Tex = 125 K is overlaid in red. The green line corresponds to the model including the previous molecules identified in the PILS survey. |
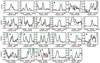 |
Fig. B.3. Observations of the other HOCHCHCHO transitions that are blended and/or affected by absorption features (black). The Letter A is added on the panel where significant absorption features are seen at the half-beam offset position. The model with N = 1.0 × 1015 cm−2 and Tex = 125 K is overlaid in red. The green line corresponds to the model including the previous molecules identified in the PILS survey. |
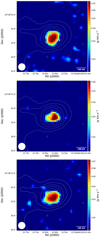 |
Fig. B.4. Integrated intensity maps of the HOCHCHCHO lines at 329.1843 (top), 330.8262 (middle), and 335.3758 GHz (bottom) towards IRAS16293 B. Dust continuum contours are indicated with white contours (levels of 0.02, 0.05, 0.1, 0.2, and 0.5 Jy beam−1). The position of the continuum peak is indicated with a gray square, while the position analyzed for IRAS16293 B (full-beam offset) is indicated with a gray circle. The beam size is indicated in white in the bottom left corner. |
Observed line parameters of the HOCHCHCHO transitions identified towards IRAS 16293 B.
List of the undetected transitions of HOCHCHCHO used in the χ2 analysis.
List of the transitions identified as HOCHCHCHO in Band 6.
List of the HOCHCHCHO transitions excluded from the analysis due to blending with other species or absorption features.
Appendix C: Chemical modeling of 3-hydroxypropenal (HOCHCHCHO) and its isomers
HOCHCHCHO has a large number of isomers such as 2-propenoic acid (C2H3COOH), methyl glyoxal (CH3COCHO), propanedial (HCOCH2CHO), 2-hydroxypropenal (CH2COHCHO), allenediol (HOCHCCHOH), vinyl formate (C2H3OCHO) and even cyclic compounds: β-propiolactone and oxiranecarboxaldehyde, with C2H3COOH the most stable isomer.
Complex molecules, such as the ones with a C3 skeleton, are mainly produced through either: i) grain reactions of unsaturated molecules (C3, C3H, C3H2, C3O, H2C3O, ...) initially produced in the gas phase then stuck on grains or ii) associations between radicals on grains (e.g., Harada et al. 2010; Garrod 2013; Garrod et al. 2017; Manigand et al. 2021). In the first case, the unsaturated molecules have to react on grains with O or OH to form molecules such as HOCHCHCHO and its isomers. As OH is not very mobile on grains and easily reacts with H2, only atomic oxygen through reactions with the C3HxO species can produce the isomers of C3H4O2. However, O mainly reacts with the abundant radicals on the grains (HCO, CH2OH, and CH3O) and the production of C3H4O2 isomers from the reactions of O is limited. In fact, only the isomer C2H3COOH is produced by this type of reaction in our network, with a rather low production.
In contrast to the O + C3HxO reactions, the reactions with HCO are much more efficient because HCO is abundant and relatively mobile on the grains (Wakelam et al. 2017; Minissale et al. 2016). So, the reactions HCO + C2Hx = 1, 3O are efficient to produce (directly of after hydrogenation) the isomers of C3H4O2 if the C2Hx = 1, 3O radicals are abundant. The C2Hx = 1O (HCCO) is not very abundant on grains, according to our network, and thus it cannot be an important source of C3H4O2. However, C2H3O radicals are quite abundant on grains, thereby leading to the formation of C3H4O2.
Among the various C2H3O radicals, CH3CO is the most abundant one. It is produced through addition of H on H2CCO, but also through H atom abstraction of CH3CHO and through the CH3 + CO reaction on grains. Besides CH3CO, there are three other C2H3O radicals: CH2CHO, CH2COH, and HCCHOH; CH2CHO is produced through the reaction H2CCO + H and through H atom abstraction of CH3CHO. Furthermore, CH2COH forms through addition of H on H2CCO and H atom abstraction of C2H3OH, and HCCHOH is produced by a H atom abstraction of C2H3OH.
The isomers of HOCHCHCHO are then formed according to the following reactions: CH3COCHO (methyl glyoxal) is produced via the reaction HCO + CH3CO. HCOCH2CHO (propanedial) is formed with the reaction between HCO and CH2CHO which also produces (to a minor extent) C2H3OCHO (vinyl formate) because the single electron of CH2CHO is partly delocalized on oxygen (H2C•−CH=O ↔ H2C=CH−O•); CH2COHCHO (2-hydroxypropenal) results from the reactions between HCO and CH2COH. The newly detected species, HOCHCHCHO (3-hydroxypropenal), can be produced by the reaction HCO + CHCHOH, but the abundance of CHCHOH is low.
One important point is that methyl glyoxal/2-hydroxypropenal and 3-hydroxypropenal/propanedial are tautomeric couples. They are interconvertible by chemical reaction, in this case via a transfer of hydrogen atom (keto-enolic equilibrium). The reactions producing the C3H4O2 isomers are exothermic. For example HCO + CH2CHO → HCOCH2CHO is exothermic by 306 kJ/mol. In this case, HCOCH2CHO is produced above the barrier to isomerization to HOCHCHCHO, located 72 kJ/mol below the HCO + CH2CHO entrance energy. The HCOCH2CHO with 306 kJ/mol of internal energy will relax through interaction with the ice. The typical timescale for isomeric conversion between HCOCH2CHO and HOCHCHCHO is shorter than for relaxation. Thus, as relaxation occurs, isomeric conversion leads to equilibrated isomeric abundances at each internal energy. The final balance is determined at or near the effective barrier to isomerization, which corresponds to the energy of the transition state (Herbst et al. 2000), favoring HOCHCHCHO in that case. In our network, we consider that the ratio between the isomeric forms is then approximated by the ratio of the rovibrational densities of states of the isomers at the barrier to isomerization. For some reactions, the C3H4O2 isomers are produced above dissociation limit and then some dissociate. The branching ratios towards dissociation are roughly estimated according to the excess energy above the dissociation limit and play a relatively small role in C3H4O2 chemistry.
By considering the different reactions producing C3H4O2, we introduced six of the isomers in our network: 3-hydroxypropenal (HOCHCHCHO), 2-propenoic acid (C2H3COOH), methyl glyoxal (CH3COCHO), propanedial (HCOCH2CHO), 2-hydroxypropenal (CH2COHCHO), and vinyl formate (C2H3OCHO). These species are presented in Figure C.1 with their respective formation energies and the transition states between the tautomeric forms. The considered reactions can be found in Table C.1.
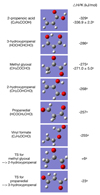 |
Fig. C.1. Representation of the isomers of HOCHCHCHO included in the chemical modeling with their formation energies and the transition states (TS) between the tautomeric forms. The values with a are obtained through M06-2X/AVTZ calculations using C2H4 + CO2 as a reference, while the ones with b and c refer to Guthrie (1978) and Moulds & Riley (1938), respectively. |
Reactions involved in the formation of the C3H4O2 isomers.
All Tables
Observed line parameters of the HOCHCHCHO transitions identified towards IRAS 16293 B.
List of the HOCHCHCHO transitions excluded from the analysis due to blending with other species or absorption features.
All Figures
|
Fig. 1. Chemical representation of the tautomers of malonaldehyde. The enol form, 3-hydroxypropenal, is on the left, while the dialdehyde form, propanedial, is on the right. |
| In the text | |
|
Fig. 2. Lines identified as HOCHCHCHO towards IRAS16293 B. The observations are in black. The model with N = 1.0 × 1015 cm−2 and Tex = 125 K is overlaid in red. The green line corresponds to the model which includes the previous molecules identified in the PILS survey. The lines at 333.1545, 341.8653, 356.3017, and 362.2382 GHz could be partially blended with unknown species. |
| In the text | |
|
Fig. 3. Evolution of the abundances of the C3H4O2 isomers, HOCHCHCHO, HCOCH2CHO, CH3COCHO, and CH2COHCHO, and their precursors, CH3CO, CH2CHO, and CH2COH, during the collapse phase. Solid and dotted lines are used to indicate the gas phase and grain mantle + surface abundances of the C3H4O2 isomers, respectively. Dashed lines are used to represent the grain mantle + surface abundances of the precursors. |
| In the text | |
|
Fig. B.1. Observations of the undetected HOCHCHCHO transitions used in the χ2 analysis (black). The model with N = 1.0 × 1015 cm−2 and Tex = 125 K is overlaid in red. The green line corresponds to the model including the previous molecules identified in the PILS survey. |
| In the text | |
|
Fig. B.2. Lines of HOCHCHCHO identified in Band 6 (black). The model with N = 1.0 × 1015 cm−2 and Tex = 125 K is overlaid in red. The green line corresponds to the model including the previous molecules identified in the PILS survey. |
| In the text | |
|
Fig. B.3. Observations of the other HOCHCHCHO transitions that are blended and/or affected by absorption features (black). The Letter A is added on the panel where significant absorption features are seen at the half-beam offset position. The model with N = 1.0 × 1015 cm−2 and Tex = 125 K is overlaid in red. The green line corresponds to the model including the previous molecules identified in the PILS survey. |
| In the text | |
|
Fig. B.4. Integrated intensity maps of the HOCHCHCHO lines at 329.1843 (top), 330.8262 (middle), and 335.3758 GHz (bottom) towards IRAS16293 B. Dust continuum contours are indicated with white contours (levels of 0.02, 0.05, 0.1, 0.2, and 0.5 Jy beam−1). The position of the continuum peak is indicated with a gray square, while the position analyzed for IRAS16293 B (full-beam offset) is indicated with a gray circle. The beam size is indicated in white in the bottom left corner. |
| In the text | |
|
Fig. C.1. Representation of the isomers of HOCHCHCHO included in the chemical modeling with their formation energies and the transition states (TS) between the tautomeric forms. The values with a are obtained through M06-2X/AVTZ calculations using C2H4 + CO2 as a reference, while the ones with b and c refer to Guthrie (1978) and Moulds & Riley (1938), respectively. |
| In the text | |
Current usage metrics show cumulative count of Article Views (full-text article views including HTML views, PDF and ePub downloads, according to the available data) and Abstracts Views on Vision4Press platform.
Data correspond to usage on the plateform after 2015. The current usage metrics is available 48-96 hours after online publication and is updated daily on week days.
Initial download of the metrics may take a while.