Fig. B.4.
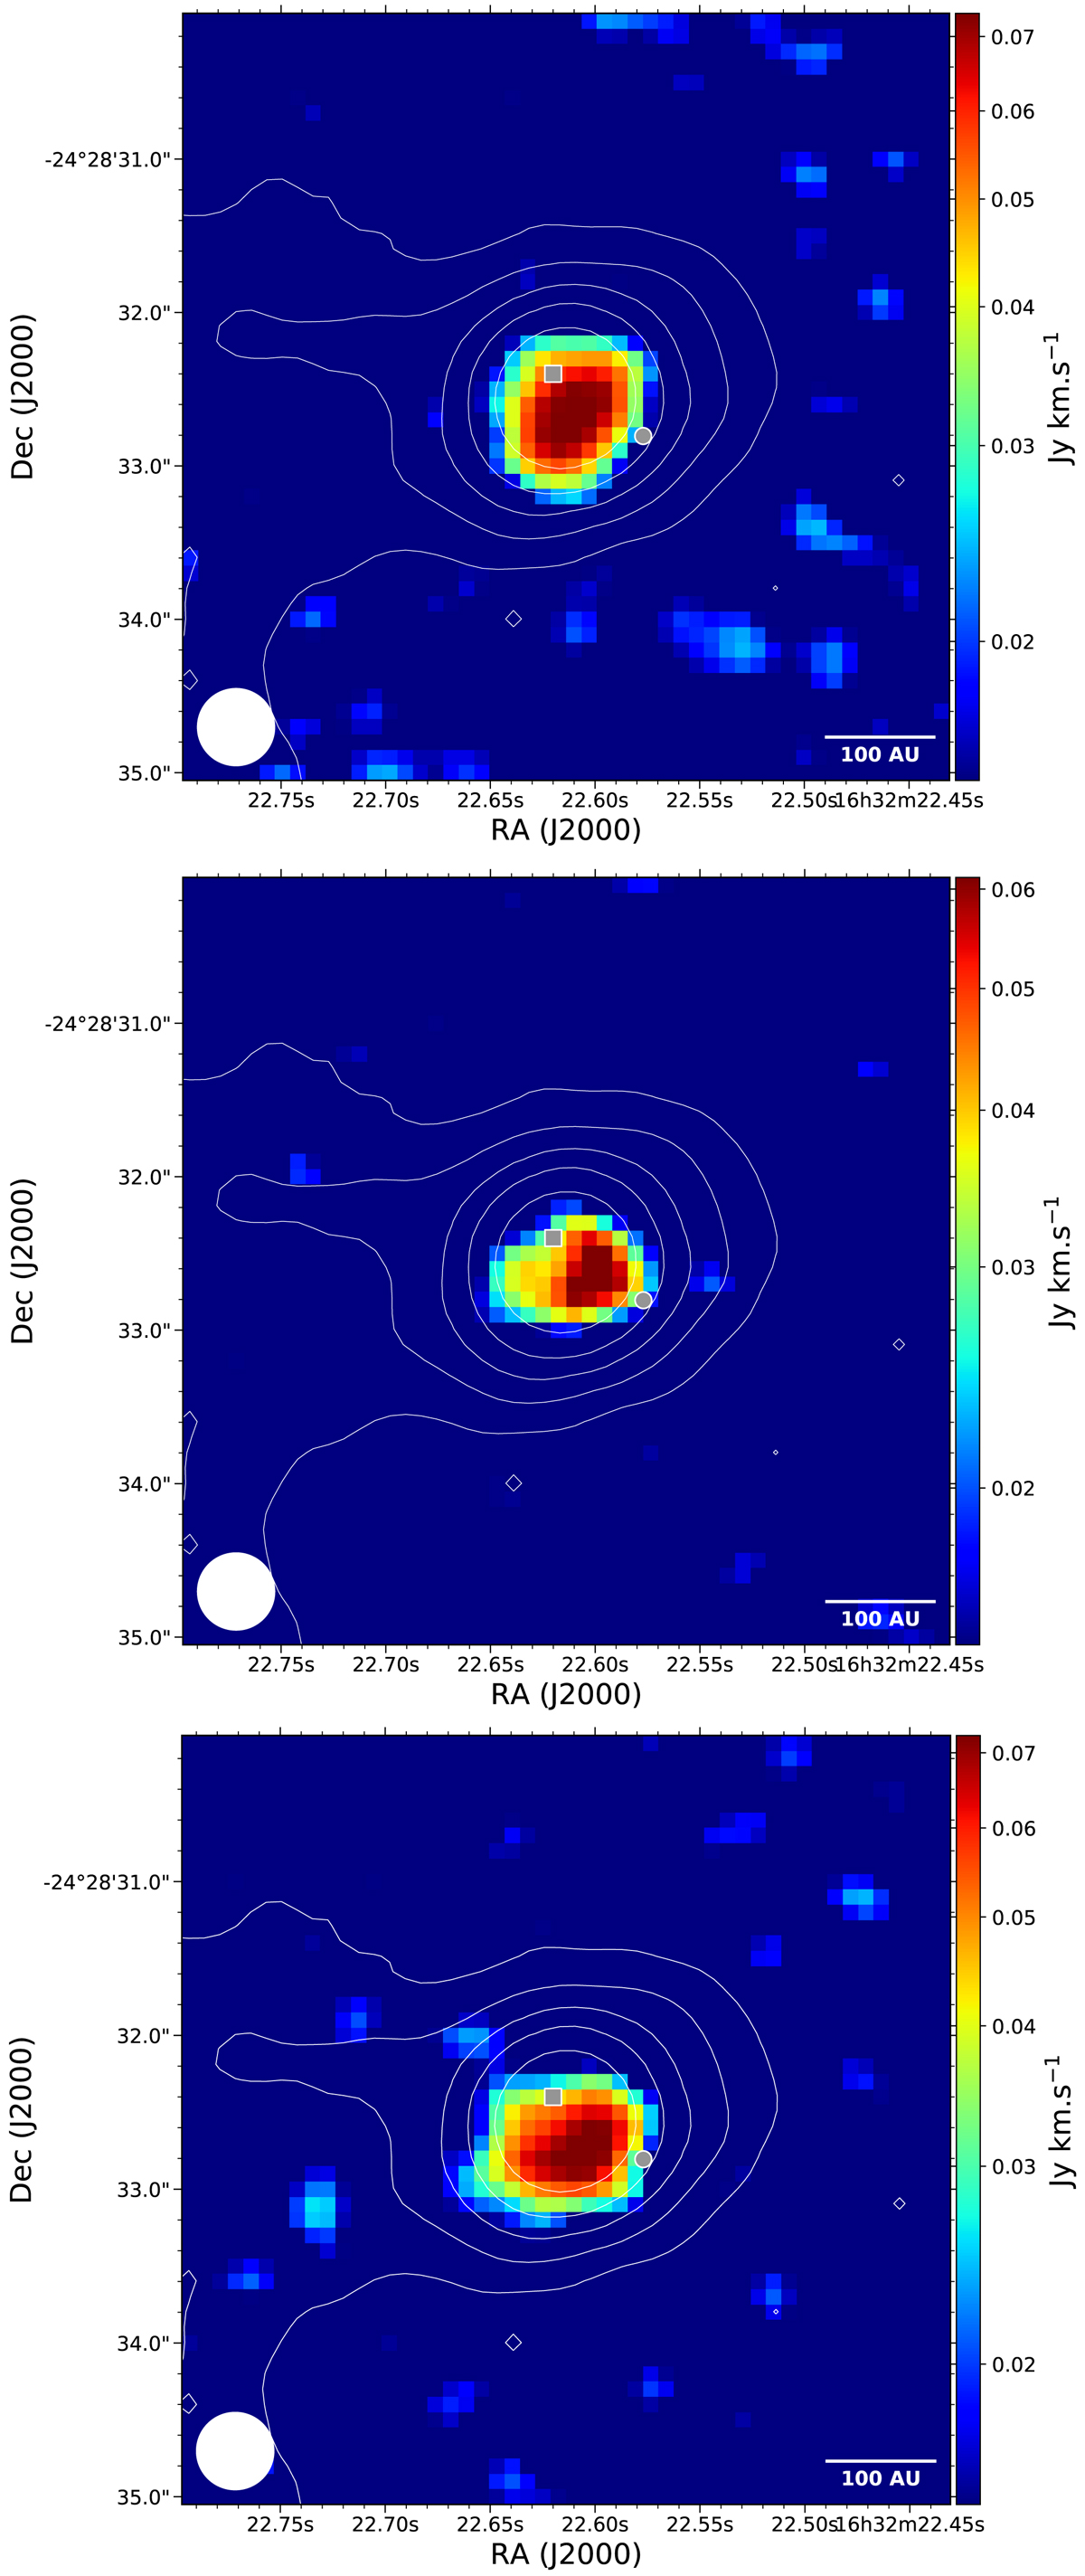
Download original image
Integrated intensity maps of the HOCHCHCHO lines at 329.1843 (top), 330.8262 (middle), and 335.3758 GHz (bottom) towards IRAS16293 B. Dust continuum contours are indicated with white contours (levels of 0.02, 0.05, 0.1, 0.2, and 0.5 Jy beam−1). The position of the continuum peak is indicated with a gray square, while the position analyzed for IRAS16293 B (full-beam offset) is indicated with a gray circle. The beam size is indicated in white in the bottom left corner.
Current usage metrics show cumulative count of Article Views (full-text article views including HTML views, PDF and ePub downloads, according to the available data) and Abstracts Views on Vision4Press platform.
Data correspond to usage on the plateform after 2015. The current usage metrics is available 48-96 hours after online publication and is updated daily on week days.
Initial download of the metrics may take a while.