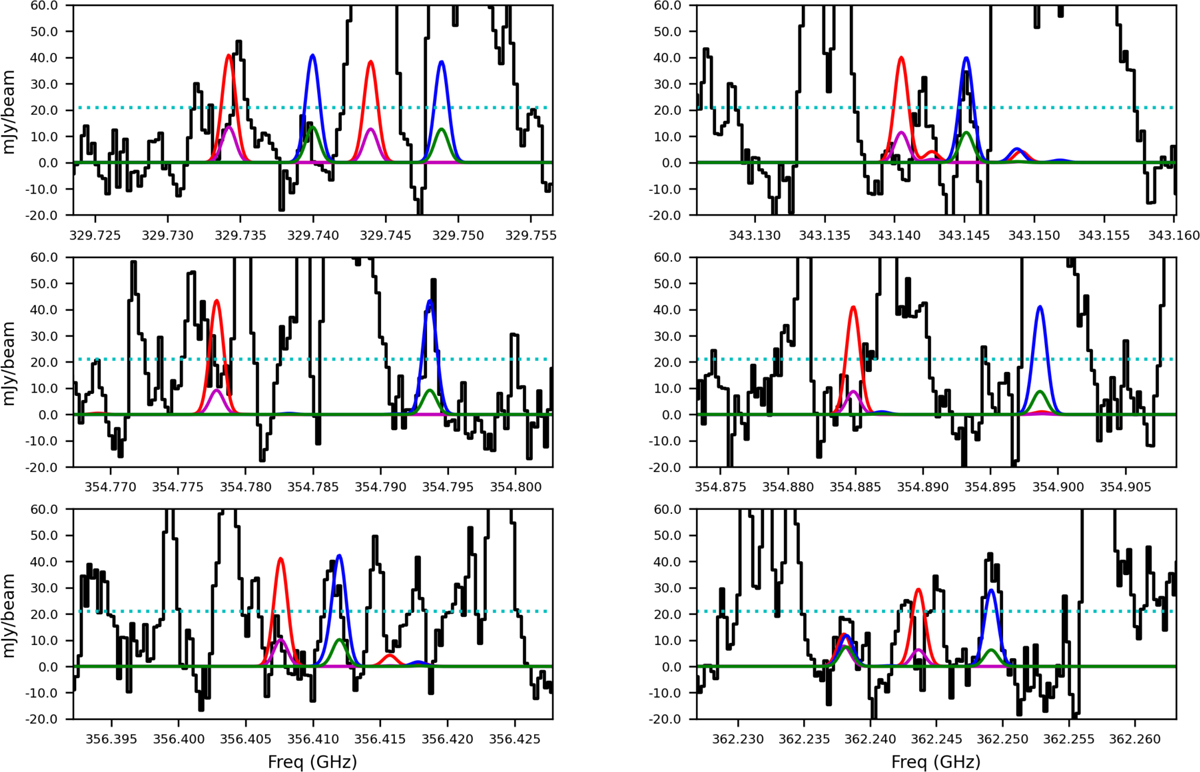
Fig. 8
Download original image
Examples of high excitation transitions of 3-hydroxypropenal that have been significantly shifted with the new spectroscopic study. Models obtained with previous spectroscopy are indicated in blue (Tex = 300 K) and green (Tex = 125 K). The new models are in red (Tex = 300 K) and magenta (Tex = 125 K). The column densities are N = 1.0 × 1015 cm−2 for Tex = 125 K and N = 1.8 × 1015 cm−2 for Tex = 300 K. An absorption due to a nearby bright line is present around 343.14 GHz. The cyan dotted line represents the 3 rms level per 0.33 km s−1 (1/3 of the line width).
Current usage metrics show cumulative count of Article Views (full-text article views including HTML views, PDF and ePub downloads, according to the available data) and Abstracts Views on Vision4Press platform.
Data correspond to usage on the plateform after 2015. The current usage metrics is available 48-96 hours after online publication and is updated daily on week days.
Initial download of the metrics may take a while.