| Issue |
A&A
Volume 687, July 2024
|
|
|---|---|---|
| Article Number | A118 | |
| Number of page(s) | 10 | |
| Section | Stellar structure and evolution | |
| DOI | https://doi.org/10.1051/0004-6361/202349047 | |
| Published online | 12 July 2024 | |
The VELOCE modulation zoo
I. Spectroscopic detection of non-radial modes in the first-overtone Cepheids BG Crucis, QZ Normae, V0391 Normae, and V0411 Lacertae⋆
Institute of Physics, École Polytechnique Fédérale de Lausanne (EPFL), Observatoire de Sauverny, 1290 Versoix, Switzerland
e-mail: This email address is being protected from spambots. You need JavaScript enabled to view it.
Received:
20
December
2023
Accepted:
20
March
2024
Abstract
Context. The photometric observations from the recent decade revolutionized our view on classical pulsators. Low-amplitude signals have been detected photometrically in addition to the dominant high-amplitude radial mode pulsations in many RR Lyrae stars and classical Cepheids. First-overtone pulsators with an additional low-amplitude signal at a period ratio of around 0.61 with the main mode, the so-called 0.61 stars, form the most populous group among these stars. The nature of this signal has been attributed to non-radial pulsations. Another mysterious group are stars in which the additional signal forms a period ratio of around 0.68. These are the 0.68 stars. The origin of the signal remains unknown.
Aims. Here, we search for similar phenomena in spectroscopic observations of first-overtone classical Cepheids collected as part of the VELOCE project.
Methods. We performed a frequency analysis of several parameters derived from cross-correlation functions (CCFs), including radial velocity, the full width at half maximum, the bisector inverse span, and the CCF depth (contrast). Using standard pre-whitening, we searched for additional low-amplitude signals. We identified the location of these stars in various sequences of the Petersen diagram.
Results. We detect additional signals in four first-overtone classical Cepheids: BG Cru, QZ Nor, V0391 Nor, and V0411 Lac. We classified BG Cru, QZ Nor, and V0391 Nor as 0.61 stars based on their period ratios. V0411 Lac, however, exhibits a ratio of 0.68 between the two modes, and the additional signal has a longer period. This type of multi-periodicity remains unexplained.
Conclusions. VELOCE CCFs yield the first spectroscopic detections of non-radial pulsation modes in classical Cepheids. This opens an asteroseismic window for pursuing a more detailed understanding of these important stars. While the 0.61 signal of BG Cru, QZ Nor, and V0391 Nor is understood to originate from non-radial modes of moderate degrees, the 0.68 signal of V0411 Lac still lacks a physical explanation.
Key words: techniques: radial velocities / stars: oscillations / stars: variables: Cepheids
The full Table 2 is available at the CDS via anonymous ftp to https://cdsarc.cds.unistra.fr (130.79.128.5) or via https://cdsarc.cds.unistra.fr/viz-bin/cat/J/A+A/687/A118
© The Authors 2024
 Open Access article, published by EDP Sciences, under the terms of the Creative Commons Attribution License (https://creativecommons.org/licenses/by/4.0), which permits unrestricted use, distribution, and reproduction in any medium, provided the original work is properly cited.
This article is published in open access under the Subscribe to Open model. This email address is being protected from spambots. You need JavaScript enabled to view it. to support open access publication.
1. Introduction
Classical Cepheids are evolved intermediate-mass core-He burning pulsating stars. They mostly pulsate in radial modes with periods from several to one hundred days for the fundamental mode (F) and from around half a day to a few days for the first overtone (1O). Double- and triple-mode pulsations in radial modes are also known among Cepheids (see e.g. Soszyński et al. 2015a).
A growing number of additional pulsation phenomena in addition to pulsations in the dominant radial modes have been reported based on photometric observations in classical Cepheids in the recent decade, including additional low-amplitude signals and period changes. Precise photometric and spectroscopic observations of classical Cepheids also revealed the dominant pulsation period to be unstable on various timescales. A modulation in the amplitude and/or phase was detected in classical Cepheids that is similarly to the Blazhko effect in RR Lyrae stars (Moskalik & Kołaczkowski 2009; Molnár & Szabados 2014; Soszyński et al. 2015a; Smolec 2017; Süveges & Anderson 2018a,b; Rathour et al. 2021). Space-based photometry from TESS (Transiting Exoplanet Survey Satellite) revealed stochastic cycle-to-cycle variations (Plachy et al. 2021). A modulation of the pulsation was also shown using interferometry for ℓ Car by Anderson et al. (2016).
Low-amplitude additional signals are also commonly detected in classical Cepheids, in addition to the dominant pulsations in radial modes. Soszyński et al. (2008), Olech & Moskalik (2009), Moskalik & Kołaczkowski (2009) reported an additional signal in some first-overtone Cepheids that formed a period ratio of around 0.60–0.65 with the first-overtone period. Since the discovery, this group of so-called 0.61 stars significantly grew in members. Most of them were detected in the Magellanic Clouds (Soszyński et al. 2010, 2015b; Süveges & Anderson 2018b; Smolec et al. 2023). Some 0.61 stars were also found in the Galactic disk (Pietrukowicz et al. 2013; Rathour et al. 2021). Moreover, 0.61 signals were also found in RR Lyrae stars (e.g. Netzel 2022, and references therein) and in one anomalous Cepheid (Plachy et al. 2021). The characteristic feature of 0.61 stars is that they form three nearly parallel sequences in the Petersen diagram (the diagram of the shorter-to-longer period ratio versus longer period; see Fig. 5). In many of the 0.61 Cepheids (and RR Lyrae stars), the additional signals are accompanied by their subharmonics, which are signals at half of their frequency. Based on calculations of theoretical models for RR Lyrae stars and classical Cepheids, Dziembowski (2016) explained the additional signal as harmonics of non-radial modes. That is, the period ratio of around 0.61 is formed by P1O/(0.5Pnr), where P1O is a first-overtone period, and Pnr is a non-radial mode period. According to this explanation, the sequences in the Petersen diagram in the case of classical Cepheids are formed by harmonics of non-radial modes of degrees 7, 8, and 9 for the top, middle, and bottom sequences, respectively (see Petersen diagram in Fig. 3 in Dziembowski 2016). In the case of RR Lyrae stars, the top and bottom sequences are formed by harmonics of modes of degrees 8 and 9, respectively (see Petersen diagram in Fig. 4 in Dziembowski 2016). In other words, the sub-harmonics of the 0.61 signals are non-radial modes, according to this explanation. This scenario is currently the most promising. It is supported by the observed properties and distributions of 0.61 signals and their sub-harmonics for classical Cepheids (e.g. Smolec & Śniegowska 2016) and RR Lyrae stars (Netzel & Smolec 2019). Netzel & Smolec (2022) calculated an extensive grid of theoretical models for RR Lyrae stars with non-radial modes as proposed by Dziembowski (2016) and showed that the non-radial modes are not linearly unstable near the blue edge of the instability strip. The occurrence of the RR Lyrae stars with 0.61 signals in observed colour-magnitude diagrams agrees with theoretical models. Moreover, the theoretical modelling involving non-radial modes of the proposed degrees was carried out and tested using independent observations for RR Lyrae stars and led to promising results (Netzel et al. 2023a).
However, even though the proposed theory for the 0.61 stars is supported by observations and theoretical models, there is still no direct-mode identification to verify the theory. The detection of the same signals in spectroscopic observations would be a first step to applying spectroscopic-mode identification techniques to unambiguously uncover the nature of the signals in the 0.61 stars.
Another well-defined but puzzling multi-mode group of Cepheids are stars whose additional signal has a period longer than the first-overtone period, and the corresponding period ratio is around 0.68. The first such stars were reported by Süveges & Anderson (2018b), and more were identified by Smolec et al. (2023). Again, analogous signals are also known in RR Lyrae stars (see a review by Netzel 2022). The 0.68 signals were only recently identified in fundamental-mode RR Lyrae stars (Benkő & Kovács 2023). The nature of the additional signal in 0.68 stars remains unknown, as the considered explanations face difficulties (see discussion in Netzel et al. 2015a; Benkő & Kovács 2023; Dziembowski 2016).
Finally, the large-scale study of Süveges & Anderson (2018b) showed the ubiquity of additional signals in classical Cepheids.
Spectroscopic time series offer new ways to study the modulated signals in classical Cepheids. The analysis of the line profile variations revealed additional variability that cannot be explained by simple pulsation in radial modes in X Sgr, V1334 Cyg, EV Sct, and BG Cru (Kovtyukh et al. 2003). Non-radial modes were suggested as an explanation. Additional signals on intermediate timescales were reported in Polaris, where line bisector variations exhibit periodic variations with a period of 42 d (Hatzes & Cochran 2000), and possibly of 60 d (Anderson 2019).
A long baseline of radial velocity (RV) measurements collected as part of the project called VELOcities of CEpheids allowed us to study the modulations of pulsations in Cepheids on different timescales (Anderson et al., in prep.; henceforth VELOCE-I). Anderson (2014) reported that the timescales of the modulated signals differ between short- and long-period stars. While long-timescale variations are seen in short-period likely first-overtone Cepheids, cycle-to-cycle variations occur in very long-period fundamental-mode Cepheids. This dichotomy is also seen in the large sample of VELOCE Cepheids (VELOCE-I).
All detections of the 0.61 and 0.68 signals have been based on photometric observations so far. Netzel & Kolenberg (2021) performed a feasibility study to determine whether it would be possible to detect the non-radial modes of degrees ℓ = 7, 8, 9 in spectroscopic observations of classical Cepheids. They showed that it would be a challenging task, requiring a large number of spectra with a high signal-to-noise ratio (S/N). However, given the additional signals seen in precision RV data (see VELOCE-I) and the high S/N of cross-correlation functions (CCFs), it is likely that Cepheid spectra are equally well suited for detecting these signals.
Here, we analysed spectroscopic time-series data from the VELOCE project to search for additional periodicities in first-overtone classical Cepheids. This is the first paper of the series in which the spectroscopic time series of VELOCE are used to study the signals beyond the dominant pulsation mode and orbital motion of Cepheids, the so-called modulation zoo. The data used in this study and our analysis method are described in Sect. 2. The results are described in Sect. 3 and are discussed in Sect. 4. Section 5 contains our conclusions.
2. Method
The VELOCE project has collected high-resolution spectroscopic time-series observations with baselines exceeding a decade of an unprecedented number of Cepheids from both hemispheres. The details of the data collection for the VELOCE project can be found in VELOCE-I. We summarize the most important information for the dataset we used. Targets in the southern hemisphere were observed with the 1.2 m Swiss telescope at La Silla (Chile), which is equipped with the high-resolution (R ∼ 60 000) spectrograph Coralie (Mayor & Queloz 1995; Ségransan et al. 2010; Van Malle 2016). Targets in the northern hemisphere were observed with the 1.2 m Mercator telescope at Roque de los Muchachos (Spain) observatory, which is equipped with the high-resolution (R ∼ 85 000) echelle spectrograph Hermes (Raskin et al. 2011). The first VELOCE data release presented over 18 000 RV observations of 258 Cepheids measured using the cross-correlation technique (Baranne et al. 1996). The resulting CCFs feature extremely high S/N of around 600–1200 and can be characterized by the parameters RV, full width at half maximum (FWHM), bisector inverse span (BIS), and CCF depth (contrast) (see Anderson 2016, for details on these parameters). In particular, BIS provides a useful measure of the CCF asymmetry for a time-series analysis. Precise observations together with a long temporal baseline make VELOCE an excellent database for studying rare and hard-to-detect additional phenomena in Cepheids, such as pulsation modulations or additional low-amplitude periodicities. Observations for VELOCE are ongoing, and we used both RV measurements reported in VELOCE-I and targeted observations acquired beyond the time range included in VELOCE-I here, that is, observations acquired after 5 March 2022 (BJD = 2459644).
For Cepheids from the southern hemisphere, we report the results based on the data collected after November 2014 (Coralie14 in VELOCE-I; C14 throughout the paper) alone in order to avoid spurious signals introduced by instrument interventions. C14 observations provide better line shape stability through the optimal light-scrambling properties of the octagonal fibers. Additionally, C14 observations provide up to nine-year temporal baselines with optimal phase sampling for our purposes.
The Hermes spectrograph underwent modifications in April 2018 (see VELOCE-I). Observations of one of our targets, V0411 Lac, were carried out before 2018 as well. We separately analysed the whole dataset and the subset of data collected after modifications. The additional signal was detected in both analyses. The results here are presented based on the full dataset.
VELOCE-I reported observations for 581 first-overtone Cepheids. For our analysis, we used time series for the RV and CCF shape indicators: FWHM, BIS, and contrast. The RV was determined using a Gaussian profile fit to the CCFs. The line-shape indicators were determined from the CCFs themselves. The frequency analysis was performed manually using standard pre-whitening. The dominant period was found after applying a Fourier transform. Then, the Fourier series were fitted to the data in the form of
 (1)
(1)
where A0 is the mean value, fk is kth frequency, and Ak and ϕk are its amplitude and phase. We included the dominant frequency and its harmonics in the fit that fulfilled the criterion Ak/σk > 4.0. Then, the fit was subtracted from the data, and the Fourier transform was applied to the residuals. The detected signals were included in the fit using Eq. (1). The last step was a rejection of outliers using 4σ clipping. This procedure was repeated for each star for four datasets: RV, FWHM, BIS, and contrast.
Some stars showed period changes and/or long-term trends. The period changes manifest themselves in the frequency spectrum as unresolved signals with a first-overtone frequency. Long-term trends manifest themselves as signals in the low-frequency range. We removed long-term trends, regardless of their origin, by subtracting polynomials from the data. QZ Nor shows particularly strong long-term trends, and period changes are present (Anderson 2014, 2018). Thus, there are significant remaining signals in the frequency spectrum of the residuals after pre-whitening with the dominant frequency and its harmonics. In the case of QZ Nor, we decided to limit the dataset to BJD from 2459331 to 2460157 to limit exposure to long-term trends. QZ Nor is one of the stars with the most observations in VELOCE. The selected time range covers the past three years, where monitoring has been particularly dense. By limiting the dataset, we therefore avoided the difficulties posed by the long-term modulations, but the dataset was still sufficiently precise for a search for additional low-amplitude signals.
The summary of the data for four stars is presented in Table 1. Table 2 contains the data for each of the stars we analysed.
Summary of the data for the four stars.
Sample of a table containing the data.
3. Results
We present the phased curves for four time series and the corresponding frequency spectra after pre-whitening with the first overtone and its harmonics in Figs. 1–4. In two stars of our sample, the detected additional signals have a period that forms a ratio of 0.60–0.65 with the first-overtone period. These stars are BG Cru and V0391 Nor.
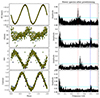 |
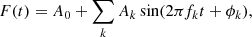
Fig. 1. Phased curves and frequency spectra for BG Cru. The consecutive rows correspond to the RV, FWHM, BIS and contrast data. Left panels: phased curves. BJD is colour-coded. Right panels: frequency spectra after pre-whitening with the first overtone and its harmonic. The positions of the first overtone and its harmonic are marked with dotted red lines. The dashed blue line marks the position of the additional signal. Its position is marked for datasets in which no detection was made. The horizontal cyan line corresponds to three times the average noise level. The frequency range is plotted up to the Nyquist frequency, which is defined as a median of separations between the observations. |
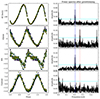 |
Fig. 3. Same as Fig. 1, but for QZ Nor. The first-overtone harmonic has a higher frequency than the Nyquist frequency and thus is not shown in the power spectrum. |
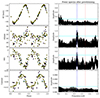 |
Fig. 4. Same as Fig. 1, but for V0411 Lac. The first-overtone harmonic has a higher frequency than the Nyquist frequency and thus is not shown in the power spectrum. |
In the case of the BG Cru RV data, a signal remains after pre-whitening at the position of the first overtone, indicating that the first-overtone amplitude and frequency change in time. The additional signal, forming a period ratio of around 0.61, is detected in the FWHM and contrast data using the arbitrarily chosen threshold of detection of three times the average noise level in the considered frequency range (cyan line in the pre-whitened power spectra). The signal detected using FWHM data has an S/N = 4.242, which is higher than the chosen threshold, whereas the signal detected in the power spectrum of the contrast data has an S/N = 4.48. Interestingly, even more additional signals are detected. In the RV, FWHM, and BIS frequency spectra, there is a signal with a period of P ≈ 3.0 d, which is close to the first-overtone period. This signal alone remains in the frequency spectrum of BIS after pre-whitening. BG Cru is an interesting object that shows line splitting in its line profiles (see Anderson 2013; Kovtyukh et al. 2003). This observed periodicity might be a manifestation of line splitting and will be studied in detail elsewhere (Netzel et al., in prep.). Another additional signal is visible at a low-frequency range for the FWHM and contrast. This signal has a period of around 55 d. Similar signals at low frequencies with periods of around 42 d and 60 d were already reported in Polaris (Hatzes & Cochran 2000; Anderson 2019). The origin of this long-period signal in BG Cru is uncertain.
In V0391 Nor, the additional signal detected in BIS and FWHM data is not a single coherent peak, but rather a cluster of close peaks. Only a few peaks from the cluster exceed the threshold marked with a cyan line. Namely, the S/N of the highest-amplitude signal is S/N = 3.51 in the BIS power spectrum. The highest-amplitude signal in the power spectrum of the FWHM data has S/N = 3.65. In FWHM in particular, the power excess at this frequency range is visible. The period ratio formed by the highest-amplitude peak of the cluster nicely fits the expected period ratio of 0.61 Cepheids. We do not expect to find any instrumental signals with a similar frequency either. We therefore confirm the detection of the signal. We note that similar features in frequency spectra are also known for the photometric data for classical Cepheids (see e.g. Fig. 7 in Rathour et al. 2021) and for RR Lyrae stars (e.g. Netzel et al. 2023b). It was shown for RR Lyrae stars that the additional signals in 0.61 stars can have strong temporal variations in amplitude and phase, resulting in wide structures observed in frequency spectra (e.g. Moskalik et al. 2015; Benkő et al. 2023). Moreover, the observations for V0391 Nor are much less numerous and have a significantly lower S/N than for BG Cru (see Table 1). The RV data show a significant trend (which is clearly visible in the phased RV data) that was not fully removed with a polynomial fitted to the data. Consequently, the power spectrum contains a strong signal in the low-frequency range. To determine whether the increased noise level might hamper the detection of additional signals, we removed the trend using a spline function. After removing the trend, no additional signal was detected in the RV power spectrum.
In QZ Nor, we found an additional signal with a period longer than the first-overtone period, and the two signals form a period ratio of around 1.28 (shorter-to-longer period ratio of 0.78) in the RV, BIS, and FWHM data. When analysing the RV data, we detected harmonics of the additional signal and linear combinations of the additional periodicity and the first-overtone frequency. Linear combinations were also found based on BIS data. In the case of the FWHM, there is an additional signal at a frequency of around 0.47 c/d. This signal is also detectable in BIS data, but it has a higher amplitude than the additional signal forming a period ratio of 0.78. The frequency of 0.47 c/d would correspond to the linear combination of the first-overtone frequency and the frequency of the 0.78 signal. A similar period ratio to that observed in QZ Nor was already reported in the literature as a period ratio formed by the sub-harmonics of 0.61 signals (based on photometric data, see e.g. Rathour et al. 2021; Smolec et al. 2023). The period ratio formed by the harmonic of the additional signal in QZ Nor fits the 0.60–0.65 range. Consequently, we also consider QZ Nor to be member of the 0.61 group, together with BG Cru and V0391 Nor. We note that RR Lyrae stars also include cases like this (Netzel & Smolec 2019; Benkő et al. 2021). QZ Nor also shows long-term RV amplitude changes that were studied by Anderson (2014, 2020). Interestingly, these variations are also visible in the FWHM data. Even though we limited the dataset to a shorter time range, the changes in the FWHM are strong enough to cause the remnant signals to be unresolved with the first-overtone frequency in the frequency spectrum of the FWHM.
In V0411 Lac BIS and FWHM data, we detected an additional signal that has a longer period and forms a period ratio of 0.687 with the first-overtone period. The detection is more significant in the FWHM power spectrum, where the additional signals has an S/N = 4.60. In the BIS power spectrum, the additional signal has an S/N = 3.68. Moreover, in the FWHM power spectrum, we also detected a harmonic of the additional signal. Based on the period ratio formed by the first-overtone frequency and the additional signal, and because the additional signal has a longer period than the first overtone, we consider V0411 Lac to be a member of the 0.68 group previously identified using photometric observations.
The periods and period ratios in BG Cru, V0391 Nor, QZ Nor, and V0411 Lac are collected in Table 3. There are multiple rows for all stars because the detections were made in more than one dataset.
Parameters for four stars with a detection of additional signals.
We plot BG Cru, V0391 Nor, QZ Nor, and V0411 Lac in the Petersen diagram (the diagram of the period ratio vs the longer period) in Fig. 5. As a reference, we plot the 0.61 and 0.68 Cepheids identified based on photometric studies. Three characteristic sequences are visible for the 0.61 stars. The 0.68 stars form a single sequence. The 0.61 stars show differences in the sequences between stars from the LMC, SMC, and the Galactic field. Specifically, the period ratios of individual sequences, the dispersion within the sequences, and their slope and intercept differ for each sample. The differences between the LMC and SMC sample have recently been analysed in detail by Smolec et al. (2023) based on photometric observations. The number of known 0.61 stars in the Milky Way (red triangles in Fig. 5) is small. Moreover, they typically have longer periods and show larger scatter. There is no significant difference between 0.68 stars from the LMC and SMC, but the number of known stars is small.
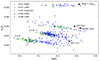 |
Fig. 5. Petersen diagram for 0.61 and 0.68 stars. The green points correspond to Cepheids from the SMC, the blue points correspond to Cepheids from the LMC, and the red points correspond to Cepheids from the Galactic disk (Rathour et al. 2021). Our stars are plotted with black asterisks using values based on the FWHM. The interpretation of individual sequences, i.e. the degree of the non-radial mode, according to the theory by Dziembowski (2016) is marked in the figure. |
For the 0.61 stars, the theory by Dziembowski (2016) predicts that the sequences visible in Fig. 5 are formed by the harmonics of non-radial modes of degrees 7, 8, and 9 (see Sect. 4 for further discussion). The degrees, ℓ, of these modes are indicated in Fig. 5 too.
V0391 Nor is located slightly above the long-period part of the top sequence. BG Cru seems to be located in the long-period extension of the middle sequence. However, in the long-period range, the scatter in period ratios is significant, and the sequences are no longer precisely determined as in the case of the short-period range. QZ Nor is plotted in the Petersen diagram using the period ratio that would be formed by the harmonic of the detected additional signal, that is, 0.5PX/P1O, where PX is the period of the detected additional signal.
V0411 Lac fits the progression defined by the other 0.68 stars known from photometric studies very well.
4. Discussion
Additional short-period signals forming a period ratio of around 0.61 are often detected among classical Cepheids and RR Lyrae stars that pulsate in the first overtone based on photometric observations. The signals detected in BG Cru and V0391 Nor place these two stars inside the group of 0.61 Cepheids in the Petersen diagram (Fig. 5).
The observed period ratio, which was previously only detected in photometric observations, was considered extensively for Cepheids and RR Lyrae stars. The origin of the additional signal as another radial mode was ruled out because of the value of the period ratio for Cepheids (Dziembowski 2012) and for RR Lyrae stars (Moskalik et al. 2015; Netzel et al. 2015b). Therefore, the origin was most likely attributed to non-radial modes. However, the signal forming the period ratio of 0.61 was challenging to explain as non-radial modes, as discussed by Dziembowski (2012). The most promising explanation, which involved sub-harmonics of the additional signals, was proposed by Dziembowski (2016), and was verified based on photometric observations (e.g. Smolec & Śniegowska 2016). Netzel & Kolenberg (2021) discussed the possibility of detecting the same phenomenon as observed in photometric data, but in spectroscopic time-series, and they showed that a detection is possible for a dataset of sufficient quality. Netzel & Kolenberg (2021) also showed, based on synthetic spectra, that the amplitude of the non-radial mode and its harmonic depends on their degree and azimuthal order, as well as on the inclination of a star. In many combinations of these parameters, it can therefore often be observed that the harmonic has a higher amplitude than the non-radial mode. This case is similar to what we observe for the 0.61 stars using photometry.
Therefore, in BG Cru and V0391 Nor, we most likely observe the same phenomenon. According to the explanation for the 0.61 stars by Dziembowski (2016), the signal detected in BG Cru would correspond to the harmonic of the non-radial mode of degree ℓ = 8. The period ratio in V0391 Nor would correspond to the harmonic of the non-radial mode of degree ℓ = 7.
As already discussed in Sect. 3, the signal in QZ Nor is consistent with the interpretation that it is a sub-harmonic of the 0.61 signal. Therefore, according the explanation by Dziembowski (2016), it would correspond to the non-radial mode of degree ℓ = 7. We note that the case of QZ Nor is common for 0.61 stars. There are known stars from photometric studies in which the sub-harmonic has a higher amplitude than the additional signal or where it is the only detected additional signal (e.g. Smolec et al. 2023). It is worth noting that in the Petersen diagram, these sub-harmonics tend to form a clump rather than distinct sequences, in contrast to the well-defined sequences for the 0.61 signals. Moreover, Netzel & Kolenberg (2021) also showed cases in which the non-radial mode has a higher amplitude than its harmonic or is even the only detected signal.
The stars we studied here fulfil the criteria for the detection established by Netzel & Kolenberg (2021). The S/N and the number of spectra required to detect the non-radial modes of degrees 7, 8, and 9 or its harmonics was determined to be at least 50–100 spectra with an S/N of at least 200–300. These requirements are fulfiled for the stars analysed here (see Table 1) through the high S/N provided by CCFs. We note, however, that in the case of V0391 Nor, the dataset falls at the lower limit of the requirements. However, the VELOCE project is ongoing, and further observations of the analysed targets are anticipated. This continued data collection should enable a clearer and more definitive identification of the signals discussed in this paper.
Kovtyukh et al. (2003) have reported unusual line profile variations in several classical Cepheids, in particular, in BG Cru, and suggested pulsations in non-radial modes as a possible explanation. We were able to confirm the presence of additional signals in line profile variations. Moreover, BG Cru shows line splitting (Anderson 2013; Usenko et al. 2014), which will be studied in detail elsewhere (Netzel et al., in prep.).
Table 3 shows that the signals were detected in different datasets. For all stars, the detection was made based on FWHM data. With the exception of BG Cru, the detection was also possible using BIS data. The additional signal was detected using contrast only in the case of BG Cru. QZ Nor is the only star in which the detection was also made based on RV data. The reason for the detections and lack of them in different datasets is unclear. The parameters we used are different measures of line profile variations. The RV is sensitive to pulsational velocity, the FWHM is sensitive to turbulent broadening, the BIS is sensitive to both pulsational velocity and velocity gradients, and contrast is sensitive to temperature variations. Moreover, the RV is calculated based on the Gaussian fit to the CCF profile, while FWHM, BIS, and contrast are directly calculated from the CCF profile. For all stars, these signals were detected in either FWHM or BIS, which are more sensitive to shape variations in the CCF profiles. However, in the case of BG Cru, we hypothesize that the line splitting in this star hampers the detection in BIS.
VELOCE provides data for 58 first-overtone Cepheids. We report the discovery of the additional signals here that are analogous to groups known from photometry in four stars. We note, however, that there are significant differences between the datasets for each of the 58 Cepheids in terms of the number of observations and S/N of spectra. Hence, it is not possible to draw any meaningful conclusion about the incidence rate of additional signals in our dataset. We also note that the VELOCE observations continue. Moreover, the sampling of VELOCE is optimal for the detection of these phenomena since around 2021. Hence, we expect to be able to increase our sample of first-overtone Cepheids with spectroscopic detections of additional signals. This first result of the series is just a beginning of a systematic study of the modulation zoo of classical Cepheids.
5. Conclusions
We analysed spectroscopic time series for first-overtone Cepheids collected during the VELOCE project (Anderson et al., in prep.). We performed a frequency analysis of the radial velocities (RV), the full width at half maximum (FWHM), the bisector inverse span (BIS), and the relative depth (contrast) determined from CCFs with a very high S/N. We reported the very first discovery of signals known in the so-called 0.61 and 0.68 Cepheids in spectroscopic data.
In BG Cru and V0391 Nor, we detected additional signals that form a period ratio with the first overtone in the range of 0.60–0.65, which makes these stars the first members of the 0.61 group that are detected using spectroscopic data. According to the model by Dziembowski (2016), the signals detected in BG Cru and V0391 Nor correspond to non-radial modes of degrees 7 and 8, respectively.
In QZ Nor, we detected an additional signal that forms a period ratio of around 1.28 with the first overtone. The harmonic of that signal would form a period ratio of around 0.64. Therefore, we consider QZ Nor to be a member of the 0.61 group, and we note that similar cases are known from photometric studies. The signal detected in QZ Nor is a non-radial mode of degree 7.
In V0411 Lac, we detected an additional signal that has a longer period than the first-overtone period and forms a period ratio of 0.687. We classify this star as a member of the 0.68 group, which was established based on photometric observations. This group is particularly puzzling because the nature of the additional signal has yet to be explained. This very first detection of the 0.68 signal using spectroscopic data will hopefully provide new insights into the origin of this mysterious signal.
We not only reported the discovery of additional periodicity, but were able to show that we most likely encounter the same phenomenon as was established based on photometry data for the 0.61 and 0.68 stars. This result takes us one step closer to the concluding identification of the nature of the additional signals.
Our findings show the wealth of information that can be derived from line-shape indicators such as the full width at half maximum, the bisector inverse span, and the relative line depth, in addition to the insights offered by radial velocity time series.
The classification of 57 stars was based on a Gaia DR3 classification (Ripepi et al. 2023). The 58th star is Polaris, which is absent in the Gaia classification.
The S/N reported here for individual peaks is calculated using a box of width 0.5 c/d and excludes the signal.
Acknowledgments
This work was supported by the European Research Council (ERC) under the European Union’s Horizon 2020 research and innovation programme (Grant Agreement No. 947660). RIA is funded by the SNSF through an Eccellenza Professorial Fellowship, grant number PCEFP2_194638. This work uses frequency analysis software written by R. Smolec. The Euler telescope is funded by the Swiss National Science Foundation (SNSF). This research is based on observations made with the Mercator Telescope, operated on the island of La Palma by the Flemish Community, at the Spanish Observatorio del Roque de los Muchachos of the Instituto de Astrofísica de Canarias. Hermes is supported by the Fund for Scientific Research of Flanders (FWO), Belgium, the Research Council of K.U. Leuven, Belgium, the Fonds National de la Recherche Scientifique (F.R.S.-FNRS), Belgium, the Royal Observatory of Belgium, the Observatoire de Geneève, Switzerland, and the Thüringer Landessternwarte, Tautenburg, Germany. We acknowledge the contributions of all observers who contributed to collecting the VELOCE dataset.
References
- Anderson, R. I. 2013, Ph.D. Thesis, University of Geneva, Astronomical Observatory, Switzerland [Google Scholar]
- Anderson, R. I. 2014, A&A, 566, L10 [NASA ADS] [CrossRef] [EDP Sciences] [Google Scholar]
- Anderson, R. I. 2016, MNRAS, 463, 1707 [NASA ADS] [CrossRef] [Google Scholar]
- Anderson, R. I. 2018, in The RR Lyrae 2017 Conference. Revival of the Classical Pulsators: from Galactic Structure to Stellar Interior Diagnostics, eds. R. Smolec, K. Kinemuchi, & R. I. Anderson, 6, 193 [Google Scholar]
- Anderson, R. I. 2019, A&A, 623, A146 [NASA ADS] [CrossRef] [EDP Sciences] [Google Scholar]
- Anderson, R. I., 2020, in Stars and their Variability Observed from Space, eds. C. Neiner, W. W. Weiss, D. Baade, et al. (University of Vienna), 61 [Google Scholar]
- Anderson, R. I., Mérand, A., Kervella, P., et al. 2016, MNRAS, 455, 4231 [Google Scholar]
- Baranne, A., Queloz, D., Mayor, M., et al. 1996, A&AS, 119, 373 [NASA ADS] [CrossRef] [EDP Sciences] [Google Scholar]
- Benkő, J. M., & Kovács, G. B. 2023, A&A, 680, L6 [NASA ADS] [CrossRef] [EDP Sciences] [Google Scholar]
- Benkő, J. M., Sódor, Á., & Pál, A. 2021, MNRAS, 500, 2554 [Google Scholar]
- Benkő, J. M., Plachy, E., Netzel, H., et al. 2023, MNRAS, 521, 443 [Google Scholar]
- Dziembowski, W. A. 2012, Acta Astron., 62, 323 [NASA ADS] [Google Scholar]
- Dziembowski, W. A. 2016, Commmunications of the Konkoly Observatory Hungary, 105, 23 [NASA ADS] [Google Scholar]
- Hatzes, A. P., & Cochran, W. D. 2000, AJ, 120, 979 [CrossRef] [Google Scholar]
- Kovtyukh, V. V., Andrievsky, S. M., Luck, R. E., & Gorlova, N. I. 2003, A&A, 401, 661 [NASA ADS] [CrossRef] [EDP Sciences] [Google Scholar]
- Mayor, M., & Queloz, D. 1995, Nature, 378, 355 [Google Scholar]
- Molnár, L., & Szabados, L. 2014, MNRAS, 442, 3222 [Google Scholar]
- Moskalik, P., & Kołaczkowski, Z. 2009, MNRAS, 394, 1649 [Google Scholar]
- Moskalik, P., Smolec, R., Kolenberg, K., et al. 2015, MNRAS, 447, 2348 [NASA ADS] [CrossRef] [Google Scholar]
- Netzel, H. 2022, VIDEOMemorie of the Italian Astronomical Society, Lyrae and Cepheids IV: Large-scale surveys as bridges between spectroscopy and photometry, 2, 22 [Google Scholar]
- Netzel, H., & Kolenberg, K. 2021, MNRAS, 508, 3508 [CrossRef] [Google Scholar]
- Netzel, H., & Smolec, R. 2019, MNRAS, 487, 5584 [NASA ADS] [CrossRef] [Google Scholar]
- Netzel, H., & Smolec, R. 2022, MNRAS, 515, 3439 [NASA ADS] [CrossRef] [Google Scholar]
- Netzel, H., Smolec, R., & Dziembowski, W. 2015a, MNRAS, 451, L25 [NASA ADS] [CrossRef] [Google Scholar]
- Netzel, H., Smolec, R., & Moskalik, P. 2015b, MNRAS, 447, 1173 [NASA ADS] [CrossRef] [Google Scholar]
- Netzel, H., Molnár, L., & Joyce, M. 2023a, MNRAS, 525, 5378 [NASA ADS] [CrossRef] [Google Scholar]
- Netzel, H., Molnár, L., Plachy, E., & Benkő, J. M. 2023b, A&A, 677, A177 [NASA ADS] [CrossRef] [EDP Sciences] [Google Scholar]
- Olech, A., & Moskalik, P. 2009, A&A, 494, L17 [NASA ADS] [CrossRef] [EDP Sciences] [Google Scholar]
- Pietrukowicz, P., Dziembowski, W. A., Mróz, P., et al. 2013, Acta Astron., 63, 379 [Google Scholar]
- Plachy, E., Pál, A., Bódi, A., et al. 2021, ApJS, 253, 11 [NASA ADS] [CrossRef] [Google Scholar]
- Raskin, G., van Winckel, H., Hensberge, H., et al. 2011, A&A, 526, A69 [CrossRef] [EDP Sciences] [Google Scholar]
- Rathour, R. S., Smolec, R., & Netzel, H. 2021, MNRAS, 505, 5412 [NASA ADS] [CrossRef] [Google Scholar]
- Ripepi, V., Clementini, G., Molinaro, R., et al. 2023, A&A, 674, A17 [NASA ADS] [CrossRef] [EDP Sciences] [Google Scholar]
- Ségransan, D., Udry, S., Mayor, M., et al. 2010, A&A, 511, A45 [NASA ADS] [CrossRef] [EDP Sciences] [Google Scholar]
- Smolec, R. 2017, MNRAS, 468, 4299 [NASA ADS] [CrossRef] [Google Scholar]
- Smolec, R., & Śniegowska, M. 2016, MNRAS, 458, 3561 [NASA ADS] [CrossRef] [Google Scholar]
- Smolec, R., Ziółkowska, O., Ochalik, M., & Śniegowska, M. 2023, MNRAS, 519, 4010 [NASA ADS] [CrossRef] [Google Scholar]
- Soszyński, I., Poleski, R., Udalski, A., et al. 2008, Acta Astron., 58, 163 [NASA ADS] [Google Scholar]
- Soszyński, I., Poleski, R., Udalski, A., et al. 2010, Acta Astron., 60, 17 [NASA ADS] [Google Scholar]
- Soszyński, I., Udalski, A., Szymański, M. K., et al. 2015a, Acta Astron., 65, 329 [NASA ADS] [Google Scholar]
- Soszyński, I., Udalski, A., Szymański, M. K., et al. 2015b, Acta Astron., 65, 297 [NASA ADS] [Google Scholar]
- Süveges, M., & Anderson, R. I. 2018a, A&A, 610, A86 [NASA ADS] [CrossRef] [EDP Sciences] [Google Scholar]
- Süveges, M., & Anderson, R. I. 2018b, MNRAS, 478, 1425 [CrossRef] [Google Scholar]
- Usenko, I. A., Kniazev, A. Y., Berdnikov, L. N., Fokin, A. B., & Kravtsov, V. V. 2014, Astron. Lett., 40, 435 [NASA ADS] [CrossRef] [Google Scholar]
- Van Malle, M. N. 2016, Ph.D. Thesis, University of Geneva, Switzerland [Google Scholar]
- Zima, W. 2008, Commun. Asteroseismol., 157, 387 [NASA ADS] [Google Scholar]
All Tables
All Figures
|
Fig. 1. Phased curves and frequency spectra for BG Cru. The consecutive rows correspond to the RV, FWHM, BIS and contrast data. Left panels: phased curves. BJD is colour-coded. Right panels: frequency spectra after pre-whitening with the first overtone and its harmonic. The positions of the first overtone and its harmonic are marked with dotted red lines. The dashed blue line marks the position of the additional signal. Its position is marked for datasets in which no detection was made. The horizontal cyan line corresponds to three times the average noise level. The frequency range is plotted up to the Nyquist frequency, which is defined as a median of separations between the observations. |
| In the text | |
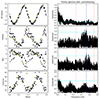 |
Fig. 2. Same as Fig. 1, but for V0391 Nor. |
| In the text | |
|
Fig. 3. Same as Fig. 1, but for QZ Nor. The first-overtone harmonic has a higher frequency than the Nyquist frequency and thus is not shown in the power spectrum. |
| In the text | |
|
Fig. 4. Same as Fig. 1, but for V0411 Lac. The first-overtone harmonic has a higher frequency than the Nyquist frequency and thus is not shown in the power spectrum. |
| In the text | |
|
Fig. 5. Petersen diagram for 0.61 and 0.68 stars. The green points correspond to Cepheids from the SMC, the blue points correspond to Cepheids from the LMC, and the red points correspond to Cepheids from the Galactic disk (Rathour et al. 2021). Our stars are plotted with black asterisks using values based on the FWHM. The interpretation of individual sequences, i.e. the degree of the non-radial mode, according to the theory by Dziembowski (2016) is marked in the figure. |
| In the text | |
Current usage metrics show cumulative count of Article Views (full-text article views including HTML views, PDF and ePub downloads, according to the available data) and Abstracts Views on Vision4Press platform.
Data correspond to usage on the plateform after 2015. The current usage metrics is available 48-96 hours after online publication and is updated daily on week days.
Initial download of the metrics may take a while.