Fig. 1.
Download original image
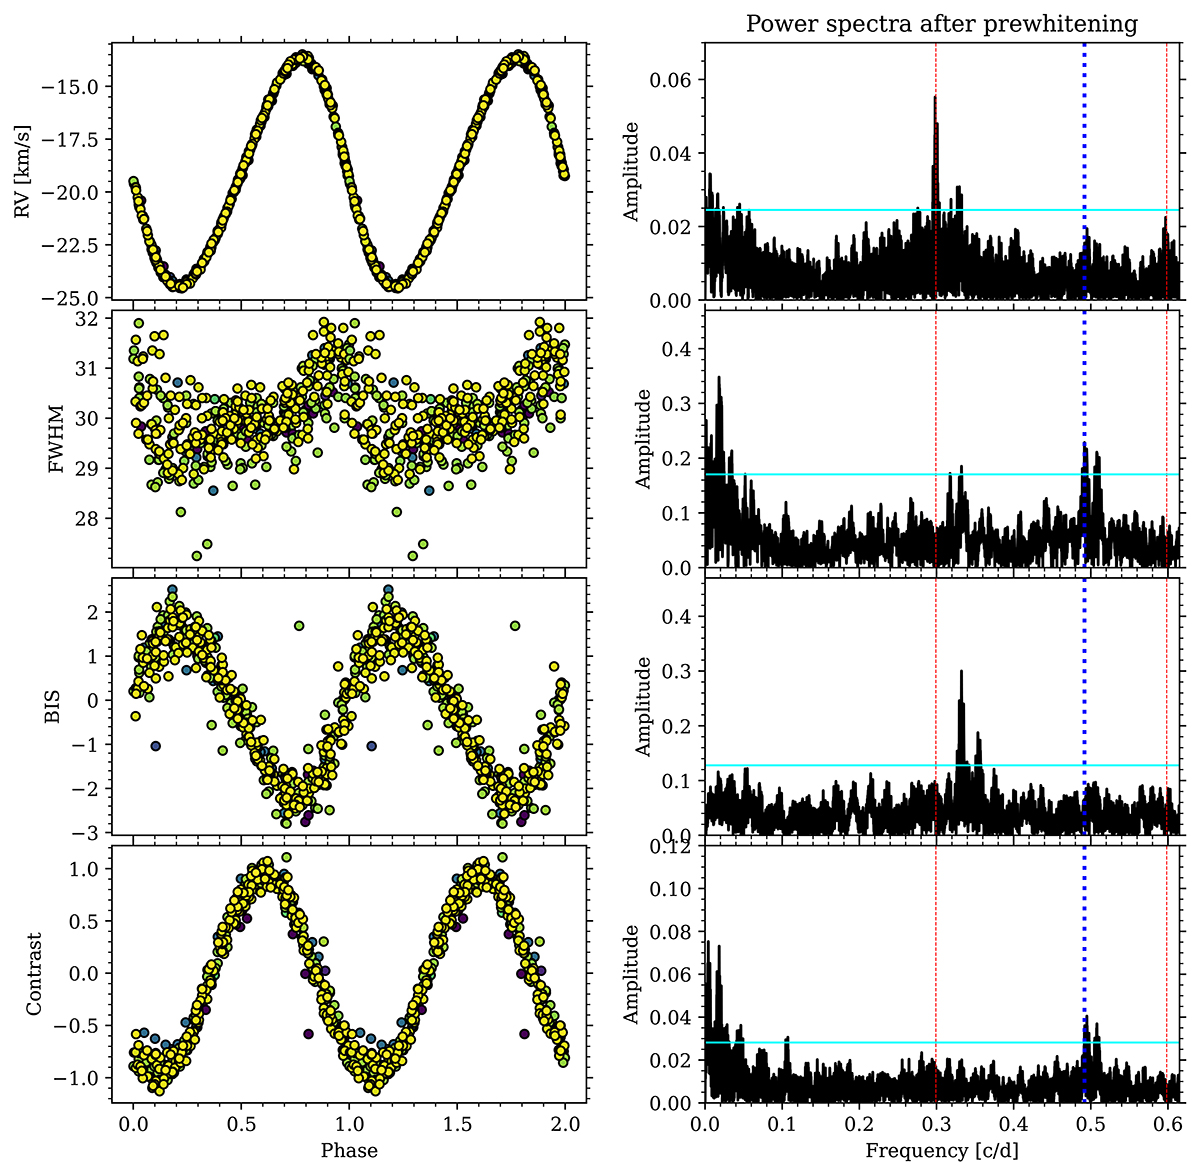
Phased curves and frequency spectra for BG Cru. The consecutive rows correspond to the RV, FWHM, BIS and contrast data. Left panels: phased curves. BJD is colour-coded. Right panels: frequency spectra after pre-whitening with the first overtone and its harmonic. The positions of the first overtone and its harmonic are marked with dotted red lines. The dashed blue line marks the position of the additional signal. Its position is marked for datasets in which no detection was made. The horizontal cyan line corresponds to three times the average noise level. The frequency range is plotted up to the Nyquist frequency, which is defined as a median of separations between the observations.
Current usage metrics show cumulative count of Article Views (full-text article views including HTML views, PDF and ePub downloads, according to the available data) and Abstracts Views on Vision4Press platform.
Data correspond to usage on the plateform after 2015. The current usage metrics is available 48-96 hours after online publication and is updated daily on week days.
Initial download of the metrics may take a while.