| Issue |
A&A
Volume 698, June 2025
|
|
|---|---|---|
| Article Number | A287 | |
| Number of page(s) | 17 | |
| Section | Stellar structure and evolution | |
| DOI | https://doi.org/10.1051/0004-6361/202453395 | |
| Published online | 20 June 2025 | |
The VELOCE modulation zoo
III. Detecting additional pulsation modes in optical spectra of classical Cepheids using semi-partial distance correlation periodograms
1
Institute of Physics, École Polytechnique Fédérale de Lausanne (EPFL), Observatoire de Sauverny, 1290 Versoix, Switzerland
2
Nicolaus Copernicus Astronomical Center, Polish Academy of Sciences, Bartycka 18, 00-716 Warsaw, Poland
3
Porter School of the Environment and Earth Sciences, Raymond and Beverly Sackler Faculty of Exact Sciences, Tel Aviv University, Tel Aviv 6997801, Israel
4
Department of Particle Physics and Astrophysics, Weizmann Institute of Science, Rehovot 7610001, Israel
5
Astronomy Department of the University of Geneva, 51 Ch. des Maillettes, 1290 Versoix, Switzerland
6
School of Physics and Astronomy, Raymond and Beverly Sackler Faculty of Exact Sciences, Tel Aviv University, Tel Aviv 6997801, Israel
⋆ Corresponding authors: This email address is being protected from spambots. You need JavaScript enabled to view it.
; This email address is being protected from spambots. You need JavaScript enabled to view it.
Received:
11
December
2024
Accepted:
14
April
2025
Abstract
Known for their large amplitude radial pulsations, classical Cepheids are critical standard candles in astrophysics. However, they also exhibit various pulsational irregularities and additional signals that provide deeper insights into their structure and evolution. These signals appear in spectroscopic observations as shape deformations of the spectral lines. Using semi-partial distance correlation periodograms, we analysed high-precision spectroscopic data from the VELOCE project for four stars: δ Cephei (δ Cep), BG Crucis (BG Cru), X Sagittarii (X Sgr), and Polaris. For δ Cephei, our control star, only the main radial mode was detected, confirming its stability and suitability as a benchmark for the method. In BG Crucis, a strong additional signal at ∼3.01 days was identified, likely linked to line splitting. X Sagittarii exhibited dominant additional signals, notably one at ∼12.31 days, also associated with significant line splitting. Polaris revealed multiple low-frequency signals, with the most prominent candidate at ∼59.86 days, which might be linked to the star’s rotation period. We explored the semi-partial distance correlation periodograms by incorporating cross-correlation functions (CCFs) and their variants, such as the median-subtracted CCFs, which improved the sensitivity to variations in line shape. In particular, the latter enabled the faithful detection of primary and additional signals present in the 1D spectra of fainter stars and low-amplitude pulsators. The semi-partial distance correlation periodograms demonstrated their utility for isolating signals associated with line shape variations; although, the analyses were complicated by the presence of artefact subharmonics and a visible low-frequency power increase for Polaris and BG Crucis. This study underscores the method’s potential for finding new and unexpected signals as well as detailed analyses of Cepheid pulsations and opens new pathways for asteroseismic investigations.
Key words: methods: statistical / techniques: spectroscopic / stars: oscillations / stars: variables: Cepheids
© The Authors 2025
 Open Access article, published by EDP Sciences, under the terms of the Creative Commons Attribution License (https://creativecommons.org/licenses/by/4.0), which permits unrestricted use, distribution, and reproduction in any medium, provided the original work is properly cited.
This article is published in open access under the Subscribe to Open model. This email address is being protected from spambots. You need JavaScript enabled to view it. to support open access publication.
1. Introduction
Classical Cepheids are well known for their large amplitude radial pulsations that render them useful as standard candles. However, Cepheids also harbour a host of interesting pulsational irregularities and additional signals of varying intensity and difficulty to detect that may provide further insights into their structure and evolution. The most well-known pulsational instability in Cepheids concerns nearly linear variations of the pulsation period P over time (in s/yr) when observed over timescales lasting several decades (e.g. Szabados 1983; Turner et al. 2006; Csörnyei et al. 2022; Anderson et al. 2024) that are typically attributed to secular evolution and generally agree with predictions from stellar evolution (Anderson et al. 2016a). In addition, irregular and quasi-periodic short-term modulations of P have also been reported, the former notably in overtone pulsators (e.g. Pietrukowicz 2001; Evans et al. 2015; Süveges & Anderson 2018a,b) and the latter in long-period Cepheids, such as RS Puppis (Kervella et al. 2017, see also Anderson et al. 2024). Furthermore, we can also mention Blazhko-like periodic or quasi-periodic modulation in Cepheids, a seemingly rare occurrence, whose cause is still a mystery (Molnár et al. 2013). The frequency-modulated nature of these large amplitude primary pulsation modes hinders the detectability of lower-amplitude additional pulsation modes (Süveges & Anderson 2018a), which could cast open an asteroseismic window for unravelling the physics of Cepheids.
Most previous work to detect additional modes has employed precise space-based (Plachy et al. 2021) and long (temporal) baseline ground-based photometric observations in search of these signals (e.g. Rathour et al. 2021; Smolec et al. 2023, and references therein). In many of the first-overtone Cepheids, the additional, low-amplitude signals forming period ratios of around 0.61–0.65 with the first overtone were detected, the so-called 0.61 signals. Interestingly, analogous signals forming the same characteristic period ratio were also found in the first-overtone RR Lyrae stars (e.g. Benkő et al. 2023; Netzel & Smolec 2019; Netzel et al. 2023). According to Dziembowski (2016), the 0.61 signals correspond to the harmonics of non-radial modes: the period ratio of 0.61 is formed by P1O/(0.5Pnr), where P1O is the first-overtone period and Pnr is a non-radial mode period. That is to say, the subharmonics of the 0.61 signals are the non-radial modes. Or, conversely, the signals observed are the harmonics of the non-radial mode. In the case of classical Cepheids, the non-radial modes have degrees 7, 8, or 9, while in the case of RR Lyrae stars, the degrees are 8 or 9. Another interesting group with additional signals includes the so-called 0.68 stars, in which the signal has a period longer than the first overtone period and both form a ratio of around 0.68 (Poretti et al. 2014; Süveges & Anderson 2018a). Again, the analogous group is known among RR Lyrae stars (e.g. Netzel et al. 2015a, 2023). The origin of 0.68 signals is not as thoroughly understood at this time, as the suggested interpretations encounter challenges (see discussion in Netzel et al. 2015b; Dziembowski 2016; Benkő & Kovács 2023).
Additional periodic or quasi-periodic phenomena also manifest in spectroscopic observations and radial velocity (RV) time series. In particular, Anderson (2014, 2020) show that overtone Cepheids exhibit long-term (decade or longer) modulations of their RV curves, whereas long-period Cepheids, such as ℓ Car and RS Puppis, exhibit fast cycle-to-cycle differences in RV curve shape and amplitude (cf. also Anderson 2016; Anderson et al. 2016b). The VELOcities of CEpheids (VELOCE) project (Anderson et al. 2024, hereafter A24) has now revealed these modulations in 31 Milky Way Cepheids, showing that they are a common feature of Cepheids whose detectability is mainly a question of precision and observational detail. In particular, the detection of non-radial modes requires sufficient phase sampling, number of observations (Nobs) and signal-to-noise ratio (S/N; e.g. Netzel & Kolenberg 2021).
The VELOCE modulation zoo makes use of high-precision RV measurements and spectroscopic observations from the VELOCE project to investigate the detectability of additional signals in Cepheids and to identify promising strategies for systematic analyses. Netzel et al. (2024, hereafter N24) report the detection of likely non-radial pulsation modes based on the analysis of numerical parameters that describe the asymmetry –bisector inverse span (BIS)–, full width at half maximum (FWHM), and depth (contrast) in four overtone Cepheids. Three of which belong to the 0.61 group (BG Cru, QZ Normae, and V391 Normae), whereas V0411 Lacertae belongs to the 0.68 group. In a follow-up study, Netzel et al. (2025, hereafter N25) consider the relation between such signals and line splitting features observed in X Sgr, BG Cru, and other Cepheids (cf. also Kovtyukh et al. 2003). A24 and N24 thus demonstrate the general detectability of additional signals detected using Kepler and TESS (Plachy et al. 2021) using VELOCE observations. Additionally, A24 and N24 confirmed that the modulated variability of Cepheids primarily changes line shapes rather than line positions (i.e. Doppler shift) (see e.g. Anderson 2016, 2019, 2020). Hence, observed RV modulations originate from line shape variations that do not occur in phase with the dominant radial mode, and the characterisation of such signals should focus on line shapes, rather than positions.
Semi-partial distance correlation periodograms have been recently developed to separate spectral line displacements due to Doppler shifts from line shape variations due to stellar activity or pulsations (Binnenfeld et al. 2022, hereafter B22). In a first test based on optical spectra of two Cepheids, Binnenfeld et al. show that the corresponding shape and shift periodograms successfully distinguished periodicities associated with the main pulsation mode and an orbital signal in two Cepheids, β Doradus and S Muscae. Interestingly, these periodograms can be computed directly using observed spectra and do not require the information present in line shapes to be reduced to just a few parameters, such as BIS, FWHM, and contrast.
This article aims to exploit the semi-partial distance correlation periodograms sensitive to shape variations (henceforth: shape periodograms) presented by B22 to probe the spectroscopic detectability of additional, possibly non-radial, pulsation modes in Cepheids. To this end, we analysed four very bright stars with a large number of high S/N observations from VELOCE: δ Cep, BG Cru, X Sgr and Polaris. In doing so, we seek to lay the groundwork for further in-depth study of such additional signals using larger telescopes (for better S/Ns) and instruments that feature higher line shape stability and resolution.
The article is structured as follows. Section 2 first describes the data collected as well as data products derived from the observations (Sect. 2.1) and in turn summarises the methodology of the shape periodograms (Sect. 2.2). Section 3 presents our results for the four stars individually (Sect. 3.1) and in turn considers the results with respect to one another (Sect. 3.2). Section 4 discusses the performance of the shape periodograms (Sect. 4.1) as well as the possible nature of the signals found (Sect. 4.2). The final Sect. 5 summarises the results and presents our conclusions.
2. Data and methods
This section is divided into two parts. Sect. 2.1 gives a description of the observations, the star sample, and their relevant parameters and Sect. 2.2 describes the functioning and application of the public python package SPectral vARiabiliTy Analysis (SPARTA), used throughout this work, to our data set.
2.1. Observational data used
We analyse optical high-resolution spectroscopic observations of four Cepheids collected as part of the VELOCE project (A24). Specifically, we selected four bright naked-eye Cepheids, for which high S/N spectra were available in abundance. δ Cephei was chosen as a control star, for which we do not expect to identify additional signals beyond the fundamental radial pulsation mode, since fundamental mode Cepheids of relatively short pulsation period (5–7 d) are known to be particularly stable pulsators, that is, they do not typically present significant changes in period or RV curve shape. Three additional stars, X Sgr, BG Cru, and Polaris were chosen because they are known to exhibit interesting additional phenomena of different types and timescales. X Sgr is strongly affected by line splitting (Mathias et al. 2006; Anderson 2013) and exhibits an additional 12 d periodicity in CCF parameters BIS and FWHM (N25). BG Cru exhibits weak line splitting and a 0.61 mode (Anderson 2013; Usenko et al. 2014) with periods close to the main radial mode. Figure 1 illustrates line splitting for X Sgr and BG Cru for two observations taken at virtually identical phase (cf. N25 for further details). Polaris is a well-known single-lined binary (P ∼ 30 yr) and is the oddball among Cepheids showing multi-periodic non-radial pulsation at large periods (P ≥ 20 d) and has been the cynosure of several studies in the past (Dinshaw et al. 1989; Hatzes & Cochran 2000; Lee et al. 2008; Anderson 2019; Torres 2023).
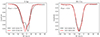 |
Fig. 1. CCF profiles (solid lines) of X Sgr (left) and BG Cru (right) observed at the same phase during different epochs and their respective Gaussian fit (dashed lines). Cycle-dependent line splitting patterns cause systematic error for RVs derived via fitting Gaussians (Anderson 2013). This phenomenon is much stronger in X Sgr where the systematic error between the two epochs is clearly more discernible than in BG Cru. |
Northern hemisphere targets were observed with the HERMES high-resolution échelle spectrograph mounted on the 1.2 m Mercator telescope at the Roque de los Muchachos observatory on the island of La Palma, Spain (Raskin et al. 2011). To achieve the best spectral resolution and throughput, all observations were made using the high-resolution fibre (HRF mode, R ∼ 85 000). Since HERMES underwent modifications to its optical system in April 2018, we consider HERMES observations before and after this date as though they had been obtained using different instruments, that is, we analyse the data separately. Southern hemisphere targets were observed with the high-resolution (R ∼ 60 000) Coralie échelle spectrograph mounted on the Euler Swiss telescope at La Silla Observatory in Chile. Since Coralie’s optical system was modified in November 2014, observations before and after this date are analysed separately. The instrument is referred to as C07 (between 2007 and 2014) or C14 (after 2014) respectively. The absolute wavelength calibration was provided by ThAr lamps. Simultaneous drift corrections were available on Coralie from intra-order ThAr or using a Fabry-Pérot étalon spectra. On both HERMES and Coralie, care was taken to avoid large (> 100 m s−1) drifts of the wavelength solution by recalibrating the instrument during the night.
Wavelength-merged spectra were prepared by the dedicated instrument pipelines following standard recipes. We restricted our analysis of wavelength-merged spectra to the wavelength range 5000–5800 Å, seeking to maximise wavelength coverage to enhance any signals, while remaining in a region that is insensitive to tellurics and interstellar medium lines (sodium doublet). We avoid the bluer regions of the spectral range for two reasons. First, the normalisation procedure performs poorly due to the high density of lines. Second, the efficiency of the instruments is a strong function of the wavelength and plateaus at ∼5000 Å (see e.g. Raskin et al. 2011).
We normalised the spectra using the pipeline embedded in SPARTA (see Sect. 4 and Appendix B for more details). Specifically, we resampled the spectra on a linear scale so that the wavelength values are evenly spaced. Then, we apply a Butterworth band-pass filter in order to remove the low-pass instrumental response and the high-pass instrumental noise. Finally a Tukey window is applied to smooth the data and reduce spectral leakage in view to improve the spectral analysis.
In addition to the merged spectra, we analyse cross-correlation functions (Baranne et al. 1996; Pepe et al. 2002, CCFs) computed using a G2 spectral line mask. CCFs have several advantages for the detectability of additional signals over wavelength-merged spectra (K. Barbey, Master thesis, EPFL, 2024), such as enhanced S/N and the elimination of confounding spectral features, including telluric lines and the shape of the observed spectral envelope. A downside, however, could be the weighting of spectral lines introduced by the G2 line mask. For this reason, we decided to analyse both wavelength-merged spectra and CCFs and to compare the outputs. RVs were determined by fitting Gaussian profiles to the CCFs as done in A24. The measured RVs are defined as the centre positions of Gaussian profiles fitted to the resulting high S/N CCF profiles. Since VELOCE observations have continued beyond the cut-off date for VELOCE’s first data release (March 2022), we included here new observations obtained since then. The observations are summarised in Table 1 and the sampling is presented on Fig. 2.
Summary of the data set used.
 |
Fig. 2. Sampling of spectroscopic observations for the four Cepheids. The x-axis represents the Barycentric Julian Date (BJD)-2400000 and the y-axis shows the measured radial velocities. We note that Polaris’ time series shows a clear downward trend due to orbital variation (P ∼ 30 yr). |
In the following, we write C(v) for CCF profiles where v is the radial velocity. In a time series of N observations, the i-th fitted Gaussian is then defined as follows (Pepe et al. 2002):
 (1)
(1)
where A denotes contrast and σ is related to the FWHM via:  .
.
Analogously to prewhitening procedures used in time series analysis, modifications of the input spectral shapes can enhance certain signals and diminish others. In addition to the original CCF profiles and the normalised spectra, we tested three variations on the CCF profiles as spectral shape inputs as illustrated in Figure 3:
-
The Gaussian fits, gi(v).
-
Median-residual CCFs obtained by subtracting the point-wise median of all CCF profiles,
 .
. -
Gaussian-residual CCFs obtained by subtracting the Gaussian fit from each CCF, Ci(v)−gi(v),
where i represents the i-th element in the time series. By construction and contrary to the median and Gaussian-residual CCF profiles, Gaussian fits do not contain information on line asymmetry because they are symmetric profiles.
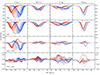 |
Fig. 3. Subset examples of normalised CCF profiles, their Gaussian fit, and residual CCF profiles computed by subtracting the median CCF or their respective Gaussian fit to each one of them. The colour coding traces the pulsation phase. Shape modulations are computed with the curves ‘at rest’, centred around the mean RV. For readability, the curves are shown in their original non-centred frame. X Sgr and δ Cep are fundamental mode pulsators whereas BG Cru and Polaris are first overtone ones. Line-splitting is noticeable in BG Cru’s and X Sgr’s C(v) data sets. |
2.2. Semi-partial distance correlation periodograms
Pulsation phenomena in classical Cepheids, both radial and non-radial, manifest in their spectra as modulations in the shape of the spectral lines. Since CCF profiles are commonly interpreted as ‘average line profiles’ pondered by their depth in the numerical mask (Queloz et al. 2001; Anderson 2013), it is unsurprising that they, too, exhibit such line shape variations. CCFs are often analysed under the scope of so-called line shape indicators such as BIS, FWHM, and the contrast or depth (A) which are straightforward parameters to use in periodograms. They can identify and quantify CCF profiles shape periodicities (e.g. Anderson 2016, 2019; Netzel et al. 2024). However, they contain a reduced amount of information and correlation between themselves.
The ‘shape’ (i.e. line shape variation sensitive) and ‘shift’ (i.e. line shift variation sensitive) periodograms introduced by B22 present a more general approach to detecting periodic signals based on line shape deformations and line shifts. They rely on the detection of modulations in the line profiles themselves without resorting to the extraction of a single-valued parameter per observation. The method, implemented in the public Python package SPARTA1, is here summarised. A detailed prescription on the periodogram calculation can be found in B22 and references therein.
Distance correlation is a generalised measure of statistical dependence between two random variables. Unlike Pearson’s correlation, it is sensitive to non-linear dependencies and can be used between random variables of different dimensions. Similarly, semi-partial distance correlation is the generalised counterpart to semi-partial correlation. Stellar activity manifesting as spectral-shape variability can obscure orbital signals. Conversely, the binary nature of most Cepheids makes the detection of additional pulsations more difficult. By using semi-partial distance correlation between the phases, the spectral shapes, and the RVs, the influence of one variability over the other can be controlled.
Let us assume we have three time series of measured values x, y and z each drawn from a joint distribution of random variables X, Y and Z that cannot be assumed to be independent. Then the Pearson correlation coefficient between x and y controlled from the influence of z on both of the first two variables is called the partial correlation. Practically, this means separately fitting two linear relationships: one between x and z and one between y and z. The partial correlation coefficient then corresponds to the correlation coefficient computed between the residual of these fits. Conversely, semi-partial correlation considers the effect of z on only one of the other two variables, x or y. The semi-partial distance correlation coefficients then play the same role as the Fourier power in a Fourier-based periodogram. A higher coefficient suggests a stronger signal at the corresponding frequency.
To construct the shape periodograms used in the following, we compute the semi-partial distance correlation coefficients between the phases computed for a grid of test frequencies and the spectral shapes controlled from the influence of the RVs (‘shape’ power) by shifting the spectra to a common mean velocity. Conversely, the shift periodogram is constructed by computing the semi-partial distance correlation coefficients with the spectral shapes as a nuisance variable. Although both periodograms are computed in the process, we do not show the shift periodogram as its use is confined to the detection of orbital signals and we are only interested in detecting additional stellar-activity related pulsation modes.
We compute for each of the four stars five different shape periodograms using the spectral inputs described above:
-
C periodograms based on the CCF profiles,
-
g periodograms based on the Gaussian fits,
-
 periodograms based on the median-residual CCF profiles,
 -
Cg periodograms based on the Gaussian-residual CCF profiles,
-
S periodograms based on the normalised spectra.
The five different shape periodograms are computed for each star with a frequency range spanning up to the Nyquist frequency defined as the median of separations between the observations. We note that g periodograms are insensitive to line asymmetry by definition.  periodograms are sensitive to variations from the median CCF profile. Finally, Cg periodograms may be particularly sensitive to line asymmetry.
The significance levels of each periodogram are defined by false-alarm levels (FAL) corresponding to probabilities of 0.1, 0.01, and 0.001. The levels are calculated using the permutation procedure (bootstrap) described in Sect. 2.2 of Binnenfeld et al. (2020). Peaks with false-alarm probabilities (FAP) < 0.001 and no other signal within ten times the periodogram’s sampling are considered significant. The distinction between true frequencies and aliases is made following Sect. 7.2 of VanderPlas (2018). Following Gregory (2001) and Ivezić et al. (2014), the uncertainty on the peak’s frequency σf is defined by its width with a first-order dependence on the number of samples N and their average S/N, Σ,
 (2)
(2)
where f1/2 ≈ 1/T, with T the baseline, is the half-width at half-maximum.
3. Results
This section is divided into two parts: Section 3.1 describes the results individually for each star and Sect. 3.2 presents an overview of the results. Depending on the context, we either discuss periods (P) or frequencies (f). For each star, a specific index is attributed to a given detected signal to facilitate its identification, e.g. fFU = 1/PFU corresponds to fundamental mode (FU), and fX = 1/PX to the dominant additional mode detected. We note that our sample does not contain any classical multi-mode (beat) Cepheids, so the nature of any additional modes is not a priori known. For harmonics and subharmonics, our terminology is the following: n ⋅ f is called the n-th harmonic and f/n the n-th subharmonic for a given frequency f.
3.1. Individual stars
We present the periodograms for the four stars in Figs. 4, 5, 6, and 7. Tables 2, 3, 4, and 5 list the detected main pulsation signal, the additional signals, their (sub)harmonics, and signals that are combinations of the main pulsation signal and an additional signal. Aliases of these signals with the window function are listed in Table A.1.
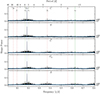 |
Fig. 4. Shape periodograms for δ Cep. Rows correspond to: CCF profiles, their Gaussian fits, median-residual CCFs, Gaussian-residual CCFs, and normalised spectra. Significant peaks are marked with vertical lines: blue (radial pulsations and additional signals, fFU for the fundamental mode, f1O for the first overtone, and fX for others), red (harmonics, subharmonics, and combination signals; fi, i = 0, 1, 2, …), and green (aliases; ai, i = 0, 1, 2, …). Blue horizontal lines indicate FAL probabilities of p = 0.1, 0.01, and 0.001 (bottom to top). |
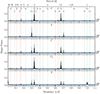 |
Fig. 5. Same as Fig. 4 but for BG Cru. The additional signal fX is probably linked to line splitting. |
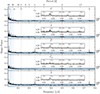 |
Fig. 7. Same as Fig. 4 but for Polaris. We note the increase of the power baseline for small frequencies. |
Frequencies detected using shape periodograms for δ Cep.
Frequencies detected using shape periodograms for BG Cru.
Frequencies detected using shape periodograms for X Sgr.
Frequencies detected using shape periodograms for Polaris.
3.1.1. δ Cephei
δ Cep is used as a control star for which we do not expect to detect additional frequencies beyond the main radial mode. For this star, we detect the fundamental radial pulsation frequency (fFU in Table 4) as the most significant signal in all periodograms without exception. It is accompanied respectively by its second and third harmonics (f2 and f3) and subharmonics (f1 and f0). The second harmonic and subharmonic are significant in all periodograms, while the third ones stand out specifically in the C and g periodograms. Additionally, the third subharmonic is also significant in the  periodogram. The appearance of harmonics and, more importantly, subharmonics is discussed in Sect. 4.1.2. Three aliases are detected and listed in Table A.1: a0, a1, and a2. The first two are combinations of the fundamental mode frequency, fFU, with the second most prominent peak in the window power of δ Cep’s time series at a period of 63.89 d. The third alias is a combination of the 1 d window signal with f2. Evidentially, the line shape variability is sufficient to allow detection of the radial mode using all data sets and the shape periodograms. In particular, the g data set also detects line shape variations because the parameters of the Gaussian fit react to significant changes in line asymmetry through the FWHM and the contrast. It is important to note that the line shape variability due to the radial mode is most pronounced in δ Cep compared to all other stars in the sample (Fig. 3).
3.1.2. BG Crucis
BG Crucis is a first-overtone Cepheid that exhibits a small degree of line splitting (Kovtyukh et al. 2003; Anderson 2013). The known radial mode (f1O) associated with BG Cru’s photometric and RV variability is detected in all periodograms but Cg and it dominates in g. f1O is strongly suppressed in C and yields the second strongest peak in  and S. The S data set, contrary to CCF-based ones, shows an increase in low frequencies. This increase is aliased with the 1 d window signal thus showing a cluster of peaks around 1 d−1 significantly above the threshold level. A second cluster, at 0.5 d−1, is also significant. We attribute it to the subharmonic of the 1 d−1 aliased low frequencies. The sharp power reductions at exactly 1 d−1 and 0.5 d−1 support this interpretation. The g data set shows marginal signal split around 0.5 d−1 with the peaks being aliases of each other, similarly to N24 who finds a 2.03 d signal based on FWHM and contrast. N24 attributes it to a non-radial mode of degree l = 7 given the period ratio of 0.61 with the main radial mode and according to Dziembowski (2016). Similarly, we find a value of 2.03 d for the most significant peak between the two. This signal is absent in the CCF-based periodograms. This suggests that the correlation between FWHM and contrast might complicate the analysis when the full line profile is not analysed. Additionally, the presence of the low-frequency subharmonics around that frequency in the S periodogram makes it difficult to determine whether the 2.03 d signal detected in N24 is indeed present in that data set.
Interestingly, BG Cru exhibits a very strong additional signal at a period of PX ∼ 3.01 d. This additional signal dominates over the main radial mode in the asymmetry-sensitive periodograms based on CCFs (C,  , and Cg), whereas it is nearly of equal power as the radial mode in the S periodogram and fully suppressed in the g periodogram. N24 recently identified PX using Fourier analysis of time series of RV, FWHM, and BIS data, although the signal was not detected in the contrast. In N25, this signal was identified using a ‘hump’ analysis of the split CCFs. In that approach, the hump formed between the two components of the line relative to the mean RV of the CCF is traced. The RV of the hump is then determined for each CCF profile and a time series of hump RVs is constructed and then analysed using standard time series analysis techniques. In the hump analysis of BG Cru’s CCFs in N25, the 3 d signal appears as the highest-amplitude one. Consequently, it is assumed to be connected to the hump and thus to the line splitting.
Moskalik & Kołaczkowski (2009a,b) and subsequently Kotysz & Smolec (2018) found evidence for non-radial oscillations in a significant fraction, approximately 9%, of the first overtone Cepheids of the Large Magellanic Cloud present in the OGLE data sets. They observe that the secondary periodicities detected are located in 88% of the cases close to the primary (radial) frequency and that the amplitude ratio AX/A1O never exceeds 0.1. Moreover, in 84% of these cases, the secondary peak has a lower frequency than the primary one. They argue that, given the frequency patterns observed and the period ratios induced, these secondary periodicities must be non-radial oscillations. Similarly, in our data sets of BG Cru, fX is close to the main radial mode with Δf ≈ 0.033. However, it appears right to it. Moreover, the amplitude ratios in the different data sets are ranged between 0.95 and 7. This difference can however be understood to be caused by the different methods used. The period ratio between PX/P1O ≈ 0.90 currently lacks a theoretical explanation in terms of a non-radial mode. However, the fact that it is not in phase with P1O (see Fig. 1) excludes a range of other physical origins such as shock or circumstellar environments (cf. Usenko et al. 2014). Given the concordance of the periodicity between the hump analysis and the different periodograms, Fourier or distance correlation-based, the link between line splitting and this signal is very likely. Kovtyukh et al. (2003) tentatively attributed this line splitting (referred to as ‘bumps’ and ‘asymmetries’ in their text) to non-radial oscillations, potentially linked to resonances between radial modes in Cepheids pulsating with periods close to 3.2 d (see Antonello et al. 1990 for a description). Although the period of this additional signal is suspiciously close to 3 d, it is unlikely that it originates from a combination with the window function. The signal, which dominates four out of five periodograms, is also detected in the pre-2014 Coralie data set with different sampling, and is identified in N25’s hump analysis as well.
We note that harmonics of the main radial pulsation f1O are almost completely absent from the list of significant signals. The only detected harmonic, f6, is barely identified in the g periodogram and not in the others. On the other hand, several subharmonics of f1O and fX are significant. We detect above the threshold level the second subharmonics of f1O and fX (f3 and f4) and the third and fourth subharmonics of fX (f2, f1). f0 can be interpreted as either a tenth subharmonic or as a combination frequency of fX − f1O. We find the former explanation unlikely although the absolute value of f0 is closer to a tenth harmonic than fX − f1O is (an absolute difference of 6.75 ⋅ 10−6 compared to 3.33 ⋅ 10−2, respectively).
We also detected signals (f5 and f7) that are combinations of the main radial mode, the additional frequency fX, and their (sub)harmonics. The presence of such combinations naturally appears in the frequency spectra if the S/N is high enough and the phase sampling dense (Netzel & Kolenberg 2021). The presence of unwanted subharmonics is discussed in Sect. 4.1.2.
3.1.3. X Sagittarii
X Sgr is a fundamental mode pulsator exhibiting strong line splitting (Kovtyukh et al. 2003; Mathias et al. 2006; Anderson 2013). Line shape periodograms detected the main radial mode at a period of PFU ∼ 7.01 d using the full spectra (S), the Gaussian fits, and the  data sets. The full CCFs (C) do not yield a significant detection of this signal and there is no power in the CCFs once the Gaussian fit is subtracted (Cg). Hence, line shape variations due to the radial mode fFU are subdominant compared to line shaping effects occurring at other frequencies. Subtracting the median CCF to construct the
  data set enhances the shape variability stemming from the radial mode, which also significantly alters the depth and width of line profiles across the pulsation cycle. However, subtracting the Gaussian fits, which account for changes in line depth and width, from the CCFs (Cg) leaves the radial mode undetected in the shape periodograms.
Apart from the main radial mode, we detected three significant signals at fX = 0.081 d−1, f1 = 0.22 d−1, and f2 = 0.37 d−1. Notably, f1 is the most dominant signal across all data sets but the g one. However, based on the hump analysis of N25, which interprets fX as the periodicity caused by the underlying phenomenon, we consider it an independent periodicity. Under this interpretation, f1 and f2 are combination frequencies, with f1 satisfying f1 = fFU + fX. Interestingly, f1 exhibits a larger amplitude in the periodogram than its parent frequencies, one of which is a radial mode. This appears to contradict the findings of Balona et al. (2013) and Benkő & Kovács (2023), who, based on Fourier analysis, concluded that combination frequencies should not exceed their parent frequencies in amplitude when one of the parent is a radial mode. However, since shape periodograms are not Fourier-based, this constraint does not necessarily apply, leaving open the possibility that a combination frequency of a radial mode could surpass its parent in amplitude. Further investigation into the method itself is required to resolve this question.
Alternative interpretations remain plausible. In particular, N25’s ‘interpretation B’ suggests that f2 is the independent frequency. However, f2 appears only mildly significant in the  data set solely. Given these uncertainties, we remain agnostic about which frequency is the primary driver of the observed variability. Nevertheless, we attribute fX to the noticeable line-splitting pattern, as it was identified through an analysis that traced the ‘hump’ between the main split components after subtracting an average line profile in N25. As is the case in BG Cru, we can exclude pulsation-induced shock waves as the origin of the line splitting pattern because it does not occur on the timescale of the main radial mode PFU, cf. Figs. 1 and 3 of N25.
f1 and its combined nature with fFU and fX was previously detected by N25 together with its subharmonic (f0) and with the fundamental mode using standard Fourier analysis of the RV, BIS and FWHM curves of the same observations used here. However, f1 (and f0) was also detected independently by Smolec et al. (2018) using photometric observations from the BRITE satellites based on a total of 16 pulsation cycles (∼112 d) in 2017. As noted by N25, the ratio of f1/fFU would place X Sgr on a long-period extension of the so-called 0.61 Cepheids in a Petersen diagram (cf. top panel on Fig. 7 of Netzel et al. 2025). However, all previously reported 0.61 Cepheids are first overtone pulsators, whereas X Sgr’s RV curve is typical of a fundamental mode pulsator (e.g. Fig. 8 of N25). Furthermore, if the hypothesis behind 0.61 Cepheids holds, that is they are the consequence of non-radial modes (Dziembowski 2016), then one would expect to find a different period ratio in the case of fundamental pulsators. Hence, despite the high amplitude of f1 in the shape periodograms, and its previous photometric detection, we consider it unlikely for this frequency to represent a separate independent non-radial mode as described in Dziembowski (2016).
3.1.4. Polaris
Polaris is a first overtone, low-amplitude Cepheid pulsating with a period of ∼4 days, which is furthermore part of a triple system (Evans et al. 2024). As the nearest and brightest Cepheid, it has been intensely studied for a long time and offers many conundrums. Given its rapidly evolving photometric pulsation period, it is often considered a good candidate for a Cepheid on the first crossing of the instability strip, i.e. before core helium burning sets in (e.g. Anderson 2018a, but it is important to note the updated mass in Evans et al. 2024). Polaris has also exhibited long-term amplitude variations in the past that seemed to have disappeared for several years in the 2010s (Arellano Ferro 1983; Dinshaw et al. 1989; Fernie et al. 1993; Bruntt et al. 2008; Anderson 2019).
Of particular interest for this work are previously reported additional signals in the low-frequency regime (P ≳ 20 d). Specifically, a period of ∼120 d has been reported by Lee et al. (2008) and proposed as a rotation period. Other signals at ∼34.3 d (Kamper & Fernie 1998), ∼40 d (Hatzes & Cochran 2000; Anderson 2019), ∼45.3 d (Dinshaw et al. 1989), and ∼60 d (Anderson 2019) have been reported. Bruntt et al. (2008), using observations from the star tracker on the WIRE satellite, concluded that additional periodicities reported by Dinshaw et al. (1989) and Hatzes & Cochran (2000) were likely spurious and argued for evidence of granulation on a timescale of 2–6 d based on a global power increase towards low frequencies.
Here, our observations have the advantage of being part of a long-term, almost uninterrupted, data sequence that spans multiples of 120 d. We detected the first overtone pulsation in the  and S data sets. In the C, g and Cg data sets, the first overtone frequency is undetected.
The radial mode is detected in  , but not from the CCFs themselves (C). Hence, any line shape variations associated with the radial mode are subdominant compared to other line shaping effects. However, the
  data set does lead to a detection of the radial mode since the subtraction of the median line profile enhances the signature of line profile variations, notably variations in depth and width of the lines.
We detected multiple additional signals in the low-frequency regime, from most to least significant, at 59.86 d (PX2), 27.12 d (PX6), 119.80 d (PX1 = 2.00 ⋅ PX2), 37.86 d (PX4), 33.48 d (PX5), and 48.09 d (PX3), all of which exceeded the 0.001 false-alarm level in the periodograms of all data sets. The sole exceptions are PX1, which is absent in the Cg data set, and PX3, absent in the  one. We note that an increase in the baseline power of the periodogram towards longer periods (≳ 20 d) renders the estimation of peak significance more complex. This low-frequency power increase is present in all stars in our data set, although it is most noticeable in Polaris and BG Cru, cf. Sect. 4.1.2. To more conservatively assess the significance of the peaks at P ≳ 20 d in Polaris, we computed each peak’s S/N relative to the immediate surroundings. The S/N was calculated using a box of 150 samples centred on the peak but excluding it. The box width and position were manually chosen to ensure a reliable noise estimate, and the S/N threshold for significant detection was set to 4.0.
Using this new criterion, we find that only one of the additional signals, PX2 (the highest amplitude peak), remains significant. Specifically, it passes the 4σ threshold for shape periodograms computed using the g (S/N = 4.13) and  (S/N = 4.75) data set and remains marginally detected in the C (S/N = 3.45) and S (S/N = 3.46) data sets, whereas the Cg data set yields a low S/N = 2.45. We note that Anderson (2019) had previously reported a similar frequency as dominant in the BIS parameter, although data gaps prevented a clearer identification at the time. The data set analysed here is not subject to such data gaps. The sampling presents a gap of two years between BJD 2458546–2459321 but otherwise was mostly uninterrupted in the BJD 2459321–2460381 period. Additionally, we note that Lee et al. (2008) had previously reported a signal at twice the period of PX2 (our PX6 = 119.8 d) based on RV measurements and considered this signal to be incoherent and possibly related to surface features, such as spots. However, the amplitude of the line shape periodograms suggest that the dominant period is indeed PX2. The recent detection of magnetic fields on Polaris (Barron et al. 2022) and other Cepheids (Barron et al. 2024) leads to the exciting possibility that a rotation period could be measured using magnetic maps based on spectropolarimetric observations, which may help to ascertain both the physical origin of the ∼60 d signal, or whether it is truly a 120 d signal.
We did not detect the ∼40 d signal reported by Hatzes & Cochran (2000) and Anderson (2019) using the data set presented in Table 1 although it is present in BIS (H. Netzel, private communication). It is however detected with this method in an independent smaller (161 observations) VELOCE data set spanning BJD 2455817–2458443 which barely overlaps with the current one (22 observations). Moreover, several possible additional signals appeared below the S/N cutoff in the range of 27–48 d. This echoes reports of rather different similar periods that were generally considered non-coherent and thus potentially variable in time: 45.3 d (Dinshaw et al. 1989), 34–45 d (Lee et al. 2008), 34 d (Hatzes & Cochran 2000, using Kamper & Fernie 1998 data), 40.2 d (Hatzes & Cochran 2000). However, the repeated appearance of the 40.2 d signal over the course of a few decades deserves attention and long-term monitoring, as does the persistence of the 60 d signal.
3.2. Overview of results
The previous Section (3.1) lists the results obtained per star. The sample of four stars exhibited quite different signals, on different timescales, and with different detections across the board. To assess the detectability of additional signals in spectroscopic time series observations of Cepheids using the (shape) semi-partial distance correlation periodograms, we seek here to provide an overview of our results, in particular by discussing the results as a function of which modes were detected, as well as differences between the data sets. Table 6 provides an overview of our results for the four stars. It lists the primary radial frequency (fr), the frequency of the dominant additional signal (fX) detected, if any, and a short, pictographic overview of which data set yielded a significant and/or dominant detection.
Overview of mode detections per data set.
The photometrically dominant radial modes were detected using different data sets for different Cepheids, and for different reasons. In δ Cep, the detection of the radial mode based on all data sets was especially clear. We attribute this detection to the variation in equivalent width (EW) along the pulsation cycle. This would also explain why the symmetric Gaussian fits allow the detection of fr. Small period fluctuations could further contribute to this detection as they are common in Cepheids and have been noted in the paper that first reported the presence of a spectroscopic companion (Anderson et al. 2015). As expected, δ Cep did not exhibit any additional pulsation signals. We note that the shape periodograms are not sensitive to the known orbital period of 3451 d (Shetye et al. 2024) by design.
The radial mode was also detected in both line-splitting Cepheids in the sample, BG Cru and X Sgr, albeit using different data sets and likely because of the differing degrees of line splitting. Whereas the CCF profiles allowed for a weak detection of fr in BG Cru, the analogous signal did not exceed the threshold FAP in X Sgr, despite being visibly present in Fig. 6.
In both stars, fr was the dominant feature based on the Gaussian fits, as expected since the fits will vary in FWHM and depth to accommodate the changes in EW. The combination frequency f1 = fFU + fX dominated in the shape periodograms of the three remaining data sets of X Sgr. The radial modes were detected in  for BG Cru and X Sgr, as this data set enhances line shape variations by construction. However, other signals dominated in these data sets (see below). Conversely, fr was not detected in these two stars after subtracting the Gaussian fits (Cg), whereas it was detected using the full optical spectra.
The radial mode was detected in Polaris based only on the  and S data sets. We attribute this to the rather symmetric line profiles of this low-amplitude pulsator, which does not significantly vary its EW across the pulsation cycle. As a result, the C, Cg and g data sets yielded null detections for fr. As expected from the analysis on the three other stars, subtraction of the median CCF in the
  data set enhances the line shape variability due to the radial mode in Polaris. The full spectrum showed a very clean detection of fr as well as its main aliases and (sub)harmonics at fr/2 and 2fr.
Additional signals were detected by shape periodograms for BG Cru, X Sgr, and Polaris at timescales where they had been reported previously, albeit with some interesting differences among each other and with the literature. Importantly, the additional signals tend to dominate the shape periodograms based on CCFs when such signals are present.
We note that the three significant additional frequencies (fX for BG Cru and X Sgr; fX2 Polaris) reported are very different from one another, despite rather similar observational strategies employed for the three stars, which included nightly monitoring over at least two weeks at a time as well as entire seasons. Furthermore, the frequency ratios of fr/fX are very different in each star and range from < 1 to ≫1. Last, but not least, the additional signals were also detected using the full optical spectra (S). In BG Cru and Polaris, the amplitude of fX was similar to fr. In X Sgr, the largest amplitude was found for the combination frequency f1, followed by fr and fX.
To summarise the behaviour of the data sets, CCFs (C) are highly useful to detect additional signals based on spectroscopic observations and yield enhanced amplitudes at these interesting frequencies compared to the full optical spectra. This is likely a consequence of the increased S/N of CCFs compared to the restricted spectral range we’ve used, as well as a virtue of CCFs being free of several complicating factors, such as telluric or ISM lines, as well as time variable spectral envelopes. Fitted Gaussians (g) can detect signals that change the EW of the fit, and this was only the case in Polaris.  emphasises the line asymmetry and thereby enhances the radial mode signal. However, in the
  data sets, additional signals generally still dominate the shape periodograms, and yield similar amplitudes as the original CCFs for the additional signals. The full optical spectra (S) allowed detection of both the radial mode and the additional signals with typically similar amplitude, although the radial mode was slightly stronger in BG Cru and Polaris and noticeably weaker or stronger in X Sgr compared to f1 and fX, respectively.
4. Discussion
This section is divided into two parts. In the first one, we assess the performance of these new periodograms on our data in comparison with past results that used different methods. Then, we discuss the nature of the additional signals detected.
4.1. Performance of the shape periodograms
This subsection is divided into two parts. In Sect. 4.1.1, we compare our method and results with previous ones. In Sect. 4.1.2, we discuss more specifically the presence of sub(harmonics) and low-frequency power increase in some of our data sets.
4.1.1. Comparison with different methods
We considered two main types of spectrosopic data: normalised 1D merged spectra and CCFs, as well as variations of CCFs. Concerning spectra, one of us (K. Barbey, EPFL Master thesis 2024) extensively investigated the impact of the selected wavelength regions and ranges, as well as spectrum normalisation techniques and other systematics of relevance. Notes on these issues are provided in Appendix B. CCFs were included in the analysis to benefit from enhanced S/N and because CCFs isolate the lines of interest from several factors present in real observed spectra that could negatively impact the periodicity search, including the shape of the continuum, telluric and ISM lines, contamination from the simultaneous ThAr or Fabry-Pérot wavelength reference, and lower S/N per resolution element. Nevertheless, normalised spectra nonetheless carry a great deal of information and may have some advantages over CCFs, such as the absence of the weighting that is introduced by the correlation template. Interestingly, we found that both CCF-based line profiles and the normalised spectra allowed to faithfully recover the additional signals. However, the amplitude of the additional signals was strongly boosted for CCF-based data sets compared to the full spectra, whereas the radial modes were usually strongly suppressed in the CCF-based data sets. We therefore expect that CCF-based data sets will be particularly suitable for fainter stars compared to these four naked-eye stars. In particular, the  data set appears to be promising, as it boosts the main signal by emphasising the line asymmetry variability due to the radial mode. Distinguishing the radial mode from other signals is usually straightforward when photometric light curves are available, such as from the ESA Gaia mission (Gaia Collaboration 2016, 2023; Eyer et al. 2023; Ripepi et al. 2023).
A significant advantage of the present analysis over the analysis of individual CCF parameters, such as the depth, FWHM, and BIS (cf. Fig. 1 in Anderson 2016), is that it does not consider correlated quantities as independent variables. Nevertheless, an advantage of CCF parameters is that they can be calculated with good precision even from low S/N spectra. However, certain difficulties have arisen in their use, such as the detection of frequencies for only specific parameters (instead of all).
Additional signals dominate in the shape periodograms. By comparison, a classical Fourier analysis of line shape parameters, such as BIS (N25) identified these signals at lower S/N, and required pre-whitening by the radial mode for BG Cru. The separation into shape and shift periodograms in SPARTA performs an analogous operation for the radial modes, although they remain detectable in some cases. Indeed, the shift periodograms2 for our four stars and for all data sets show significant residual peaks at the main pulsation frequency, contrary to the periodograms presented for S Mus and β Dor in B22. These residual peaks were less pronounced in S data sets of fundamental-mode pulsators (X Sgr, δ Cep and see K. Barbey, EPFL Master thesis 2024)) than in first-overtone Cepheids, which are known to present long-term amplitude and frequency modulations of their main pulsation (Evans et al. 2014; Anderson 2014, 2018b; Süveges & Anderson 2018b). Hence, the residual peaks may arise due to the instability of the radial pulsation period. Moreover, Gaussian-fitted RVs are biased with respect to the barycentric velocity of the star. We argue that these two reasons are probable causes of the presence of the residual peak. Indeed, the shape metric (Eq. (14) in B22) in the algorithm is calculated after the spectra are shifted according to their respective RV. Under the assumption that the Doppler shift and the line shape deformation are strongly associated in the case of a Cepheid’s radial pulsation, the main pulsation frequency should not appear in the shift periodogram. Both causes could produce this residual signal.
4.1.2. On (sub)harmonics and the low-frequency power increase
Figures 5 (bottom panel) and 7 show a trend where the semi-partial distance correlation power increases at low frequencies. We attribute this trend to correlated noise, where consecutive measurements are more likely to deviate from the signal’s expected value in the same direction. This correlated noise affects the periodogram through the folding process: at sufficiently low frequencies, the folding procedure aligns neighbouring points in neighbouring phases. Since the noise is correlated, these measurements are not statistically independent, resulting in an increased distance correlation score. This is the case for all periodograms of the phase distance correlation ‘family’. A similar effect was noted in previous work (e.g. B22).
Pulsation patterns that are not strictly sinusoidal produce harmonics in their periodograms. This is a well-known effect in many methods, including classical Fourier analysis. Similarly, phase distance correlation-based periodograms can exhibit significant peaks at both the harmonics and subharmonics of the detected signal. This behaviour can be understood in light of the phase-folding characteristics discussed in the previous paragraph. Statistical dependence between points in neighbouring phases of the true periodicity is likely to induce similar dependence in the corresponding phases of a harmonic or subharmonic of the true periodicity. This is conceptually similar to the patterns observed in the ‘box least squares’ periodogram (Kovács et al. 2002). Subharmonic features tend to accompany the highest amplitude peak in the periodogram – whether that peak corresponds to the primary radial mode, an additional frequency, or a combination frequency. This behaviour is observed, for example, in BG Cru and Polaris, where our periodograms reveal fractional frequencies (e.g. near 0.5f, and in some cases additional fractions). In contrast, true harmonics (i.e. integer multiples of the primary frequency) appear predominantly for the radial modes. Our method, by directly probing line shape variations, appears to accentuate these artefact subharmonics. Phase folding perspective further suggests that while the harmonics are phase-coherent and linked to the underlying radial mode, the subharmonics lack such coherence, which can indicate their non-physical origin in at least some cases. We acknowledge that when only a 0.5f signal is detected (as in some cases), alternative explanations cannot be entirely ruled out. We emphasise that further investigation is needed to definitively disentangle the effects involved. While our method’s sensitivity to line shape variations is useful for such tasks, fully characterising the signals requires additional analysis and careful consideration of periodogram artefacts.
4.2. On the nature of the additional signals
This subsection is divided into three parts. In the first one, we discuss the low-frequency increases in power in Polaris’ data sets. In the second part, we review Polaris’ long-period signals. Finally, in the third part, we discuss the signals apparently linked to line splitting in BG Cru and X Sgr.
4.2.1. Low-frequency increase in power
Several of our periodograms exhibited small power increases towards low frequencies, and these may be (partially) explained by the properties of phase folding partial correlations (Sect. 4.1.2). Polaris exhibited the strongest such signal at P ≳ 20 d (f ≲ 0.05 d−1 ≈ 0.6 μHz). If interpreted as a real signal, then a global low-frequency power increase could be related to granulation noise. However, two studies that previously investigated such effects reported very different (and similar) timescales. Derekas et al. (2017) analysed the nearly uninterrupted high-precision 4-year-long light curve of V1154 Cygni collected by the Kepler spacecraft and reported a detection of granulation noise on an effective timescale of 3.5 ± 0.5 d, noting that this timescale agreed rather well with expectations based on the scaled properties of red giant stars. Bruntt et al. (2008) detected a power increase at low frequencies for Polaris on a timescale of 2–6 d using observations of the star tracker on the WIRE satellite collected during three week-long runs at high cadence. This timescale was considered an (intriguingly) good fit to a Solar granulation signal scaled to the properties of a Cepheid. Since a single pixel of the WIRE star tracker subtends one minute of arc on the sky (Buzasi 2002), Polaris’ known companions (Evans et al. 2024), Aa (at < 0.1″) and B (8th mag, at 18″), could have influenced the WIRE star tracker photometry at the mmag level. Our data set spanning 290 observations over 6 yr would suggest a significantly slower timescale, which would result in poorer agreement with the aforementioned scalings based on the Sun or red giants. Further high-cadence and long-term monitoring would be needed to settle this conundrum. For the time being, we consider the power increase to most likely be an artefact of the periodograms used here.
4.2.2. Long-period signals
Polaris was the only Cepheid that credibly exhibited line shape signals at periods much longer than the radial mode. Several promising signals were initially identified, but only a single signal at 59.86 d passed the local S/N threshold for detection after taking into account the rise in power at low frequencies. This signal was previously identified in Anderson (2019) based on a data set collected with the same spectrograph, yet with minimal overlap in data. It is accompanied by a subharmonic at 119 d, which was previously detected using RV data by Lee et al. (2008). Interestingly, another signal at 40.2 d identified by both Hatzes & Cochran (2000) and Anderson (2019) was not recovered here, as was the case by other previous studies (e.g. Bruntt et al. 2008; Lee et al. 2008). As previously reported by Dinshaw et al. (1989), this signal may be not coherent and could vary in time. Several not-quite-significant signals found in our data set suggest that such non-coherent signals are present on timescales of 27–48 d. Longer-term monitoring may be required to ascertain whether the ∼60 d signal persists, or whether it, too, changes or vanishes with time. However, an interesting possible explanation for this signal could be related to rotation, since Polaris has been shown to exhibit both spots (Evans et al. 2024) and surface magnetic field (Barron et al. 2022). Polaris’ small temperature variations may facilitate the formation of more substantial and long-lived spots, which may help explain why analogous signals have not yet been found in other Cepheids.
4.2.3. Line splitting signals
The visually striking line splitting signals of X Sgr and BG Cru, cf. Fig. 1, have been shown to vary on a different timescale than the main radial mode (Anderson 2013; Netzel et al. 2025). In both stars, strong additional signals are present, and we have identified the frequencies  and
and  as their independent additional signals, respectively. In BG Cru, fX dominated the shape periodograms, whereas the combination frequency f1 = fFU + fX = 0.2238 d−1 dominates in X Sgr. Conversely, BG Cru’s analogous combination frequency f7 = f1O + fX = 0.6316 d−1 was found in all but the Gaussian fits data set, that is where only the radial mode is significant. The frequency ratios relative to the main radial mode in both stars is fr/fX = 0.900 in BG Cru, and 1.756 = 1/0.569 in X Sgr (1.570 = 1/0.637 if f1 is used instead of fX); hence, this ratio is 1.951 times larger in BG Cru than in X Sgr. Thus, it is rather unlikely that fX is related to fr, and we consider it a separate and independent signal.
Further considerations concerning the origins of the line splitting feature are provided in N25, which targeted specifically classical Cepheids that exhibited resolved or unresolved line splitting. Suffice it here to say that several physical origins, such as shocks or circumstellar envelopes, can be excluded by the fact that the splitting pattern does not phase according to the radial mode.
Non-radial pulsations may provide a viable alternative explanation, as they are known to distort and reshape spectral lines in complex ways. Additionally, several first-overtone Cepheids have been found (see Fig. 5 in Netzel et al. 2024) to exhibit signals that fit an interpretation as non-radial modes of degrees l = 7, 8 or 9 as predicted by Dziembowski (2016). In these cases, the period ratio, comprised between 0.60–0.64, is computed with the second harmonic of the suspected non-radial mode (Smolec et al. 2023). The harmonic is however not necessarily always detected, complicating the interpretation. Netzel & Kolenberg (2021) have shown that the detection of such signals was theoretically possible in spectroscopic time series. However, the period ratios in BG Cru and X Sgr do not yield such a ratio. The closest case is X Sgr, where the combination frequency f1 – which dominates the periodogram for most data sets – yields a period ratio of 0.637 with the radial mode. However, this picture does not match the model by Dziembowski (2016), which requires a harmonic of the non-radial mode to form this period ratio. Additionally, the light and RV curves identify X Sgr as a fundamental mode Cepheid, whereas the theory’s predictions and prior detections apply to overtone and double-mode Cepheids that exhibit the first overtone. For our overtone Cepheid, BG Cru, the Gaussian fits revealed a comparatively weak frequency f ≈ 1/2.03 d−1, which forms a ratio of 0.606 with the radial mode similar to N24. It is however under our threshold of a p = 0.001 false-alarm probability but above p = 0.01. We note its presence but do not consider it significant. Moreover, it is completely absent from the other data sets. We are not aware of any theoretical models that satisfactorily explain the observed period ratios in terms of non-radial pulsations. However, the additional signals might also be interpreted as a non-radial oscillation connected to resonances between the different radial modes (Moskalik et al. 1992; Antonello 1994; Kovtyukh et al. 2003; Smolec & Moskalik 2010). Unfortunately, the interpretation of such signals is complicated by an incomplete theoretical understanding of the interactions between radial and non-radial oscillations in classical Cepheids. The correlation between line splitting and FWHM of the CCFs, indicating a possible link to rotation, is unlikely as discussed in Sect. 4.3 of N25.
In summary, the origin of these line splitting signals remains currently unknown, and we hope that the present study may usefully inspire additional theoretical work to explain these intriguing signals.
5. Summary and conclusions
Semi-partial distance correlation periodograms are a powerful tool for detecting additional pulsation modes in pulsating variable stars, including those of currently unknown nature. These periodograms, applied to normalised spectra, CCFs, and CCF-derived data sets such as the median-residual and Gaussian fit-residual CCFs, have proven effective in isolating frequencies accompanied by Doppler shifts. We consider the full profile analysis more robust, as earlier studies assumed independence among CCF shape parameters.
Our results show that additional signals dominate in shape periodograms. A comparison with classical Fourier analyses of line shape parameters, such as BIS, illustrates that these traditional methods identify signals at lower S/N and require pre-whitening by the radial mode for certain stars such as BG Cru.
For δ Cep, no additional modes were found, consistent with previous findings that fundamental mode Cepheids in this period range exhibit stable pulsation properties. However, for other stars in the sample, including X Sgr, BG Cru, and Polaris, additional signals were detected. In X Sgr, the parent mode remains unclear due to data gaps; while f1 consistently shows higher power, another mode, fX, has been identified through hump analysis presented in N25. Long-term uninterrupted monitoring is essential to resolve the periodicity of the line-splitting pattern in this star.
In BG Cru, we identified a signal linked to line splitting and another (marginally) at the expected frequency for 0.61 signals in first-overtone Cepheids, possibly indicating a non-radial mode. Intriguingly, the latter signal only appears in the Gaussian fit-based data set, suggesting that it might be the result of the Gaussian fitting process. This observation warrants further investigation.
Polaris presents evidence of signals in the 20–40 d period range, which appear non-coherent or non-stationary. A period of ∼59.86 d emerges as a strong candidate for a link with the star’s rotation period, potentially explaining recent detections of star spots and magnetic fields but requires further monitoring.
Median-subtracted CCFs ( ) emerge as particularly well-suited for detecting signals unrelated to pure Doppler shifts, even in low-amplitude pulsators. While full spectra also allow the detection of these signals, the power of the additional signals is typically higher in
  data sets. Nevertheless, the wavelength-merged spectra yield the highest power for main radial (photometric) modes and enable the detection of additional frequencies in all modulated stars analysed.
The ability to detect additional signals from CCF-based data sets significantly enhances the feasibility of such analyses on larger samples, overcoming the high S/N requirements of earlier methods. These observations, crucial for understanding Cepheid masses and line-broadening phenomena, call for further theoretical work. Such investigations could unlock an asteroseismic window for evolved intermediate-mass stars and the progenitors of neutron stars.
Data availability
The shape and shift periodogram data sets, and cross-correlation functions (CCFs) for all four stars are available in electronic form at the CDS via anonymous FTP to cdsarc.cds.unistra.fr (130.79.128.5) or via https://cdsarc.cds.unistra.fr/viz-bin/cat/J/A+A/698/A287. Reduced spectra are available upon request to the second author.
See Data availability.
Acknowledgments
The authors thank the anonymous referee for their comments, which helped improve the quality of the manuscript. We acknowledge all observers who contributed to collecting the VELOCE data set. We also acknowledge useful comments and discussions with Saniya Khan, Michaël Cretignier, Ludovic Rais, Gauthier Leurent, Ethan Tregidga, Felix Vecchi and Salomon Guinchard. This work was supported by the European Research Council (ERC) under the European Union’s Horizon 2020 research and innovation programme (Grant Agreement No. 947660). RIA is funded by the SNSF through an Eccellenza Professorial Fellowship, grant number PCEFP2_194638. This work uses the publicly available SPARTA package written by A. Binnenfeld and S. Shahaf. A. Binnenfeld, S. Zucker, and S. Shahaf acknowledge support from the Israel Science Foundation (grant No. 1404/22) and the Israel Ministry of Science and Technology (grant No. 3-18143). The Euler telescope is funded by the Swiss National Science Foundation (SNSF). This research is based on observations made with the Mercator Telescope, operated on the island of La Palma by the Flemish Community, at the Spanish Observatorio del Roque de los Muchachos of the Instituto de Astrofísica de Canarias. HERMES is supported by the Fund for Scientific Research of Flanders (FWO), Belgium, the Research Council of K.U. Leuven, Belgium, the Fonds National de la Recherche Scientifique (F.R.S.-FNRS), Belgium, the Royal Observatory of Belgium, the Observatoire de Genève, Switzerland, and the Thüringer Landessternwarte, Tautenburg, Germany. HN acknowledges support from the European Research Council (ERC) under the European Union’s Horizon 2020 research and innovation program (grant agreement No. 951549 – UniverScale).
References
- Anderson, R. 2013, Ph.D. Thesis, University of Geneva, Observatoire de Sauverny, Switzerland [Google Scholar]
- Anderson, R. I. 2014, A&A, 566, L10 [NASA ADS] [CrossRef] [EDP Sciences] [Google Scholar]
- Anderson, R. I. 2016, MNRAS, 463, 1707 [NASA ADS] [CrossRef] [Google Scholar]
- Anderson, R. I. 2018a, A&A, 611, L7 [NASA ADS] [CrossRef] [EDP Sciences] [Google Scholar]
- Anderson, R. I. 2018b, in The RR Lyrae 2017 Conference. Revival of the Classical Pulsators: from Galactic Structure to Stellar Interior Diagnostics, eds. R. Smolec, K. Kinemuchi, & R. I. Anderson, 6, 193 [NASA ADS] [Google Scholar]
- Anderson, R. I. 2019, A&A, 623, A146 [NASA ADS] [CrossRef] [EDP Sciences] [Google Scholar]
- Anderson, R. I. 2020, in Stars and their Variability Observed from Space, eds. C. Neiner, W. W. Weiss, D. Baade, et al., 61 [Google Scholar]
- Anderson, R. I., Sahlmann, J., Holl, B., et al. 2015, ApJ, 804, 144 [CrossRef] [Google Scholar]
- Anderson, R. I., Saio, H., Ekström, S., Georgy, C., & Meynet, G. 2016a, A&A, 591, A8 [NASA ADS] [CrossRef] [EDP Sciences] [Google Scholar]
- Anderson, R. I., Mérand, A., Kervella, P., et al. 2016b, MNRAS, 455, 4231 [Google Scholar]
- Anderson, R. I., Viviani, G., Shetye, S. S., et al. 2024, A&A, 686, A177 [NASA ADS] [CrossRef] [EDP Sciences] [Google Scholar]
- Antonello, E. 1994, A&A, 291, 820 [NASA ADS] [Google Scholar]
- Antonello, E., Poretti, E., & Reduzzi, L. 1990, A&A, 236, 138 [NASA ADS] [Google Scholar]
- Arellano Ferro, A. 1983, ApJ, 274, 755 [Google Scholar]
- Balona, L. A., Catanzaro, G., Crause, L., et al. 2013, MNRAS, 432, 2808 [CrossRef] [Google Scholar]
- Baranne, A., Queloz, D., Mayor, M., et al. 1996, A&AS, 119, 373 [NASA ADS] [CrossRef] [EDP Sciences] [Google Scholar]
- Barron, J. A., Wade, G. A., Evans, N. R., Folsom, C. P., & Neilson, H. R. 2022, MNRAS, 512, 4021 [Google Scholar]
- Barron, J. A., Wade, G. A., Folsom, C. P., & Kochukhov, O. 2024, in IAU Symposium, eds. J. Mackey, J. S. Vink, & N. St-Louis, IAU Symposium, 361, 233 [Google Scholar]
- Benkő, J. M., & Kovács, G. B. 2023, A&A, 680, L6 [NASA ADS] [CrossRef] [EDP Sciences] [Google Scholar]
- Benkő, J. M., Plachy, E., Netzel, H., et al. 2023, MNRAS, 521, 443 [Google Scholar]
- Binnenfeld, A., Shahaf, S., & Zucker, S. 2020, A&A, 642, A146 [NASA ADS] [CrossRef] [EDP Sciences] [Google Scholar]
- Binnenfeld, A., Shahaf, S., Anderson, R. I., & Zucker, S. 2022, A&A, 659, A189 [NASA ADS] [CrossRef] [EDP Sciences] [Google Scholar]
- Bruntt, H., Evans, N. R., Stello, D., et al. 2008, ApJ, 683, 433 [Google Scholar]
- Buzasi, D. 2002, in IAU Colloq. 185: Radial and Nonradial Pulsationsn as Probes of Stellar Physics, eds. C. Aerts, T. R. Bedding, & J. Christensen-Dalsgaard, Astronomical Society of the Pacific Conference Series, 259, 616 [NASA ADS] [Google Scholar]
- Csörnyei, G., Szabados, L., Molnár, L., et al. 2022, MNRAS, 511, 2125 [CrossRef] [Google Scholar]
- Derekas, A., Plachy, E., Molnár, L., et al. 2017, MNRAS, 464, 1553 [NASA ADS] [CrossRef] [Google Scholar]
- Dinshaw, N., Matthews, J. M., Walker, G. A. H., & Hill, G. M. 1989, AJ, 98, 2249 [Google Scholar]
- Dziembowski, W. A. 2016, Commun. Konkoly Obs. Hung., 105, 23 [Google Scholar]
- Evans, N. R., Szabo, R., Szabados, L., et al. 2014, in American Astronomical Society Meeting Abstracts, 224, 219.06 [Google Scholar]
- Evans, N. R., Szabó, R., Derekas, A., et al. 2015, MNRAS, 446, 4008 [CrossRef] [Google Scholar]
- Evans, N. R., Schaefer, G. H., Gallenne, A., et al. 2024, ApJ, 971, 190 [NASA ADS] [CrossRef] [Google Scholar]
- Eyer, L., Audard, M., Holl, B., et al. 2023, A&A, 674, A13 [NASA ADS] [CrossRef] [EDP Sciences] [Google Scholar]
- Fernie, J. D., Kamper, K. W., & Seager, S. 1993, ApJ, 416, 820 [NASA ADS] [CrossRef] [Google Scholar]
- Gaia Collaboration (Prusti, T., et al.) 2016, A&A, 595, A1 [NASA ADS] [CrossRef] [EDP Sciences] [Google Scholar]
- Gaia Collaboration (Vallenari, A., et al.) 2023, A&A, 674, A1 [NASA ADS] [CrossRef] [EDP Sciences] [Google Scholar]
- Gregory, P. C. 2001, in Bayesian Inference and Maximum Entropy Methods in Science and Engineering, ed. A. Mohammad-Djafari (AIP), American Institute of Physics Conference Series, 568, 557 [Google Scholar]
- Gullikson, K., Dodson-Robinson, S., & Kraus, A. 2014, AJ, 148, 53 [NASA ADS] [CrossRef] [Google Scholar]
- Hatzes, A. P., & Cochran, W. D. 2000, AJ, 120, 979 [CrossRef] [Google Scholar]
- Ivezić, Ž., Connolly, A. J., VanderPlas, J. T., & Gray, A. 2014, Statistics, Data Mining, and Machine Learning in Astronomy: A Practical Python Guide for the Analysis of Survey Data (Princeton University Press) [Google Scholar]
- Kamper, K. W., & Fernie, J. D. 1998, AJ, 116, 936 [Google Scholar]
- Kausch, W., Noll, S., Smette, A., et al. 2014, in Astronomical Data Analysis Software and Systems XXIII, eds. N. Manset, & P. Forshay, Astronomical Society of the Pacific Conference Series, 485, 403 [Google Scholar]
- Kervella, P., Trahin, B., Bond, H. E., et al. 2017, A&A, 600, A127 [NASA ADS] [CrossRef] [EDP Sciences] [Google Scholar]
- Kotysz, K., & Smolec, R. 2018, in The RR Lyrae 2017 Conference. Revival of the Classical Pulsators: from Galactic Structure to Stellar Interior Diagnostics, eds. R. Smolec, K. Kinemuchi, & R. I. Anderson, 6, 304 [Google Scholar]
- Kovács, G., Zucker, S., & Mazeh, T. 2002, A&A, 391, 369 [Google Scholar]
- Kovtyukh, V. V., Andrievsky, S. M., Luck, R. E., & Gorlova, N. I. 2003, A&A, 401, 661 [NASA ADS] [CrossRef] [EDP Sciences] [Google Scholar]
- Lee, B.-C., Mkrtichian, D. E., Han, I., Park, M.-G., & Kim, K.-M. 2008, AJ, 135, 2240 [Google Scholar]
- Mathias, P., Gillet, D., Fokin, A. B., et al. 2006, A&A, 457, 575 [CrossRef] [EDP Sciences] [Google Scholar]
- Molnár, L., Szabados, L., Dukes, R. J., Jr., et al. 2013. Astron. Nachr., 334, 980 [Google Scholar]
- Moskalik, P., & Kołaczkowski, Z. 2009a, in EAS Publications Series, eds. M. Goupil, Z. Koláth, N. Nardetto, & P. Kervella, EAS Publications Series, 38, 83 [Google Scholar]
- Moskalik, P., & Kołaczkowski, Z. 2009b, MNRAS, 394, 1649 [Google Scholar]
- Moskalik, P., Buchler, J. R., & Marom, A. 1992, ApJ, 385, 685 [NASA ADS] [CrossRef] [Google Scholar]
- Netzel, H., & Kolenberg, K. 2021, MNRAS, 508, 3508 [CrossRef] [Google Scholar]
- Netzel, H., & Smolec, R. 2019, MNRAS, 487, 5584 [NASA ADS] [CrossRef] [Google Scholar]
- Netzel, H., Smolec, R., & Dziembowski, W. 2015a, MNRAS, 451, L25 [NASA ADS] [CrossRef] [Google Scholar]
- Netzel, H., Smolec, R., & Moskalik, P. 2015b, MNRAS, 447, 1173 [NASA ADS] [CrossRef] [Google Scholar]
- Netzel, H., Molnár, L., Plachy, E., & Benkő, J. M. 2023, A&A, 677, A177 [NASA ADS] [CrossRef] [EDP Sciences] [Google Scholar]
- Netzel, H., Anderson, R. I., & Viviani, G. 2024, A&A, 687, A118 [NASA ADS] [CrossRef] [EDP Sciences] [Google Scholar]
- Netzel, H., Anderson, R. I., & Viviani, G. 2025, A&A, 694, A273 [NASA ADS] [CrossRef] [EDP Sciences] [Google Scholar]
- Pepe, F., Mayor, M., Galland, F., et al. 2002, A&A, 388, 632 [NASA ADS] [CrossRef] [EDP Sciences] [Google Scholar]
- Pietrukowicz, P. 2001, Acta Astron., 51, 247 [NASA ADS] [Google Scholar]
- Plachy, E., Pál, A., Bódi, A., et al. 2021, ApJS, 253, 11 [NASA ADS] [CrossRef] [Google Scholar]
- Poretti, E., Baglin, A., & Weiss, W. W. 2014, ApJ, 795, L36 [Google Scholar]
- Queloz, D., Henry, G. W., Sivan, J. P., et al. 2001, A&A, 379, 279 [NASA ADS] [CrossRef] [EDP Sciences] [Google Scholar]
- Raskin, G., van Winckel, H., Hensberge, H., et al. 2011, A&A, 526, A69 [CrossRef] [EDP Sciences] [Google Scholar]
- Rathour, R. S., Smolec, R., & Netzel, H. 2021, MNRAS, 505, 5412 [NASA ADS] [CrossRef] [Google Scholar]
- Ripepi, V., Clementini, G., Molinaro, R., et al. 2023, A&A, 674, A17 [NASA ADS] [CrossRef] [EDP Sciences] [Google Scholar]
- Shetye, S. S., Viviani, G., Anderson, R. I., et al. 2024, A&A, 690, A284 [NASA ADS] [CrossRef] [EDP Sciences] [Google Scholar]
- Smolec, R., & Moskalik, P. 2010, A&A, 524, A40 [NASA ADS] [CrossRef] [EDP Sciences] [Google Scholar]
- Smolec, R., Moskalik, P., Evans, N. R., Moffat, A. F. J., & Wade, G. A. 2018, in 3rd BRITE Science Conference, eds. G. A. Wade, D. Baade, J. A. Guzik, & R. Smolec, 8, 88 [Google Scholar]
- Smolec, R., Ziółkowska, O., Ochalik, M., & Śniegowska, M. 2023, MNRAS, 519, 4010 [NASA ADS] [CrossRef] [Google Scholar]
- Süveges, M., & Anderson, R. I. 2018a, MNRAS, 478, 1425 [CrossRef] [Google Scholar]
- Süveges, M., & Anderson, R. I. 2018b, A&A, 610, A86 [NASA ADS] [CrossRef] [EDP Sciences] [Google Scholar]
- Szabados, L. 1983, Ap&SS, 96, 185 [Google Scholar]
- Torres, G. 2023, MNRAS, 526, 2510 [NASA ADS] [CrossRef] [Google Scholar]
- Turner, D. G., Abdel-Sabour Abdel-Latif, M., & Berdnikov, L. N. 2006, PASP, 118, 410 [Google Scholar]
- Usenko, I. A., Kniazev, A. Y., Berdnikov, L. N., Fokin, A. B., & Kravtsov, V. V. 2014, Astron. Lett., 40, 435 [NASA ADS] [CrossRef] [Google Scholar]
- VanderPlas, J. T. 2018, ApJS, 236, 16 [Google Scholar]
Appendix A: Aliases
Table A.1 lists the significant aliases detected in the different periodograms with respect to the same threshold used in the detection of the results in tables 2, 3, 4, and 5. Aliases were detected following Eq. (45) of VanderPlas (2018) and a conservative tolerance of 1% on the peak’s frequency position relative to its alias. The two strongest features of the window were used. For BG Cru, X Sgr and Polaris, the two strongest features were the diurnal component at 1 d−1 and 2 d−1. For δ Cep, the strongest feature was the diurnal component and the second strongest was fW ≅ 0.016 d−1. We note that for Polaris, no alias linked to these two window features were detected above the significance level.
Overview of the most prominent aliases for each star.
Appendix B: Spectrum preprocessing
Ground-based observations are subject to the influence of the Earth’s atmosphere, which introduces two types of unwanted modifications to our stellar observations. First, telluric lines cause a parasitic effect on the star’s absorption lines. Second, the atmosphere introduces low-frequency variations in the spectrum, manifesting as modulations in its overall envelope.
We conducted an extensive investigation into the impact of these phenomena on the performance of shape periodograms (K. Barbey, 2024). When telluric lines, even partially, enter the wavelength range used for the S data set periodograms, they lead to inconsistent results. Conversely, the modulation of the spectral shape affects the significance of the periodogram peaks. While selecting a broader wavelength range increases the number of stellar lines, extending the range too far eventually reduces peak power in the periodogram.
To mitigate the first issue, it is crucial to select a wavelength range free of tellurics. We tested telluric absorption correction tools based on line-by-line radiative transfer models, such as Telfit (Gullikson et al. 2014) and Molecfit (Kausch et al. 2014), but they produced unsatisfactory results. Moreover, their computational cost was prohibitively high for use with long spectral time series.
To address the overall shape modulation and normalise the spectrum, SPARTA applies a first-order Butterworth filter, targeting the low-pass instrumental response and high-pass instrumental noise. The filter’s stop-band frequencies are set to 3(fmax − fmin)−1 for the low-pass and 0.15/(2Δλ) for the high-pass, where Δλ is the wavelength step of the spectrum.
Several other standard procedures are applied to the spectra before constructing the shape periodogram. These include interpolation, removal of cosmic rays and NaN values, and the application of a Tukey window to prevent spectral leakage. An example of the final result of this procedure is shown on Fig. B.1 for δ Cep observed with the HERMES spectrograph and on Fig. B.2 for X Sgr observed with C14. The wavelength range between 5000 and 5800 Å offers an optimal balance in size and spectral location to effectively address both the telluric contamination and overall shape modulation issues using our available tools.
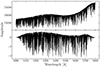 |
Fig. B.1. Comparison between the preprocessed (bottom) and non-preprocessed (top) spectra of δ Cep, observed with HERMES. The amplitudes represented on the y-axis are the flux (top) and the normalised flux (bottom). |
All Tables
All Figures
|
Fig. 1. CCF profiles (solid lines) of X Sgr (left) and BG Cru (right) observed at the same phase during different epochs and their respective Gaussian fit (dashed lines). Cycle-dependent line splitting patterns cause systematic error for RVs derived via fitting Gaussians (Anderson 2013). This phenomenon is much stronger in X Sgr where the systematic error between the two epochs is clearly more discernible than in BG Cru. |
| In the text | |
|
Fig. 2. Sampling of spectroscopic observations for the four Cepheids. The x-axis represents the Barycentric Julian Date (BJD)-2400000 and the y-axis shows the measured radial velocities. We note that Polaris’ time series shows a clear downward trend due to orbital variation (P ∼ 30 yr). |
| In the text | |
|
Fig. 3. Subset examples of normalised CCF profiles, their Gaussian fit, and residual CCF profiles computed by subtracting the median CCF or their respective Gaussian fit to each one of them. The colour coding traces the pulsation phase. Shape modulations are computed with the curves ‘at rest’, centred around the mean RV. For readability, the curves are shown in their original non-centred frame. X Sgr and δ Cep are fundamental mode pulsators whereas BG Cru and Polaris are first overtone ones. Line-splitting is noticeable in BG Cru’s and X Sgr’s C(v) data sets. |
| In the text | |
|
Fig. 4. Shape periodograms for δ Cep. Rows correspond to: CCF profiles, their Gaussian fits, median-residual CCFs, Gaussian-residual CCFs, and normalised spectra. Significant peaks are marked with vertical lines: blue (radial pulsations and additional signals, fFU for the fundamental mode, f1O for the first overtone, and fX for others), red (harmonics, subharmonics, and combination signals; fi, i = 0, 1, 2, …), and green (aliases; ai, i = 0, 1, 2, …). Blue horizontal lines indicate FAL probabilities of p = 0.1, 0.01, and 0.001 (bottom to top). |
| In the text | |
|
Fig. 5. Same as Fig. 4 but for BG Cru. The additional signal fX is probably linked to line splitting. |
| In the text | |
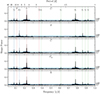 |
Fig. 6. Same as Fig. 4 but for X Sgr. |
| In the text | |
|
Fig. 7. Same as Fig. 4 but for Polaris. We note the increase of the power baseline for small frequencies. |
| In the text | |
|
Fig. B.1. Comparison between the preprocessed (bottom) and non-preprocessed (top) spectra of δ Cep, observed with HERMES. The amplitudes represented on the y-axis are the flux (top) and the normalised flux (bottom). |
| In the text | |
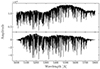 |
Fig. B.2. Same as Fig. B.1 but for X Sgr, observed with C14. |
| In the text | |
Current usage metrics show cumulative count of Article Views (full-text article views including HTML views, PDF and ePub downloads, according to the available data) and Abstracts Views on Vision4Press platform.
Data correspond to usage on the plateform after 2015. The current usage metrics is available 48-96 hours after online publication and is updated daily on week days.
Initial download of the metrics may take a while.