Fig. 4.
Download original image
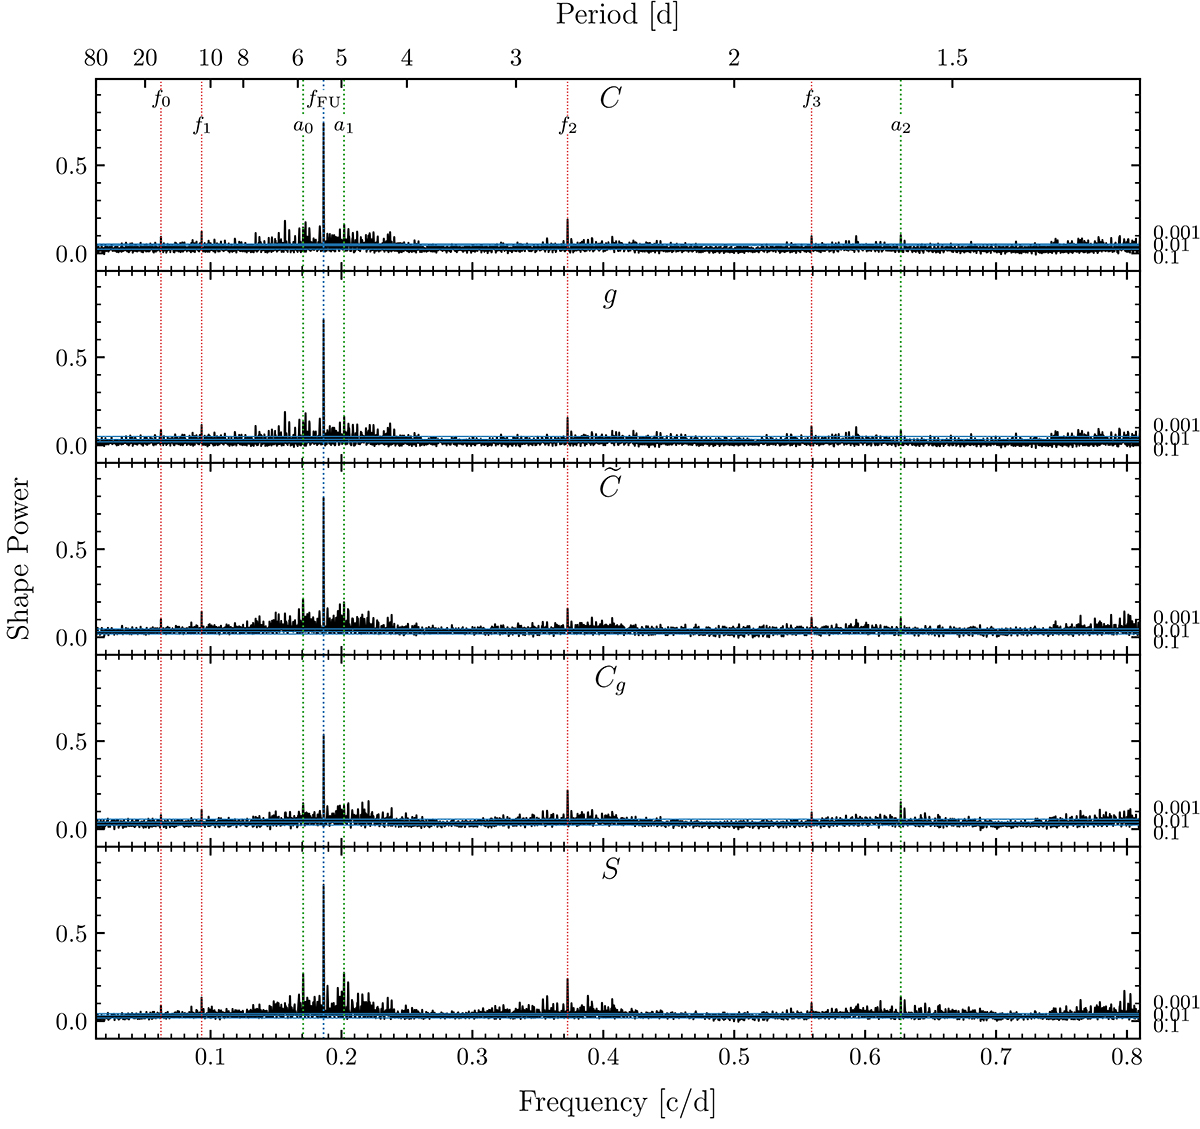
Shape periodograms for δ Cep. Rows correspond to: CCF profiles, their Gaussian fits, median-residual CCFs, Gaussian-residual CCFs, and normalised spectra. Significant peaks are marked with vertical lines: blue (radial pulsations and additional signals, fFU for the fundamental mode, f1O for the first overtone, and fX for others), red (harmonics, subharmonics, and combination signals; fi, i = 0, 1, 2, …), and green (aliases; ai, i = 0, 1, 2, …). Blue horizontal lines indicate FAL probabilities of p = 0.1, 0.01, and 0.001 (bottom to top).
Current usage metrics show cumulative count of Article Views (full-text article views including HTML views, PDF and ePub downloads, according to the available data) and Abstracts Views on Vision4Press platform.
Data correspond to usage on the plateform after 2015. The current usage metrics is available 48-96 hours after online publication and is updated daily on week days.
Initial download of the metrics may take a while.