| Issue |
A&A
Volume 692, December 2024
|
|
|---|---|---|
| Article Number | A133 | |
| Number of page(s) | 9 | |
| Section | Galactic structure, stellar clusters and populations | |
| DOI | https://doi.org/10.1051/0004-6361/202348964 | |
| Published online | 06 December 2024 | |
Considering the incidence rate of RR Lyrae stars with non-radial modes
1
Konkoly Observatory, HUN-REN Research Centre for Astronomy and Earth Sciences, MTA Centre of Excellence,
Konkoly-Thege Miklós út 15–17,
1121
Budapest,
Hungary
2
MTA CSFK Lendület Near-Field Cosmology Research Group,
1121
Konkoly Thege Miklós út 15–17,
Budapest,
Hungary
3
Institute of Physics, Laboratory of Astrophysics, École Polytechnique Fédérale de Lausanne (EPFL),
Observatoire de Sauverny,
1290
Versoix,
Switzerland
4
ELTE Eötvös Loránd University, Institute of Physics and Astronomy,
1117,
Pázmány Péter sétány 1/A,
Budapest,
Hungary
5
Nicolaus Copernicus Astronomical Center,
Bartycka 18,
00-716
Warsaw,
Poland
★ Corresponding author; henia@netzel.pl
Received:
15
December
2023
Accepted:
19
April
2024
Context. Over recent years, additional low-amplitude non-radial modes have been detected in many first-overtone RR Lyrae stars. These non-radial modes form a characteristic period ratio with the dominant first overtone of around 0.61. The incidence rate of this phenomenon varies from population to population. It is also strongly dependent on the quality of the analyzed data. Current models aimed at explaining these additional signals involve non-radial modes of degrees of 8 and 9.
Aims. Using synthetic horizontal branch populations, we investigate the incidence rate of first-overtone RR Lyrae stars with non-radial modes, depending on the population properties, namely, ages and metallicities. We compare our results with the observed results for globular clusters and the vast collection of field first-overtone RR Lyrae stars to test the model predictions.
Methods. We used synthetic horizontal branches combined with pulsation models to predict how the incidence rate would depend on the age and metallicity of the population. To test whether the results based on synthetic horizontal branches are realistic, we compared them to incidence rates observed by TESS in first-overtone field RR Lyrae stars, using photometric metallicity values from a newly established calibration for TESS.
Results. The analysis of synthetic horizontal branches indicates that the incidence rate decreases with decreasing metallicity. We inferred the photometric metallicity for RR Lyrae stars observed by TESS and showed that the theoretical predictions are in agreement with the observations. Using the same method, we also concluded that the metallicity distribution of RR Lyrae stars showing an additional mode with a period-ratio around 0.68 appears to be different from that of 1) all first-overtone stars and 2) those showing additional non-radial modes.
Key words: stars: horizontal-branch / stars: oscillations / stars: variables: RR Lyrae
© The Authors 2024
 Open Access article, published by EDP Sciences, under the terms of the Creative Commons Attribution License (https://creativecommons.org/licenses/by/4.0), which permits unrestricted use, distribution, and reproduction in any medium, provided the original work is properly cited.
This article is published in open access under the Subscribe to Open model. Subscribe to A&A to support open access publication.
1 Introduction
RR Lyrae stars are low-mass population II pulsating stars located at the intersection of the horizontal branch (HB) with the classical instability strip. The majority of them tend to pulsate in radial fundamental mode (RRab type) or first overtone (RRc type). Double-mode pulsations in fundamental mode and first overtone (RRd type) are also often observed among RR Lyrae stars. Double-mode pulsations in the fundamental mode and the second overtone are also known, but still considered to be rare (see e.g., Benkő et al. 2010). Six RR Lyrae stars were reported as possible triple-mode pulsators in radial fundamental mode, first overtone, and second overtone (Jurcsik et al. 2015; Soszyński et al. 2019).
Besides the dominant pulsations in radial modes, many more phenomena are presently known to occur in RR Lyrae stars. One long-standing mystery is the Blazhko effect, which is a quasi-periodic modulation of the amplitude and/or phase of pulsations. It was discovered more than a hundred years ago by Blažko (1907). The Blazhko effect is more common among RRab stars (around 50%, e.g., Jurcsik et al. 2014) than among RRc stars (around 10%, see Netzel et al. 2018). The modulation in RRd stars was also reported, typically in anomalous RRd stars (aRRd; see, e.g., Soszyński et al. 2016, and references therein).
Another phenomenon observed in RR Lyrae stars is the presence of additional signals that cannot correspond to radial modes. Multiple groups of stars with such additional signals were reported already (for a review see Netzel 2023). The so-called RR0.61 stars are the most common group. These are originally classified as either RRc or RRd stars in which the additional low-amplitude short-period signal forms a period ratio of around 0.60–0.64 with the first overtone. A characteristic feature of this group is that these stars form three sequences in the Petersen diagram, namely, a diagram of the period ratio versus a longer period (see, e.g., Fig. 1 in Smolec et al. 2017a). The three sequences are at the period ratio of around 0.61, 0.62, and 0.63. Henceforth, we use f61, f62, f63 when describing individual signals falling into one of these sequences. Currently, more than a thousand RR0.61 stars are known, the majority of which were detected with the ground-based Optical Gravitational Lens-ing Experiment (Netzel & Smolec 2019); additionally, a large sample was recently found in the space-based missions TESS (Benkő et al. 2023) and K2 (Netzel et al. 2023). Additionally, many of the RR0.61 stars were detected during studies of smaller samples (e.g., Jurcsik et al. 2015; Smolec et al. 2017b; Moskalik et al. 2015; Forró et al. 2022; Molnár et al. 2023, and references therein). The explanation of these additional signals was proposed by Dziembowski (2016), who suggested that they are caused by harmonics of non-radial modes of degrees of ℓ = 8,9, where harmonic of the non-radial mode of the degree of 8 corresponds to the f63 signals, while that of the degree of 9 corresponds to the f61 signals. The f62 is a linear combination of the two non-radial modes. We note that similar signals to those in RR0.61 stars were detected in classical Cepheids as well (e.g., Soszyński et al. 2008; Smolec & Sniegowska 2016; Süveges & Anderson 2018; Rathour et al. 2021; Smolec et al. 2023, and references therein). The model by Dziembowski (2016) predicts that the additional signals in classical Cepheids are caused by harmonics of non-radial modes of degrees of ℓ = 7,8,9. Interestingly, a similar signal was only recently detected in one anomalous Cepheid by Plachy et al. (2021).
Another interesting multi-mode group of RR Lyrae stars is the so-called RR0.68 (Netzel et al. 2015a). These are RRc in which the additional signal, f68, has a period that is longer than the first-overtone and forms a period ratio of around 0.686. Since the first detection, more and more RR0.68 stars have been identified in various stellar systems (e.g., Netzel & Smolec 2019; Molnár et al. 2022; Benkő et al. 2023). Again, the analogous multi-mode group was also identified among classical Cepheids (Süveges & Anderson 2018; Smolec et al. 2023). The only explanation for f68 signals was proposed by Dziembowski (2016), but it faces several difficulties (see a discussion in Sect. 4). Only recently, Benkő & Kovács (2023) reported a discovery of analogous signals in RRab stars.
The incidence rates of RR0.61 stars are different depending on the studied sample. The dominant factor influencing the incidence rates is the quality of photometry. Netzel & Smolec (2019) analyzed RRc stars based on the OGLE-IV data for the Galactic bulge fields and obtained an incidence rate of 8.3% for RR0.61 stars. On the other hand, Netzel et al. (2015c) analyzed only the two most frequently sampled Galactic bulge fields from the OGLE-IV data and obtained a significantly higher incidence rate of 27%. As expected, using space-based data typically results in a higher incidence rate than using ground-based photometry. From the ground-based data, the incidence rate does not exceed 60%, except for the NGC 6362 study. There, the incidence rate of the RR0.61 stars is as high as 62.5% of the RRc sample (Smolec et al. 2017b). From the space-based data, the incidence rate usually exceeds 60%. In this regard, a record holder is the stars from the original Kepler field, where the inferred incidence rate reaches 100% (Moskalik et al. 2015; Forró et al. 2022). The literature incidence rates of the RR0.61 stars from different stellar systems and based on various studies are given in Table 1. An interesting result from color-magnitude diagrams is that RR0.61 stars tend to avoid the bluest region (Jurcsik et al. 2015; Smolec et al. 2017b; Molnár et al. 2022). Netzel & Smolec (2022) calculated a grid of theoretical models of RR Lyrae stars pulsating in radial and non-radial modes of degrees predicted by Dziembowski (2016) and showed that close to the blue edge of the instability strip, these non-radial modes are linearly stable. Consequently, in stellar systems with densely populated horizontal branches, the incidence rate of RR0.61 is expected to be lower than 100% due to the lack of excitation of those non-radial modes in the stars close to the blue edge of the instability strip.
The incidence rate is not the only difference between RR0.61 stars from different studies. There are also differences in the Petersen diagram between different samples of RR0.61 stars (see a discussion in Molnár et al. 2022, and their Fig. 13). The scatter, appearance of characteristic sequences, and average period ratio change from sample to sample. At least some differences between the different samples of the RR0.61 stars can be explained by differences in physical parameters, metallici-ties, and ages. The dependence of radial modes content on those parameters has already been studied from both observational and theoretical perspectives. The occurrence of double-mode RR Lyrae stars in different stellar systems was studied recently by Braga et al. (2022), who reported that the fraction of RRd stars to all RR Lyrae stars increases with decreasing metallic-ity of the system. Zhang et al. (2022) reported that the ratio of fundamental to first-overtone classical Cepheids increases with increasing average population metallicity. The mode selection was studied from a theoretical perspective by Szabó et al. (2004) in the context of double-mode RRd stars (see, however, a discussion in Smolec & Moskalik 2008 on problems with modeling double-mode RR Lyrae stars).
In this work, we aim to characterize the incidence rate of RR0.61 stars, assuming that the signals in these stars are indeed explained by non-radial modes of degrees of 8 and 9. First, we calculated synthetic horizontal branches using horizontal branch evolutionary tracks. Then, we used pulsation models to determine how many stars in the horizontal branch would be RRc stars and how many of those would also have non-radial modes of degree of 8 or 9 unstable. We varied age and metallicity when calculating synthetic horizontal branches. Based on those results, we can predict the incidence rate of RR0.61 stars for different metallicities and ages. We tested our results by comparing them with the numerous sample of field RRc stars observed within the TESS project and analyzed by Benkő et al. (2023) and to a few globular clusters which were already analyzed in the literature and have derived observed incidence rates of the RR0.61 stars. Additionally, we present a distribution of photometric metallicity for RR0.68 stars based on the numerous sample identified by Benkő et al. (2023) in the TESS data.
The paper is structured as follows. Our methods are presented in Sect. 2. Our results are described in Sect. 3 and discussed in Sect. 4. In Sect. 5, we summarize our findings.
2 Methods
2.1 Synthetic horizontal branches
We followed the method from Lee et al. (1990) to create synthetic horizontal branches for a given age and metallicity. The masses are drawn randomly from the truncated Gaussian distribution:
![$\matrix{ {P(M) = \left[ {M - \left( {\left\langle {{M_{{\rm{HB}}}}} \right\rangle - {\rm{\Delta }}M} \right)} \right]\left( {{M_{RG}} - M} \right)} \cr { \times \exp \left[ { - {{{{\left( {\left\langle {{M_{{\rm{HB}}}}} \right\rangle - M} \right)}^2}} \over {\sigma _{\rm{M}}^2}}} \right],} \cr } $](/articles/aa/full_html/2024/12/aa48964-23/aa48964-23-eq1.png) (1)
(1)
where M is the mass of each horizontal branch star, 〈MHB〉 is a mean mass of stars on the horizontal branch, MRG is a mass of a star on the tip of the red giant branch if no mass loss occurred, ΔM is mass lost on average, namely, ΔM = MRG − 〈MHB〉, and σM is a mass dispersion. We assumed that stars arrive at the horizontal branch at a constant rate regardless of mass, namely, the age is drawn randomly from a uniform distribution. We chose four values of MRG: 0.80M⊙, 0.83M⊙, 0.85M⊙, and 0.88M⊙. The MRG value translates to age. That is to say, the higher the mass, MRG, the younger the system. For Z ≈ 0.001 these masses correspond to the ages of around 13.7,12,11, and 9.7 Gyr, respectively. For lower metallicities, Z ≈ 0.0003, thses masses correspond to the ages of around 12.5, 11, 10, and 9 Gyr.
We used solar-scaled horizontal branch tracks from the BaSTI database (Pietrinferni et al. 2004). From the available tracks, we chose four sets of tracks for the following metal and helium abundances (Z, Y): (0.0001, 0.245), (0.0003, 0.245), (0.0006, 0.246), and (0.001, 0.246). These values were chosen arbitrarily to cover the metallicity range of RR Lyrae stars and correspond to [M/H]= −2.267, [M/H]= −1.790, [M/H]= −1.488, and [M/H]= −1.266, respectively. For each value of mass, MRG, and metallicity, we interpolated between the evolutionary tracks using linear interpolation to obtain the synthetic horizontal branch population. Each horizontal branch was populated with 500 stars. We adopted σM = 0.02 to be constant. We also set ΔM = 0.15. We note that in the literature both values are varied. The average mass loss can also be connected to metallicity. In this analysis, however, we did not study those nuances. The principal goal is to study main trends, not to reproduce a particular globular cluster exactly. We also repeated the same analysis using α–enhanced tracks from the BaSTI database and the results do not change the conclusion drawn from the analysis of solar-scaled tracks.
In Fig. 1, we plotted simulated horizontal branch stars for different MRG and two values of metal abundance: Z = 0.001 (top panel) and Z = 0.0001 (bottom panel). The population is shifting towards lower effective temperatures for higher MRG. For the same MRG, the population is shifted towards lower temperatures for higher Z. In the case of Z = 0.001, the population corresponding to MRG = 0.88 M⊙ is outside the instability strip. In the case of Z = 0.0001, the population corresponding to the lowest considered mass, MRG = 0.80 M⊙, is located outside of the instability strip.
In Fig. 2, we plotted synthetic HB stars for different metal abundances Z, and two different MRG values: 0.80 (top panel) and 0.88 M⊙ (bottom panel). First, for lower mass, MRG = 0.8 M⊙, the scatter on the HR diagram is larger. The effect of metal abundance is clearly visible. Namely, the higher the metallicity, the more towards the lower effective temperature is the population shifted. Consequently, inside the instability strip, the stars are shifted towards lower luminosities with increasing metallicity forming a known absolute brightness–metallicity relation, MV−[Fe/H] (e.g., Fernley et al. 1998). As already visible from Fig. 1, for the lowest mass and lowest metallicity, and the population is located outside the instability strip. The same situation is for the highest mass and the highest metal abundance.
We note that in Figs. 1 and 2 the instability strip edges are plotted based on Marconi et al. (2015), who provides a position of the fundamental red edge and first-overtone blue edge. However, to select first-overtone RR Lyrae stars from the synthetic populations, it is necessary to know the position of the first-overtone red edge. Therefore, we calculated blue and red edge for the first-overtone pulsations using envelope pulsation code MESA-RSP (Paxton et al. 2019). We calculated a grid of models for each value of metal and helium abundance matching the values of the evolutionary tracks. For each grid, we chose one value of mass based on mass-metallicity relation from Castellani et al. (1991). For Z = 0.0001, we set M = 0.74M⊙; for Z = 0.0003, we set M = 0.70M⊙; for Z = 0.0006, we set M = 0.67 M⊙; and for Z = 0.001, we set M = 0.65 M⊙. We used αMLT = 1.5 and convective parameters from set A in Paxton et al. (2019). The grid was calculated for three values of luminosity log L/L⊙ ∈ (1.5,1.6,1.7) and for effective temperatures from Teff = 5700 K to 8000 K with a step of 100 K. Linear calculations were carried out and based on the linear growth rates the positions of the edges were interpolated for each metallicity.
Incidence rates of RR0.61 stars from the literature.
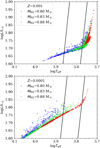 |
Fig. 1 Synthetic horizontal branch stars on the Hertzsprung-Russell diagram. The mass at the tip of the RGB is color-coded as indicated in the key. Black lines are instability strip edges from Marconi et al. (2015). Top panel: for Z = 0.001. Bottom panel: for Z = 0.0001. |
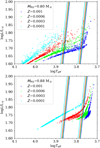 |
Fig. 2 Synthetic horizontal branch stars on the Hertzsprung-Russell diagram. Metallicity abundance, Z, is color-coded, as indicated in the key. The instability strip edges from Marconi et al. (2015) are plotted with lines whose color also corresponds to Z. Top panel: for MRG = 0.80 M⊙. Bottom panel: for MRG = 0.88 M⊙. |
2.2 Incidence rate based on synthetic horizontal branches
To estimate the incidence rate of RRc stars with non-radial modes of degrees of 8 or 9, we used the grid of models already calculated by Netzel & Smolec (2022). The models were calculated using the envelope code by Dziembowski (1977), which is discussed in detail in Netzel & Smolec (2022). Here, we briefly provide the most important information. The mass range covered by the grid is 0.5–0.9 M⊙ with a step of 0.01 M⊙. The metallicity ranges from −3.0 dex to +0.1 dex with a 0.05 dex step. The luminosity, log L/L⊙, range is 1.3–1.8 dex, with a step of 0.01 dex, and the effective temperature, log Teff, range is from 3.75 to 3.91 dex, with a step of 0.005 dex. The number of all models included in the grid is over two million. For further study, we selected four subgrids of models with matching Z. On average, each subgrid has around 33 000 models with linearly unstable first-overtone and around 15000 and 20000 were non-radial modes of degrees of 8 and 9 are unstable, respectively. We note that the used envelope code is not able to calculate the position of the red edge of the first-overtone instability strip due to the frozen-in approximation of convection. We used the calculated edges described in Sect. 2.1. We also note that the used edges are linear, while a more realistic nonlinear red edge for the first-overtone is hotter.
The method used to derive the incidence rate based on synthetic horizontal branch and pulsation models is presented in Fig. 3. Simulated stars on the synthetic horizontal branch are plotted with crosses. The models located in the grey area have at least one non-radial mode linearly unstable. First-overtone red edge is plotted with a red solid line, while blue edge is plotted with a blue solid line. For a given metallicity, we compared the positions of the synthetic horizontal-branch population with selected regions of instability strip provided by theoretical models. In Fig. 3, the synthetic population is plotted with black if it is outside the instability strip. In green, we plotted those stars that should be RRc stars with additional non-radial modes. Pure RRc stars are plotted with orange. In order to estimate the incidence rate together with its error, we simulated 20 HB populations for a given metallicity and MRG. We counted the number of RRc stars with additional non-radial modes and all RRc stars in each simulation and the resulting incidence rate is an average from incidence rates from 20 simulations. The errors were estimated through the bootstrap resampling technique, employing a confidence level of 95% based on percentiles.
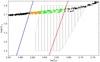 |
Fig. 3 Example of synthetic horizontal branch together with pulsation models used for incidence rate estimation. The models plotted with gray were calculated with the MESA-RSP code from Paxton et al. (2019). In these models, at least one non-radial mode is unstable. The red and blue line correspond to the red and blue edge for first-overtone pulsations. Synthetic horizontal branch stars are plotted with black crosses when they are outside of the instability strip, in orange if they have unstable first-overtone but stable non-radial modes, and in green when first overtone and non-radial modes are unstable. |
2.3 Metallicity observations
To further test whether the models attempts to explain the extra signals in RRc light curves with high-order non-radial modes are correct, a comparison of the synthetic and the observed metallicity dependencies of incidence rates offers a valuable resource.
For a thorough analysis, good-quality light curves are needed to detect the extra signals in as many cases as possible. In this work, we used TESS photometric measurements processed by Benkő et al. (2023). This provides us with 1357 time series analyzed in total for 670 stars brighter than 14 mag, from which 23 blended and 14 non-RRc stars were omitted leaving 633 stars for the further analysis. We note that the higher number of time series stems from the fact that some of the stars were observed during multiple TESS sectors.
Spectroscopic metallicities were not available for most of these stars. However, metallicity may be estimated in an empirical way, based on light curve shape and pulsation period. For RRc stars, the formulae were first established by Morgan et al. (2007). The thus-derived photometric metallicities are much less precise than those determined by high-resolution spectroscopy, but for a statistical purpose (and not an individual case), as in our study, such approach is sufficient. A difficulty in the photometric metallicity estimations is, however, that the shape of the light curve varies with optical filters; therefore, the calibration of the relation has to be done separately for different passbands. Lacking a fit for TESS, we have established a new calibration for the RRc subtype. Here, we present only the key aspects, with more details found in Varga et al. (in prep.).
As the photometric calibration dataset, the same set as that for the extra signal detection (Benkő et al. 2023) was used, while spectroscopic metallicities were provided by the Carnegie RR Lyrae Survey (CARRS, Kollmeier et al. 2013; Sneden et al. 2018). The cross-matched calibration sample consisted of 96 stars. To describe the light curve, the P1O first-overtone period and the φ31 = φ3 − 3φ1 Fourier phase difference were used, along with [Fe/H] indices describing the metallicity. Benkő et al. (2023) provided this value for 632 out of 633 stars. For the empirical relation, we ended up using a second-degree polynomial in the following form and getting the following values of the four fitting parameters:
![$[Fe/{\rm{H}}] = - 0.26 \cdot \varphi _{31}^2 - 11.5 \cdot {P_{10}} + 0.96 \cdot {\varphi _{31}} + 2.05.$](/articles/aa/full_html/2024/12/aa48964-23/aa48964-23-eq3.png) (2)
(2)
The fitting process did not consider the varying confidence in the data points of the calibration sample, hence, the fitting parameters should be considered preliminary and their final values are yet to be published in Varga et al. (in prep.). The spectroscopic metallicity values of the calibration sample range from −2.7 dex to −0.3 dex, and the root mean square deviation (RMSD) of the fit is 0.23 dex. Using such established relation for the Benkő et al. (2023) TESS sample, an [Fe/H] value was provided for all 632 stars with known φ31 values.
The conversion to total Z metallicities is not a straightforward procedure. Kollmeier et al. (2013) reported that CARRS abundance measurements were performed by fitting to a grid of synthetic spectra generated by MOOG, for which the atomic line lists began with the Kurucz (2011) line database, followed by further refinements. Kurucz (2011) uses the solar abundances of Anders & Grevesse (1989), who are reportedly (Grevesse et al. 2013) overestimated. Thus, despite not being the solar reference used for the abundance measurements, we can obtain presumably more accurate Z values calculating with the total solar metallicity value Z⊙ = 0.0134 of Asplund et al. (2009), approximating the iron contents and total metallicities to be proportional, therefore, using the formula:
![$Z = {Z_ \odot } \cdot {10^{[{\rm{Fe}}/{\rm{H}}]}}.$](/articles/aa/full_html/2024/12/aa48964-23/aa48964-23-eq4.png) (3)
(3)
We note that in case of using a higher solar metallicity reference, such as that of Anders & Grevesse (1989), the observed trends and therefore conclusions remain the same.
Theoretical incidence rates.
3 Results
3.1 Theoretical incidence rate
Using synthetic horizontal branches for four values of metal abundance, Z, and four values of mass at the tip of the red giant branch, MRG , we were able to determine the incidence rates for different populations. These results are collected in Table 2 and presented in Fig. 4. We note that one population is not plotted. In the case of MRG = 0.88 M⊙ and Z = 0.001, namely, the young and metal-rich population, there were no stars inside the instability strip, as the population was redder than the red edge (compare with Fig. 2).
There are two trends visible in Fig. 4. The incidence rate of the RR0.61 stars depends on both metallicity and MRG of the given population. The incidence rate decreases with decreasing metallicity. Moreover, the incidence rate is typically lower for lower values of MRG, which corresponds to older populations. The lowest (non-zero) values of incidence rate are reached by the population of Z = 0.0001 and MRG = 0.83 M⊙, and the highest is for Z = 0.001 and MRG = 0.85 M⊙, and for Z = 0.0006 and MRG = 0.88 M⊙.
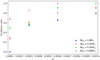 |
Fig. 4 Incidence rate of RR0.61 stars as a function of metal abundance, Z. The incidence rate is calculated based on synthetic horizontal branches and pulsation models (see text for details). Different colors and symbols correspond to different masses on the tip of the red giant branch as indicated in the key. |
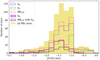 |
Fig. 5 Distribution of photometric metallicity for RRc stars observed by TESS and analyzed by Benkő et al. (2023). Yellow bins correspond to all RRc stars. With different line colors and types, we plotted stars that have additional signals detected as indicated in the key. The f61, f63, and f68 refer to the respective signals, while RR0.61 represents all RRc stars that show any signal that suggests the presence of the non-radial modes (l = 8 or l = 9). This means the inclusion of f63, f61, f62, and their sub-harmonics and combinations frequencies. Note: metallicity values below −2.7 dex or above −0.3 dex are results of extrapolation and, therefore, should be treated with caution. |
3.2 Metallicity of RR Lyrae stars with additional signals
We determined the photometric metallicity for RRc stars studied by Benkő et al. (2023). The distribution of metallicities is plotted in Fig. 5 for all RRc stars, and for RRc stars that were identified by Benkő et al. (2023) to show additional signals as indicated in the key.
The majority of RRc stars in Fig. 5 have metallicity values ranging from −2.0 dex to −1.0 dex. However, there are stars that have metallicity as low as −3.5 dex and as high as 0.0 dex. Stars classified as RR0.61 or with f61 or f63 signals have metallicity distributions that do not display large-scale differences compared to the distribution of all RRc stars. Interestingly, stars with f68 have a distribution that differs from the distribution of all RRc stars. Typically, the RR0.68 stars have lower metallicities than all RRc stars as well as RRc stars with f61 or f63 signals. The majority of the RR0.68 have metallicity values from −1.7 dex to −1.3 dex. Moreover, while RRc stars with and without f61 signals can reach relatively high metallicities, the RR0.68 have not been detected for metallicities above −0.5 dex. The particularly interesting stars are those simultaneously classified as RR0.61 and RR0.68 stars, which are also included in the distribution in Fig. 5. Their metallicity distribution shows more resemblance to the one for stars with f68 than to RR0.61.
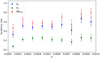 |
Fig. 6 Incidence rates of the f61 and f63 frequencies and of all RR0.61 stars observed by TESS, as function of photometric metallicity abundance, Z. The meaning of symbols in the key is the same as in Fig. 5. |
3.3 Observed metallicity dependence of incidence rates
In Fig. 6, the incidence rates of RR0.61 stars out of all RRc stars are shown, subdivided into groups defined by their more precise period-ratio, namely, the f61 and the f63 signals. We converted the photometrically estimated [Fe/H] values to total Z metallicities, then calculated the incidence rates using bins from Z = 10−4 to Z = 10 ⋅ 10−4 with a width of ΔZ = 10−4. The uncertainties of the incidence rates were calculated as the standard error of the sample mean.
Comparing the observed incidence rates of at least one signal (red crosses) in Fig. 6 to the simulated results on Fig. 4 suggests a resemblance in trends. Notably, both distributions indicate lower incidence rates with decreasing metallicity. However, this observation should be verified using metallicity measurements that have better accuracy than those obtained with photometric metallicity calibrations.
4 Discussion
4.1 RR0.61 stars
The predicted trend of decreasing incidence rate of the RR0.61 stars with decreasing metal abundance was compared with observed incidence rates for field stars observed with TESS in Fig. 6. The observed and predicted trends, indicating a decrease in incidence rates with decreasing Z, seem to align well, suggesting that the simulated results and the underlying theoretical background are justified. The observed values of the incidence rates corresponding to all manifestations of non-radial modes, namely, RR0.61 in Fig. 6, are within the range of the incidence rates based on the models. We note the uncertainties of photometric metallicities are higher than of those determined spectro-scopically. While the trend in observed photometric metallicities from the TESS sample seem to match simulated trends, this conclusion should be verified using metallicities that have smaller uncertainties.
The most uniform populations that we could compare our results to are globular clusters. Several known globular clusters were already analyzed for the occurrence of additional signals in RR Lyrae stars (see Table 1): M80, NGC5897, M3, and NGC 6362. Interestingly, in the case of NGC 5897, which is the lowest metallicity of the above-discussed globular clusters, the incidence rate is only 11% (Kalup et al. in prep.). We included these four globular clusters in Fig. 7. For M3 we adopted [Fe/H] = −1.50, for M4 − [Fe/H] = −1.18, for NGC6362 − [Fe/H] = −1.07, and for NGC 5897 - [Fe/H] = −1.9 (Carretta et al. 2009). We used Eq. (3) to calculate Z. Interestingly, incidence rates for these four globular clusters appear to follow the same trend with metallicity, although the values of incidence rates are lower than the trend set by the models.
The caveat of the comparison between globular clusters is that they were studied using different instruments and photometric systems. M80 and NGC5897 were observed during the K2 mission, while the observations of M3 and NGC 6362 were carried out in V band using different ground-based telescopes. These differences cause different detection limits of the f0.61 signals and the incident rates cannot be directly compared. To estimate the impact of this problem on our analysis, we consider the lowest amplitude of an additional signal detected with a given instrument as a rough estimate of its detection limit. This gives a detection limit of 0.5 mmag for M80 and NGC 5897, 5 mmag for M3, and 2.3 mmag for NGC6362. The amplitudes of the f0.61 signals are lower for V band than for I band by roughly a factor of two (see Fig. 8 in Jurcsik et al. 2015). Since the Kp band spans approximately from I to V band, we assume that the amplitude of signals in Kp band is at most twice as large as in the V band. Even with this assumption some stars discovered in K2 would not be detected in the case of M3 and NGC 6362. Hence, the incidence rate for M3 and NGC 6362 is likely underestimated. We conclude that indeed the underlying incidence rate for M3 and NGC 6362 is likely higher than for NGC 5897 and M80.
The incidence rates observed for globular clusters seem to be lower than based on the models. There are multiple factors that might cause this difference. First, there are observational limitations. In some stars, the additional signals might have amplitudes lower than the noise level and therefore not be identified as RR0.61. This is certainly an important factor since the observed incidence rates are strongly correlated with the quality of photometry. Moreover, distributions of amplitudes of additional signals in RR0.61 stars show a rise in the number of stars towards low amplitudes until the cutoff due to data limitations (see, e.g., Figs. 4 and 5 in Netzel & Smolec 2019, and Fig. 11 in Benkő et al. 2023).
Second, the signals in RR0.61 stars are not stable. Specifically, their amplitude and/or phase often vary in time. As a consequence, they form wide structures in frequency spectra, which is commonly observed (see, e.g., Fig. 9 in Netzel et al. 2023). With longer and more precise data, it is possible to trace this variability in time. For instance, Netzel et al. (2015c) showed that frequency spectra of RR0.61 stars can drastically change from observing season to observing season (see their Fig. 10). The long-term monitoring of four RRc stars in the Kepler field allowed us to trace these changes in more detail (see Figs. 6 and 7 in Moskalik et al. 2015), which turned out to be significant. The irregularity of changes was also shown based on observations of stars in the continuous viewing zone of TESS (see Figs. 17 and 18 in Benkő et al. 2023). These changes might contribute to another mechanism that decreases the observed incidence rate; namely, some RR0.61 stars might be simply observed during phases of low amplitude of f61,62,63 due to its non-stationary nature and, therefore, not identified as RR0.61.
The third effect that leads to decrease of the predicted incidence rate is the fact that the non-linear first-overtone red edge is hotter than the linear red edge. Therefore the number of RRc stars with unstable non-radial modes will decrease and consequently the incidence rate will be lower.
As visible from Table 2, in our simulated young and metal-rich populations there are no RR Lyrae stars. We note that there are known RR Lyrae stars with high metallicities (e.g., Liu et al. 2013), which have kinematics consistent with young thin disk (e.g., Iorio & Belokurov 2021) However, the ages of individual stars are not precisely known to verify this. Moreover, such young and metal-rich RR Lyrae stars are difficult to obtain through standard formation channel. Bobrick et al. (2024) showed that they can be created through binary evolution. To test whether young and metal-rich RR Lyrae stars population exists, we used the collection of RR Lyrae stars in galactic globular clusters prepared by Cruz Reyes et al. (2024). For metal-rich globular clusters, we searched for ages in the literature and checked their population of RR Lyrae stars. Our search revealed that indeed in this sample there is no young and metal-rich globular cluster with sizeable population of RR Lyrae stars. The only candidate is Terzan 7, whose metallicity is estimated around [Fe/H]≈ −0.6 (Harris 1996) or [Fe/H] ≈ −0.6 (Sbordone et al. 2005; Tautvaišienė et al. 2004). Its age is estimated to be 9 Gyr by Buonanno et al. (1995) or 6 Gyr by Tautvaišienė et al. (2004). However, this cluster contains only one RR Lyrae star (Cruz Reyes et al. 2024).
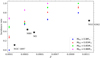 |
Fig. 7 Aame as Fig. 4, but with four globular clusters added. They are plotted with black star symbols and their IDs are indicated in the figure. |
4.2 RR0.68 stars
The analysis of photometric metallicities for a large sample of RRc stars from the TESS data leads to additional noteworthy results regarding the RR0.68 stars. The metallicity of the RR0.68 stars have a different distribution than all RRc stars and the metallicity of the RR0.68 stars is typically lower. We applied the Komogorov-Smirnov test to verify the difference between the two distributions. We assumed that the uncertainity of all metallicity measurements is 0.23 dex, namely, RMSD of the fit (see Sect. 2.3). The test yielded a Kolmogorov-Smirnov statistic of 0.19 and a p-value of 0.001. With a significance level of 0.05, the null hypothesis that the two samples were drawn from the same distribution was rejected. This indicates a statistically significant difference between the distributions of the RR0.68 and all RRc stars.
This is important in the context of explaining the nature of the RR0.68 stars. At present, the nature of the additional signal is unknown. Dziembowski (2016) showed that the period ratio of around 0.68 can be reproduced by pulsations in radial fundamental mode and first overtone if the RR0.68 stars are in fact not true RR Lyrae stars, but low-mass giants stripped from their envelopes, similarly to the case of a binary evolution pulsator (Pietrzyński et al. 2012). This explanation, however, is challenged by stars that show f61,62,63 and f68 signals simultaneously. Such stars were already detected from the ground and space-based photometry (e.g., Netzel & Smolec 2019; Benkő et al. 2023; Netzel et al. 2023). Therefore, the explanations proposed for RR0.61 stars and for RR0.68 stars are mutually exclusive. We note that f68 signals were also detected in classical Cepheids since the development of the theory by Dziembowski (2016) and only recently detected in RRab stars (Benkő & Kovács 2023). So far, there was no clear observed difference between the RR0.61 and the RR0.68 stars. In this study, we show for the first time that in fact, the RR0.61 and the RR0.68 stars show differences. This observation will hopefully contribute to future efforts aimed atexplaining the nature of the additional signals in the RR0.68 stars.
5 Conclusions
We considered synthetic horizontal branch populations to investigate the incidence rate of stars with non-radial modes of degrees of ℓ = 8,9. We calculated the populations for four values of metallicity, (Z(0.001, 0.246), (0.0006, 0.246), (0.0003, 0.245), and (0.0001, 0.245), and for four values of mass at the tip of the red giant branch, MRG: 0.80M⊙, 0.83 M⊙, 0.85 M⊙, and 0.88 M⊙. We used BaSTI horizontal-branch evolutionary tracks (Pietrinferni et al. 2004). We used MESA-RSP code by Paxton et al. (2019) to derive the instability strip edge for first-overtone pulsations, and a grid of models from Netzel & Smolec (2022) to get the region of the instability strip where the non-radial pulsations in modes of degrees of 8 and 9 occur.
We compared our theoretical predictions of incidence rates with observed incidence rates of RR0.61 stars. We used four globular clusters with derived incidence rates: NGC 5897 (Kalup et al. in prep.), M80 (Molnár et al. 2023), M3 (Jurcsik et al. 2015), and NGC 6362 (Smolec et al. 2017b). We also used RRc stars observed by TESS and analyzed by Benkő et al. (2023). For this sample, we derived photometric metallicities based on our newly established calibration for TESS. Our findings are as follows:
For a population with metallicity of Z = 0.001 and mass at the tip of the red giant branch, MRG=0.88M⊙, namely, metal-rich and young population, all stars were outside of the instability strip. In other words, this population did not contain any RR Lyrae stars;
For the rest of the combinations the incidence rate varied from high values, close to 100% to relatively low (non-zero) values of almost 20%;
The theoretically predicted incidence rate decreases with decreasing metallicity;
The theoretically predicted incidence rate is lower for lower values of MRG, namely, for older populations;
The trend of decreasing incidence rate with decreasing metallicity appear in agreement with the observed values of incidence rates for four globular clusters. The values of observed incidence rates are systematically smaller than predicted by simulations (see the discussion in Sect. 4);
The RR0.61 stars from the TESS sample also show the slight trend of decreasing incidence rate with decreasing metallicity, but are subject to the relatively significant error bars.
We investigated the differences between metallicity distributions for the whole RRc TESS sample and stars classified as RR0.61 or RR0.68. The distributions of the photometric metallicity for the whole RRc TESS sample and the RR0.61 stars do not show large-scale differences. Interestingly, RRc stars with the f68 signals show a metallicity distribution that significantly differs from the rest of the RRc sample. Overall, RR0.68 stars tend to have lower metallicities and this is also the case for the RR0.61 stars with f68 signals.
Acknowledgements
This work has made use of BaSTI web tools. This project has been supported by the Lendület Program of the Hungarian Academy of Sciences, project No. LP2018-7/2022, the ‘SeismoLab’ KKP-137523 Élvonal grant and OTKA projects K-129249 and NN-129075 of the Hungarian Research, Development and Innovation Office (NKFIH), as well as the MW-Gaia COST Action (CA18104). This work was supported by the European Research Council (ERC) under the European Union’s Horizon 2020 research and innovation programme (Grant Agreement No. 947660). VV is supported by the ÚNKP-22-1 New National Excellence Program of the Ministry for Culture and Innovation from the source of the National Research, Development and Innovation Fund, and by the undergraduate research assistant program of Konkoly Observatory. RSm acknowledges financial support by the Polish National Science Centre (NCN) under Sonata Bis grant 2018/30/E/ST9/00598. We thank K. Iłkiewicz for constructive discussions.
References
- Anders, E., & Grevesse, N. 1989, Geochim. Cosmochim. Acta, 53, 197 [Google Scholar]
- Asplund, M., Grevesse, N., Sauval, A. J., & Scott, P. 2009, ARA&A, 47, 481 [NASA ADS] [CrossRef] [Google Scholar]
- Benkő, J. M., Kovács, G. B. 2023, A&A, 680, L6 [NASA ADS] [CrossRef] [EDP Sciences] [Google Scholar]
- Benkő, J. M., Kolenberg, K., Szabó, R., et al. 2010, MNRAS, 409, 1585 [CrossRef] [Google Scholar]
- Benkő, J. M., Plachy, E., Netzel, H., et al. 2023, MNRAS, 521, 443 [Google Scholar]
- Blažko, S. 1907, Astron. Nachr., 175, 325 [Google Scholar]
- Bobrick, A., Iorio, G., Belokurov, V., et al. 2024, MNRAS, 527, 12196 [Google Scholar]
- Braga, V. F., Fiorentino, G., Bono, G., et al. 2022, MNRAS, 517, 5368 [NASA ADS] [CrossRef] [Google Scholar]
- Buonanno, R., Corsi, C. E., Pulone, L., et al. 1995, AJ, 109, 663 [NASA ADS] [CrossRef] [Google Scholar]
- Carretta, E., Bragaglia, A., Gratton, R., D’Orazi, V., & Lucatello, S. 2009, A&A, 508, 695 [NASA ADS] [CrossRef] [EDP Sciences] [Google Scholar]
- Castellani, V., Chieffi, A., & Pulone, L. 1991, ApJS, 76, 911 [NASA ADS] [CrossRef] [Google Scholar]
- Cruz Reyes, M., Anderson, R. I., Johansson, L., Netzel, H., & Medaric, Z. 2024, A&A, 684, A173 [NASA ADS] [CrossRef] [EDP Sciences] [Google Scholar]
- Dziembowski, W. 1977, Acta Astron., 27, 95 [NASA ADS] [Google Scholar]
- Dziembowski, W. A. 2016, Commmun. Konkoly Observ. Hung., 105, 23 [NASA ADS] [Google Scholar]
- Fernley, J., Skillen, I., Carney, B. W., Cacciari, C., & Janes, K. 1998, MNRAS, 293, L61 [CrossRef] [Google Scholar]
- Forró, A., Szabó, R., Bódi, A., & Császár, K. 2022, ApJS, 260, 20 [CrossRef] [Google Scholar]
- Grevesse, N., Asplund, M., Sauval, A. J., & Scott, P. 2013, in Astronomical Society of the Pacific Conference Series, 479, Progress in Physics of the Sun and Stars: A New Era in Helio- and Asteroseismology, eds. H. Shibahashi, & A. E. Lynas-Gray, 481 [NASA ADS] [Google Scholar]
- Harris, W. E. 1996, AJ, 112, 1487 [Google Scholar]
- Iorio, G., & Belokurov, V. 2021, MNRAS, 502, 5686 [Google Scholar]
- Jurcsik, J., Smitola, P., Hajdu, G., & Nuspl, J. 2014, ApJ, 797, L3 [NASA ADS] [CrossRef] [Google Scholar]
- Jurcsik, J., Smitola, P., Hajdu, G., et al. 2015, ApJS, 219, 25 [NASA ADS] [CrossRef] [Google Scholar]
- Kollmeier, J. A., Szczygiel, D. M., Burns, C. R., et al. 2013, ApJ, 775, 57 [NASA ADS] [CrossRef] [Google Scholar]
- Kurucz, R. L. 2011, Can. J. Phys., 89, 417 [Google Scholar]
- Lee, Y.-W., Demarque, P., & Zinn, R. 1990, ApJ, 350, 155 [Google Scholar]
- Liu, S., Zhao, G., Chen, Y.-Q., Takeda, Y., & Honda, S. 2013, Res. Astron. Astrophys., 13, 1307 [CrossRef] [Google Scholar]
- Marconi, M., Coppola, G., Bono, G., et al. 2015, ApJ, 808, 50 [Google Scholar]
- Molnár, L., Szabó, R., Moskalik, P. A., et al. 2015, MNRAS, 452, 4283 [CrossRef] [Google Scholar]
- Molnár, L., Bódi, A., Pál, A., et al. 2022, ApJS, 258, 8 [CrossRef] [Google Scholar]
- Molnár, L., Plachy, E., Bódi, A., et al. 2023, A&A, 678, A104 [NASA ADS] [CrossRef] [EDP Sciences] [Google Scholar]
- Morgan, S. M., Wahl, J. N., & Wieckhorst, R. M. 2007, MNRAS, 374, 1421 [NASA ADS] [CrossRef] [Google Scholar]
- Moskalik, P., Smolec, R., Kolenberg, K., et al. 2015, MNRAS, 447, 2348 [NASA ADS] [CrossRef] [Google Scholar]
- Netzel, H. 2023, arXiv e-prints [arXiv:2310.14824] [Google Scholar]
- Netzel, H., & Smolec, R. 2019, MNRAS, 487, 5584 [NASA ADS] [CrossRef] [Google Scholar]
- Netzel, H., & Smolec, R. 2022, MNRAS, 515, 3439 [NASA ADS] [CrossRef] [Google Scholar]
- Netzel, H., Smolec, R., & Dziembowski, W. 2015a, MNRAS, 451, L25 [NASA ADS] [CrossRef] [Google Scholar]
- Netzel, H., Smolec, R., & Moskalik, P. 2015b, MNRAS, 447, 1173 [NASA ADS] [CrossRef] [Google Scholar]
- Netzel, H., Smolec, R., & Moskalik, P. 2015c, MNRAS, 453, 2022 [Google Scholar]
- Netzel, H., Smolec, R., Soszynski, I., & Udalski, A. 2018, MNRAS, 480, 1229 [NASA ADS] [Google Scholar]
- Netzel, H., Molnár, L., Plachy, E., & Benko, J. M. 2023, A&A, 677, A177 [NASA ADS] [CrossRef] [EDP Sciences] [Google Scholar]
- Paxton, B., Smolec, R., Schwab, J., et al. 2019, ApJS, 243, 10 [Google Scholar]
- Pietrinferni, A., Cassisi, S., Salaris, M., & Castelli, F. 2004, ApJ, 612, 168 [Google Scholar]
- Pietrzynski, G., Thompson, I. B., Gieren, W., et al. 2012, Nature, 484, 75 [CrossRef] [Google Scholar]
- Plachy, E., Pál, A., Bódi, A., et al. 2021, ApJS, 253, 11 [NASA ADS] [CrossRef] [Google Scholar]
- Rathour, R. S., Smolec, R., & Netzel, H. 2021, MNRAS, 505, 5412 [NASA ADS] [CrossRef] [Google Scholar]
- Sbordone, L., Bonifacio, P., Marconi, G., Buonanno, R., & Zaggia, S. 2005, A&A, 437, 905 [NASA ADS] [CrossRef] [EDP Sciences] [Google Scholar]
- Smolec, R., & Moskalik, P. 2008, Acta Astron., 58, 233 [NASA ADS] [Google Scholar]
- Smolec, R., & Sniegowska, M. 2016, MNRAS, 458, 3561 [NASA ADS] [CrossRef] [Google Scholar]
- Smolec, R., Dziembowski, W., Moskalik, P., et al. 2017a, in European Physical Journal Web of Conferences, 152, European Physical Journal Web of Conferences, 06003 [CrossRef] [EDP Sciences] [Google Scholar]
- Smolec, R., Moskalik, P., Kaluzny, J., et al. 2017b, MNRAS, 467, 2349 [NASA ADS] [Google Scholar]
- Smolec, R., Ziólkowska, O., Ochalik, M., & Sniegowska, M. 2023, MNRAS, 519, 4010 [NASA ADS] [CrossRef] [Google Scholar]
- Sneden, C., Preston, G. W., Kollmeier, J. A., et al. 2018, AJ, 155, 45 [NASA ADS] [CrossRef] [Google Scholar]
- Soszynski, I., Poleski, R., Udalski, A., et al. 2008, Acta Astron., 58, 163 [NASA ADS] [Google Scholar]
- Soszynski, I., Udalski, A., Szymanski, M. K., et al. 2016, Acta Astron., 66, 131 [NASA ADS] [Google Scholar]
- Soszynski, I., Udalski, A., Wrona, M., et al. 2019, Acta Astron., 69, 321 [NASA ADS] [Google Scholar]
- Süveges, M., & Anderson, R. I. 2018, MNRAS, 478, 1425 [CrossRef] [Google Scholar]
- Szabó, R., Kolláth, Z., & Buchler, J. R. 2004, A&A, 425, 627 [NASA ADS] [CrossRef] [EDP Sciences] [Google Scholar]
- Tautvaišiene, G., Wallerstein, G., Geisler, D., Gonzalez, G., & Charbonnel, C. 2004, AJ, 127, 373 [CrossRef] [Google Scholar]
- Zhang, Z., Jiang, B., Ren, Y., Chen, X., & Wang, S. 2022, ApJ, 928, 139 [NASA ADS] [CrossRef] [Google Scholar]
All Tables
All Figures
|
Fig. 1 Synthetic horizontal branch stars on the Hertzsprung-Russell diagram. The mass at the tip of the RGB is color-coded as indicated in the key. Black lines are instability strip edges from Marconi et al. (2015). Top panel: for Z = 0.001. Bottom panel: for Z = 0.0001. |
| In the text | |
|
Fig. 2 Synthetic horizontal branch stars on the Hertzsprung-Russell diagram. Metallicity abundance, Z, is color-coded, as indicated in the key. The instability strip edges from Marconi et al. (2015) are plotted with lines whose color also corresponds to Z. Top panel: for MRG = 0.80 M⊙. Bottom panel: for MRG = 0.88 M⊙. |
| In the text | |
|
Fig. 3 Example of synthetic horizontal branch together with pulsation models used for incidence rate estimation. The models plotted with gray were calculated with the MESA-RSP code from Paxton et al. (2019). In these models, at least one non-radial mode is unstable. The red and blue line correspond to the red and blue edge for first-overtone pulsations. Synthetic horizontal branch stars are plotted with black crosses when they are outside of the instability strip, in orange if they have unstable first-overtone but stable non-radial modes, and in green when first overtone and non-radial modes are unstable. |
| In the text | |
|
Fig. 4 Incidence rate of RR0.61 stars as a function of metal abundance, Z. The incidence rate is calculated based on synthetic horizontal branches and pulsation models (see text for details). Different colors and symbols correspond to different masses on the tip of the red giant branch as indicated in the key. |
| In the text | |
|
Fig. 5 Distribution of photometric metallicity for RRc stars observed by TESS and analyzed by Benkő et al. (2023). Yellow bins correspond to all RRc stars. With different line colors and types, we plotted stars that have additional signals detected as indicated in the key. The f61, f63, and f68 refer to the respective signals, while RR0.61 represents all RRc stars that show any signal that suggests the presence of the non-radial modes (l = 8 or l = 9). This means the inclusion of f63, f61, f62, and their sub-harmonics and combinations frequencies. Note: metallicity values below −2.7 dex or above −0.3 dex are results of extrapolation and, therefore, should be treated with caution. |
| In the text | |
|
Fig. 6 Incidence rates of the f61 and f63 frequencies and of all RR0.61 stars observed by TESS, as function of photometric metallicity abundance, Z. The meaning of symbols in the key is the same as in Fig. 5. |
| In the text | |
|
Fig. 7 Aame as Fig. 4, but with four globular clusters added. They are plotted with black star symbols and their IDs are indicated in the figure. |
| In the text | |
Current usage metrics show cumulative count of Article Views (full-text article views including HTML views, PDF and ePub downloads, according to the available data) and Abstracts Views on Vision4Press platform.
Data correspond to usage on the plateform after 2015. The current usage metrics is available 48-96 hours after online publication and is updated daily on week days.
Initial download of the metrics may take a while.