Fig. 3
Download original image
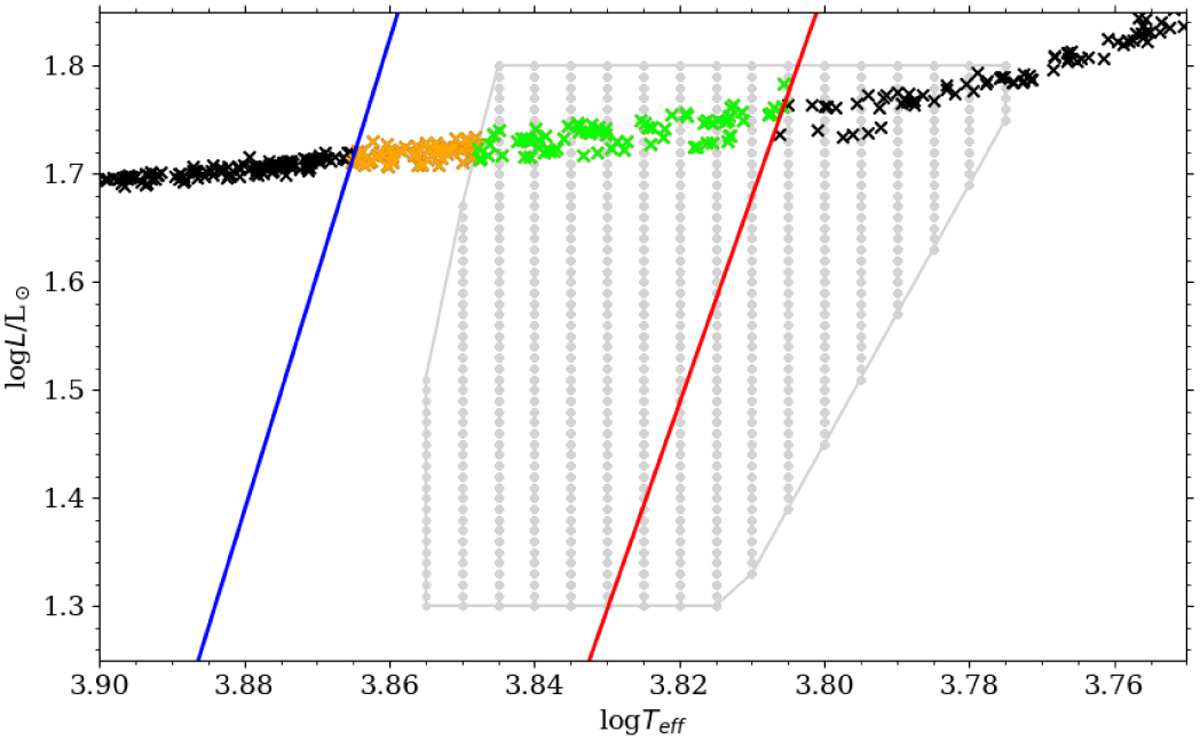
Example of synthetic horizontal branch together with pulsation models used for incidence rate estimation. The models plotted with gray were calculated with the MESA-RSP code from Paxton et al. (2019). In these models, at least one non-radial mode is unstable. The red and blue line correspond to the red and blue edge for first-overtone pulsations. Synthetic horizontal branch stars are plotted with black crosses when they are outside of the instability strip, in orange if they have unstable first-overtone but stable non-radial modes, and in green when first overtone and non-radial modes are unstable.
Current usage metrics show cumulative count of Article Views (full-text article views including HTML views, PDF and ePub downloads, according to the available data) and Abstracts Views on Vision4Press platform.
Data correspond to usage on the plateform after 2015. The current usage metrics is available 48-96 hours after online publication and is updated daily on week days.
Initial download of the metrics may take a while.