Open Access
Fig. 2
Download original image
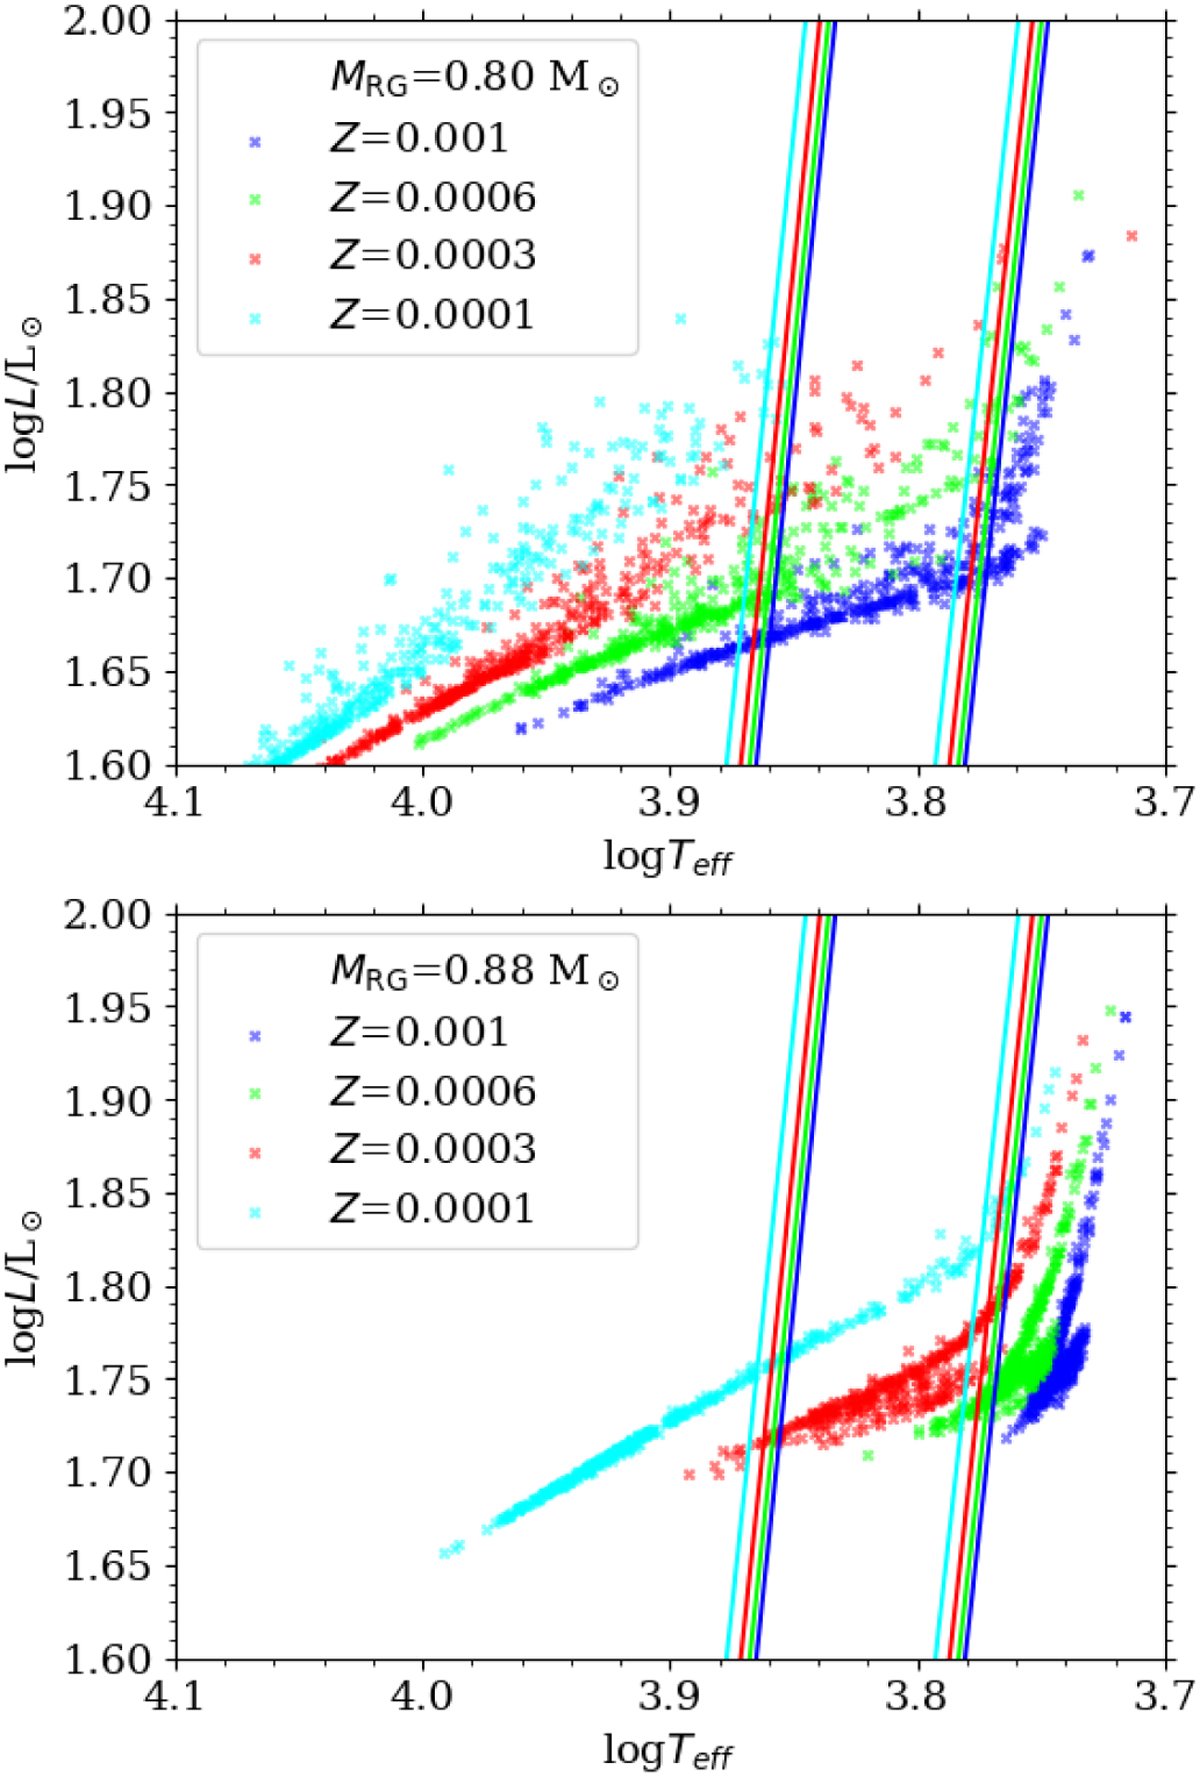
Synthetic horizontal branch stars on the Hertzsprung-Russell diagram. Metallicity abundance, Z, is color-coded, as indicated in the key. The instability strip edges from Marconi et al. (2015) are plotted with lines whose color also corresponds to Z. Top panel: for MRG = 0.80 M⊙. Bottom panel: for MRG = 0.88 M⊙.
Current usage metrics show cumulative count of Article Views (full-text article views including HTML views, PDF and ePub downloads, according to the available data) and Abstracts Views on Vision4Press platform.
Data correspond to usage on the plateform after 2015. The current usage metrics is available 48-96 hours after online publication and is updated daily on week days.
Initial download of the metrics may take a while.